Preserved wake-dependent cortical excitability
dynamics predict cognitive
fitness beyond
age-related brain alterations
Maxime Van Egroo
1,6
, Justinas Narbutas
1,2,6
, Daphne Chylinski
1,6
, Pamela Villar González
1
,
Pouya Ghaemmaghami
1
, Vincenzo Muto
1
, Christina Schmidt
1,2
, Giulia Gaggioni
1
, Gabriel Besson
1
,
Xavier Pépin
1
, Elif Tezel
1
, Davide Marzoli
1
, Caroline Le Goff
3
, Etienne Cavalier
3
, André Luxen
1
,
Eric Salmon
1,2,4
, Pierre Maquet
1,4
, Mohamed Ali Bahri
1
, Christophe Phillips
1,5
, Christine Bastin
1,2
,
Fabienne Collette
1,2
& Gilles Vandewalle
1
*
Age-related cognitive decline arises from alterations in brain structure as well as in
sleep-wake regulation. Here, we investigated whether preserved sleep-wake-dependent regulation of
cortical function could represent a positive factor for cognitive
fitness in aging. We quantified
cortical excitability dynamics during prolonged wakefulness as a sensitive marker of
age-related alteration in sleep-wake regulation in 60 healthy older individuals (50
–69 y;
42 women). Brain structural integrity was assessed with amyloid-beta- and tau-PET, and with
MRI. Participants
’ cognition was investigated using an extensive neuropsychological task
battery. We show that individuals with preserved wake-dependent cortical excitability
dynamics exhibit better cognitive performance, particularly in the executive domain which is
essential to successful cognitive aging. Critically, this association remained significant after
accounting for brain structural integrity measures. Preserved dynamics of basic brain function
during wakefulness could therefore be essential to cognitive
fitness in aging, independently
from age-related brain structural modi
fications that can ultimately lead to dementia.
https://doi.org/10.1038/s42003-019-0693-y
OPEN
1GIGA-Cyclotron Research Centre-In Vivo Imaging, University of Liège, Liège, Belgium.2Psychology and Cognitive Neuroscience Research Unit, University of
Liège, Liège, Belgium.3Department of Clinical Chemistry, University Hospital of Liège, Liège, Belgium.4Department of Neurology, University Hospital of
Liège, Liège, Belgium.5GIGA-In Silico Medicine, University of Liège, Liège, Belgium.6These authors contributed equally: Maxime Van Egroo, Justinas Narbutas, Daphne Chylinski. *email:gilles.vandewalle@uliege.be
123456789
A
ging is associated with an overall cognitive decline
trig-gered in part by a progressive degradation of brain
structure. Limited but notable neuronal loss takes place
during healthy adulthood
1. In addition, tau protein, which
sta-bilizes axonal structure and contributes to synaptic function, and
amyloid-beta (Aβ) protein, a peptide directly related to neuronal
activity, progressively aggregate in the brain over the lifespan to
form neurofibrillary tangles (NFTs) and senile plaques,
respec-tively
2. Tau NFTs, Aβ plaques, and neurodegeneration favor
cognitive decline
3. They are considered as major underlying
causes of dementia and constitute the hallmarks of Alzheimer’s
disease (AD)
4. However, age-related changes in brain structure go
undetected for decades: tau protein aggregation takes place as
early as during the second decade of life in the brainstem, while
Aβ aggregates can be detected around the 4th decade in the
neocortex
5.
One of the
first signs of AD- and age-related brain structural
degradation may reside in alterations in the regulation of sleep
and wakefulness
6. Sleep–wake disruption is indeed strongly
associated with AD neuropathology
7: gray matter (GM) integrity
has been associated with measures of sleep quality, including
sleep slow waves characteristics, in cross-sectional and
long-itudinal studies
8,9. Aβ and tau burdens in healthy older
indivi-duals have been associated with the amount of slow waves
generated during non-rapid eye movement (NREM) sleep
10,11.
Importantly, Aβ burden has been reported to affect memory
performance through its impact on sleep slow waves in elderly
individuals (~75 years)
11. In addition, the presence of preclinical
Aβ plaque pathology, assessed through PET imaging or
cere-brospinal
fluid collection, is associated with fragmentation of the
entire rest-activity cycle, i.e. encompassing both sleep and
wakefulness
12. Whether age-related alteration in brain structure
may affect sleep–wake regulation of daytime brain activity is
unknown, however.
Sleep and wakefulness are regulated by two fundamental
pro-cesses: sleep homeostasis, which keeps track of time awake, and
circadian rhythmicity, which temporally organizes physiology
and behavior
13,14. The strength of both processes seems to
decrease with age, resulting in dampened dynamics of sleep–wake
rhythms and reduced variations in brain activity both during
sleep and prolonged wakefulness
13. The generation of slow waves
during sleep, which is associated with the dissipation of sleep
need, is reduced in aging
15. Likewise, cortical excitability
16, a
basic aspect of brain function implicated in age-related cognitive
decline
17,18, shows less variations during prolonged wakefulness.
Age-related alterations in the regulation of sleep and wakefulness
are not only associated with current cognition
19,20, but also
predicts future cognitive trajectories, including the risk of
devel-oping dementia
12,21–23. Importantly, some of the changes in
sleep–wake regulation take place as early as in middle-aged
individuals (>40 years)
15. Whether the early alterations in sleep
and wakefulness regulation and their potential cognitive
con-sequences are systematically related to age-related alterations in
brain structure remains unknown.
The goals of the present study were threefold. First, we assessed
whether sleep–wake regulation of the awake and active brain is
linked to age-related alterations in brain structure in healthy older
individuals (50–70 years). We measured cortical excitability based
on electroencephalographic (EEG) responses to transcranial
magnetic stimulation (TMS) during a wake-extension protocol
and hypothesized that the dynamics of cortical excitability during
wakefulness would be related to both Aβ and tau burden, taking
into account any potential neurodegeneration. We further
investigated whether wake-dependent variations in cortical
excitability are linked to cognitive
fitness. Based on previous
findings
16, we anticipated that cortical excitability dynamics
would be associated with executive performance. Finally, we
tested whether these putative links would be independent of Aβ
and tau burden as well as neurodegeneration. We postulated that
the inclusion of the three markers of brain structural integrity in
our statistical models would at least decrease, if not remove, the
association between cognition and wake-dependent cortical
excitability dynamics.
Analyses reveal that frontal cortical excitability dynamics
during prolonged wakefulness display a high variability across
individuals, with some older people exhibiting preserved or
young-like regulation profiles of cortical function. Preserved
cortical excitability regulation profiles were associated with better
cognitive performance, particularly in the executive domain
which is central to successful cognitive aging. Importantly, the
association between cognition and wake-dependent regulation of
cortical function was independent of GM volume as well as Aβ
and tau protein burden.
Results
In a multi-modal cross-sectional study (Fig.
1
a), 60 healthy and
cognitively normal late middle-aged individuals (42 women; age
range 50–69 years, mean ± SD = 59.6 ± 5.5 years; Table
1
)
underwent structural MRI to measure GM volume, as well as
[18F]Flutemetamol and
[18F]THK-5351 PET imaging to quantify Aβ
and tau burden, respectively. Participants’ cognitive performance
while well-rested was assessed with an extensive
neuropsycholo-gical task battery probing memory, attention, and executive
functions. After a week of regular sleep–wake schedule,
partici-pants’ habitual sleep was recorded in-lab under EEG to quantify
slow waves generation during NREM sleep. A wake-extension
protocol started on the following day and consisted of 20 h of
continuous wakefulness to trigger a moderate realistic sleep–wake
challenge. Wake-extension was conducted under strictly
con-trolled constant routine conditions known to unmask the
com-bined influences of sleep homeostasis and of the circadian system
by removing or reducing potential biases from light exposure,
physical activity, food intake or room temperature
14. Cortical
excitability over the frontal cortex was measured
five times over
the 20 h protocol, using TMS combined with an
electro-encephalogram (TMS-EEG) (Fig.
1
b–d)
16,24. Mean time between
wake-extension protocol and cognitive assessment was 30.6 ±
37.7 days. Mean time between wake-extension protocol and brain
structural integrity assessments was 56.7 ± 78.9 days for MRI,
121.3 ± 97.1 days for Aβ-PET, and 116.3 ± 108.3 days for
Tau-PET.
Whole-brain GM volume was 41.04 ± 3.73% of total intracranial
volume and showed the expected reduction with increasing age
(F
1,56= 5.86, p = 0.02, semi-partial R² (R²
β*)
= 0.10;
Supplemen-tary Fig. 1a). Mean standardized uptake value ratio (SUVR) for Aβ
and tau burden were respectively 1.16 ± 0.08 and 1.32 ± 0.10 and
both showed a statistical trend for a positive association with age
(Aβ: F
1,56= 3.74, p = 0.06; Tau: F
1,56= 3.71, p = 0.06;
Supple-mentary Fig. 1b, c). Furthermore, whole-brain Aβ burden was
strongly associated with whole-brain tau burden (F
1,55= 16.00,
p
= 0.0002, R²
β*= 0.23; Supplementary Fig. 1d).
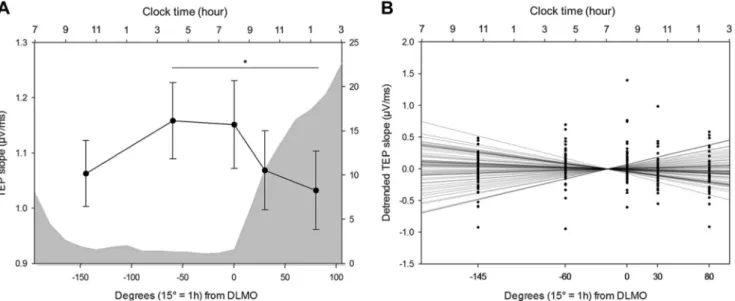
Cortical excitability dynamics during wakefulness extension.
We
first investigated wake-dependent changes in cortical
excit-ability during the protocol, using a generalized linear mixed
model (GLMM) including random intercept and repeated
mea-surement autoregression [AR(1)]. Cortical excitability during
prolonged wakefulness underwent significant changes with time
awake after adjusting for age, sex, and education (GLMM, main
effect of circadian phase; F
4,234.1= 4.29, p = 0.0023, R²
β*= 0.07;
Fig.
2
a). Post hoc analyses revealed a global decrease from the
beginning to the end of the protocol, with significant differences
between the second and last TMS-EEG sessions (p
adj= 0.007),
and between the third and last sessions (p
adj= 0.02). Visual
inspection of individual data indicated, however, an important
variability in cortical excitability values and in cortical excitability
dynamics. The majority of subjects (N
= 35, 25 women) displayed
an overall decrease in cortical excitability throughout the
proto-col, whereas ~40% of the sample (N
= 25, 17 women) exhibited
an overall increase in cortical excitability, similar to what was
previously reported in young adults
24,25.
To account for this variability, we summarized cortical
excitability dynamics at the individual level using a single value
consisting in the regression coefficient of a linear fit across the five
TMS-EEG measurements (Fig.
2
b). Individual residuals indicated
that regression quality was good overall and regression
coeffi-cients reflected the differences between the first and last sessions
of the protocol in most subjects (Supplementary methods).
Therefore, the frontal cortical excitability profile (CEP) obtained
through the regression
fit across the protocol epitomizes cortical
excitability dynamics and does not reflect random signal
variations. We qualified individuals with positive regression
coefficient as young-like CEP, and those with negative regression
coefficient as old-like CEP. When considered as two separate
groups, young-like and old-like CEP displayed distinct temporal
patterns [GLMM, group × circadian phase interaction; F
4,234.1=
13.69, p < 0.0001, R²
β*= 0.19; significant between-group post-hoc
at circadian phase 30° (p
adj= 0.02) and 80° (p = 0.01);
Supplementary Fig. 2], but did not differ in any of the
demographic or sleep–wake related variables reported in Table
1
(p > 0.05). Importantly, frontal CEP was considered as a
continuous variable for all statistical analyses reported below
and we did not consider young-like and old-like CEP as separate
groups.
CEP and sleep slow waves generation. We then confronted the
validity of frontal CEP as a measure of sleep–wake regulation by
testing its association with slow waves generation during sleep
26.
We found that frontal CEP was significantly related to slow wave
energy (SWE), a cumulative measure of slow waves generated
during NREM sleep, both in the slower range (0.75–1 Hz, F
1,55=
5.35, p
= 0.02, R²
β*= 0.09, Fig.
3
a) and in the higher range
(1.25–4 Hz, F
1,55= 5.47, p = 0.02, R²
β*= 0.09, Fig.
3
b), such that
young-like frontal CEP was associated with increased, and
pre-sumably preserved SWE. We further found that SWE in the lower
0.75–1 Hz range was expectedly associated with GM volume
(F
1,53= 7.90, p = 0.007, R²
β*= 0.13), as well as with whole-brain
Aβ burden (F
1,53= 5.15, p = 0.03, R²
β*= 0.09, Fig.
3
c),
confirm-ing previous reports
11,27, but was not linked to whole-brain tau
burden (F
1,53= 1.26, p = 0.27). In contrast, CEP was not
asso-ciated with any of the brain structural integrity measures (GM:
F
1,53= 0.18, p = 0.67; Aβ: F
1,53= 0.16, p = 0.69; Tau: F
1,53= 0.48,
p
= 0.49). Frontal CEP relates therefore to a gold standard
mea-sure of sleep homeostasis known to decline in aging
13,15and to be
Fig. 1 Study design and cortical excitability assessment. a Overview of the whole experimental protocol and the timing of the different steps for a representative subject with bedtime at 11:00PM and wake time at 07:00AM. AN: adaptation night with polysomnography to screen for sleep apnea; BN: baseline night under EEG recording.b Cortical excitability over the frontal cortex was assessed using neuronavigation-based TMS coupled to EEG. Left: reconstructed head with electrodes position; Right: representative location of TMS coil and stimulation hotspot with electricfield orientation. c Butterfly plot of TMS-evoked EEG response over the 60 electrodes (−100 ms pre-TMS to 300 ms post-TMS; average of ~250 trials). d Representative TMS-evoked EEG potential (0–32 ms post-TMS) in the five TMS-EEG sessions with indicative clock time and circadian phase (15° = 1 h). Cortical excitability was computed as the slope (µV/ms) of the first component of the TMS-evoked EEG response at the electrode closest to the hotspot (dotted line: example for 10:00AM session).associated with Aβ burden
11, but is not significantly linked to the
hallmarks of AD neuropathology.
CEP and cognition. We tested whether frontal CEP and NREM
SWE were related to global, memory, attentional, and executive
cognitive performance in GLMMs including sex, age, and
edu-cation as covariates. NREM SWE was not associated with any of
the cognitive measures (Supplementary Table 1). In contrast, CEP
was significantly and positively associated with global cognitive
composite score, after accounting for the expected effects of age
and education (F
1,55= 6.76, p = 0.01, R²
β*= 0.11, Table
2
,
Fig.
4
a). In other words, individuals displaying preserved frontal
cortical excitability dynamics, i.e. young-like positive CEP, had
better overall cognitive performance, compared to those
char-acterized by old-like negative CEP. Strikingly, we further found a
specific and strong positive association between frontal CEP and
performance in the executive domain (F
1,55= 8.47, p = 0.005,
R²
β*= 0.13, Table
2
, Fig.
4
b). By contrast, neither memory
(F
1,55= 0.41, p = 0.52) nor attention (F
1,55= 2.44, p = 0.12) were
associated with CEP (Table
2
, Fig.
4
c, d), suggesting that the link
between CEP and global cognition mainly arises from the
executive domain. Replacing CEP by the difference between the
first and last TMS-EGG sessions led to similar statistical
out-comes, ensuring that our
findings are not a spurious consequence
of the linear regression
fit approach and thus reflect the
sleep–wake-dependent regulation of the build-up of sleep need on
basic brain function (Supplementary methods; Supplementary
Table 2).
CEP and age-related changes in brain structure. We found no
association between the hallmarks of AD neuropathology and
global, memory, attentional, and executive cognitive performance
(Table
3
). Critically, including region-specific brain structural
integrity measures in the GLMMs seeking for associations
between CEP and cognitive measures did not affect the statistical
outcomes (Table
3
); if anything, the link between CEP and
executive performance became slightly stronger as suggested by
semi-partial R² values (R²
β*= 0.13 vs. R²
β*= 0.16). Results were
similar if we considered brain structural integrity measures only
over the TMS stimulation target area, i.e. the superior frontal
gyrus (Supplementary Table 3). The associations between CEP
and cognition may therefore be independent of brain structural
integrity measures.
Discussion
Healthy aging is accompanied by a disruption of sleep and
wakefulness regulation that participates to age-related cognitive
decline. Sleep–wake modifications are rooted in part in
age-related alterations in brain structure that can lead to AD. Previous
investigations found that brain activity during sleep is related to
Aβ burden, and that Aβ burden affects memory performance
through modifications in brain activity during sleep
11. This was
however reported in elderly individuals (75.1 ± 3.5 years)
11, in
which Aβ and tau proteins accumulation as well as
neurode-generation are likely relatively important, while daytime brain
activity was not assessed. Here, we confirm that brain activity
during sleep is associated with Aβ burden also in healthy
late middle-aged individuals (59.6 ± 5.5 years). Yet, in this
rela-tively large (N
= 60) younger sample, slow waves generation
during sleep is not associated with tau burden nor with cognitive
measures including memory, attention, and executive functions.
We demonstrate instead that, at around 60 years,
wake-dependent variations of basic cortical function is associated
with cognitive
fitness, independently of Aβ and tau burden and
GM volume.
Previous studies investigating the same stimulation area
reported an overall increase in cortical excitability during
pro-longed wakefulness in young individuals (ref.
24, 40 h of sleep
deprivation, six participants aged 25–41 years; ref.
25, 29 h of sleep
deprivation, 24 participants aged 19–30 years), whereas only
smaller variations were detected in healthy older individuals
(ref.
16, 34 h of sleep deprivation, 13 young aged 19–27 years and
13 older participants aged 59–69 years). Here, in a larger sample
size of older individuals, we showed that a mild wakefulness
extension results in significant changes in cortical excitability with
time awake. Over the entire sample, cortical excitability globally
decreased from the beginning to the end of the protocol, with
marked differences between the late-afternoon and the night time
sessions. We further show that, amongst healthy older
indivi-duals, a large proportion (~40%) of participants displayed an
overall wake-dependent increase in frontal cortical excitability
which is similar to what was previously reported in young
adults
24,25. We interpret this as a sign of preserved, or young-like,
temporal dynamics of cortical excitability, which corresponds to a
positive CEP or linear regression coefficient over the entire
pro-tocol. Importantly, we
find that positive CEP is correlated to
increased slow waves generation during habitual sleep, suggesting
that individuals with young-like CEP during wakefulness are
characterized by a stronger and potentially preserved sleep
homeostasis drive during sleep
13, compared to individuals with
old-like CEP. This strongly suggests that frontal CEP is a measure
of the active brain during wakefulness that reflects individuals’
preservation of sleep–wake regulation processes.
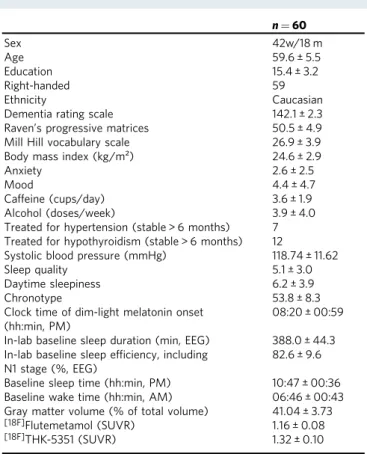
Table 1 Sample characteristics (mean ± SD).
n = 60 Sex 42w/18 m Age 59.6 ± 5.5 Education 15.4 ± 3.2 Right-handed 59 Ethnicity CaucasianDementia rating scale 142.1 ± 2.3
Raven’s progressive matrices 50.5 ± 4.9 Mill Hill vocabulary scale 26.9 ± 3.9 Body mass index (kg/m²) 24.6 ± 2.9
Anxiety 2.6 ± 2.5
Mood 4.4 ± 4.7
Caffeine (cups/day) 3.6 ± 1.9
Alcohol (doses/week) 3.9 ± 4.0
Treated for hypertension (stable > 6 months) 7 Treated for hypothyroidism (stable > 6 months) 12
Systolic blood pressure (mmHg) 118.74 ± 11.62
Sleep quality 5.1 ± 3.0
Daytime sleepiness 6.2 ± 3.9
Chronotype 53.8 ± 8.3
Clock time of dim-light melatonin onset (hh:min, PM)
08:20 ± 00:59 In-lab baseline sleep duration (min, EEG) 388.0 ± 44.3 In-lab baseline sleep efficiency, including
N1 stage (%, EEG)
82.6 ± 9.6 Baseline sleep time (hh:min, PM) 10:47 ± 00:36 Baseline wake time (hh:min, AM) 06:46 ± 00:43 Gray matter volume (% of total volume) 41.04 ± 3.73
[18F]Flutemetamol (SUVR) 1.16 ± 0.08
[18F]THK-5351 (SUVR) 1.32 ± 0.10
Anxiety was measured by the 21-item Beck Anxiety Inventory53; mood by the 21-item Beck
Depression Inventory II54; caffeine and alcohol consumption by self-reported questionnaires;
sleep quality by the Pittsburgh Sleep Quality Index55; daytime sleepiness by the Epworth
Sleepiness Scale56; chronotype by the Horne‐Östberg questionnaire (no participants were
extreme chronotypes, i.e. scores <30 or >7057). Systolic blood pressure was measured in-bed
after laying down for >15 min and 1 to 2 h prior to bedtime
Critically, we found that higher frontal CEP is associated with
better overall cognitive performance, demonstrating a significant
relationship between cortical excitability dynamics during
wake-fulness and cognition, which are both measured in an active and
awake brain. In-depth cognitive phenotyping showed that this
relationship was mainly driven by the performance in the
executive domain. Executive functions refer to high-order
cog-nitive processes (flexibility, inhibition, updating, etc.) needed for
behavioral adjustment according to ongoing goals when facing
new or complex situations
28. Variations in executive performance
assessed during sleep deprivation were previously found to be
associated with cortical excitability dynamics in older and
younger individuals
16. Here, we further show that cognitive
ability, as an individual trait measured outside a sleep deprivation
protocol, is significantly associated with sleep–wake regulation of
frontal cortical excitability. Executive functions influence other
cognitive domains and are often seen as central in age-related
cognitive decline to remain adapted to the environment and
sustain day-to-day functioning in complete autonomy
29. In
addition, executive functions are considered to depend mainly on
the frontal cortex processes, and their underlying cortical
networks undergo important changes in healthy aging
30. These
results therefore suggest that preserved frontal CEP may
con-stitute a marker of cognitive
fitness in aging, and particularly so in
the executive domain.
Despite the relative youth of our sample (~60 years), the
absence of association between cognitive measures and brain
integrity markers of GM volume and protein burdens may appear
surprising. Longitudinal studies have shown, however, that the
association between some aspects of cognition and brain structure
was especially apparent in participants aged 65 years and over
31.
Subtle differences in cognitive performance in relation to proteins
accumulation or GM reduction may therefore not appear in our
sample. This may also underlie the absence of significant
asso-ciation between sleep slow waves generation and tau burden that
has been recently reported in an older sample of healthy
indivi-duals (73.8 ± 5.3 years)
10. Furthermore, our sample is biased
towards individuals with higher education (mean 15.5 ± 3.2 years)
and with cognitive and brain reserves that may compensate for
early alteration of brain structural integrity
3,32. Alternatively, the
composite scores for each cognitive domain may not be sensitive
enough to be related to these early brain alterations. Nonetheless,
Fig. 3 Cortical excitability, slow wave energy, and brain structural integrity. a Positive association between CEP and cumulated frontal NREM SWE in the lower range (0.75–1 Hz) during habitual sleep (n = 60; F1,55= 5.35, p = 0.02, R²β*= 0.09). b Positive association between CEP and cumulated frontal NREM SWE in the higher range (1.25–4 Hz) during habitual sleep (n = 60; F1,55= 5.47, p = 0.02, R²β*= 0.09). c Negative association between NREM SWE (0.75–1 Hz range) and whole-brain amyloid-beta burden (n = 60; F1,53= 5.15, p = 0.03, R²β*= 0.09). Simple regressions were used only for a visual display and do not substitute the GLMM outputs. Dotted lines represent 95% confidence interval of these simple regressions.Fig. 2 Cortical excitability dynamics as a marker of sleep–wake regulation processes. a Average cortical excitability dynamics (mean ± SEM) during 20 h of prolonged wakefulness over the entire sample (n= 60). Gray background represents the average melatonin secretion profile (0° indicating dim-light melatonin onset, i.e. the beginning of the biological night; 15°= 1 h). *padj< 0.01.b Detrended cortical excitability values of all individuals and their respective linear regression lines across thefive TMS-EEG measurements.
our
findings indicate that sleep–wake regulation of brain activity
during wakefulness, as measured by the dynamics of cortical
excitability during a mild wakefulness extension, is either more
sensitive than brain structural integrity markers to isolate
asso-ciations with cognition in aging, or sensitive to aspects of
cogni-tion that undergo influences distinct from protein accumulacogni-tions
and neurodegeneration. Another explanation to our results might
involve the soluble forms of Aβ and tau, as oligomers of both
proteins were shown to alter neuronal function
33,34. Currently
these oligomers cannot be reliably measured in vivo and could not
be accounted for in this experiment.
Furthermore,
age-related
molecular
changes
potentially
underlying sleep need have been reported
35. These may influence
the local or global genetic and molecular machineries underlying
circadian rhythmicity and sleep homeostasis, and in turn affect
cortical excitability. Ageing modulates the impact of the basal
forebrain, subcortical and brainstem ascending activating system
on global brain activity
36. In silico modeling of wake-dependent
cortical excitability changes in young adults suggests that the
fluctuations in the balance between excitation and inhibition
within cortical networks may affect the observed variations
dur-ing prolonged wakefulness
37. However, this remains unexplored
in healthy older individuals. It might also be the case that changes
in cortical function stems from AD-related alteration of
sub-cortical structures. In addition to the locus coeruleus
5,
neurode-generation of the suprachiasmatic nuclei, site of the master
circadian clock, has been reported in AD
38while network
uncoupling in the suprachiasmatic nuclei is found in normal
aging
39. Future investigations should also examine whether
cor-tical excitability dynamics, probed specifically over the frontal
regions, are related to cognitive changes in aging when compared
to cortical excitability dynamics probed over other parts of the
brain and to other aspects of cognitive brain functions.
Further-more, the predictive value of frontal CEP assessment for
sub-sequent cognitive decline and risk of developing dementia
remains to be investigated in a longitudinal protocol.
This study presents several strengths. The use of TMS-EEG
allows for a direct measure of cortical responsiveness while
bypassing sensory systems and it mimics active brain processing
without confounding biases. The prolonged wakefulness protocol
is performed under strictly controlled constant routine conditions
to control for multiple factors that could affect wakefulness and
sleep parameters, such as light exposure or physical activity
14. In
addition, we performed a comprehensive multi-modal assessment
of brain structure, including two PET scans and MRI for the
hallmarks of AD pathophysiology, as well as an extensive
neu-ropsychological investigation. Furthermore, sleep–wake history
was controlled prior to wake extension and exclusion criteria
ensured most risk factor favoring cognitive decline were not
pre-sent in the sample (e.g. diabetes, smoking, alcohol abuse,
depres-sion, etc.)
40. Finally, the relative young age of the participants
reduces the accumulation of minor health issues associated with
advanced age (e.g. diabetes, overweight, etc.), which can inherently
affect
findings in samples of elderly individuals. This research also
has several limitations, however. Its cross-sectional nature does not
allow us to comment on the future cognitive trajectory of
parti-cipants. The reported effect sizes show that CEP does explain but a
small part of variance, suggesting that its link with cognitive
fitness
is modest. This was expected given the numerous factors that affect
cognitive trajectories
40and the relatively young age and good
overall health status of our sample. It is, in fact, quite remarkable
that we were nonetheless able to isolate a link between
wake-dependent cortical excitability dynamics and cognition in such
sample, suggesting that it may be a very important link to
suc-cessful cognitive aging. While the contribution of the homeostatic
process is most obvious in our data, a longer protocol covering the
whole circadian cycle would help disentangle the respective
modulation of frontal CEP by the circadian system
14. In addition,
[18F]THK-5351 presents some unspecific binding, particularly
around the fornix and basal ganglia
41. We took this into account
by excluding these portions of the brain from all tau burden
measures. The observed links between
[18F]THK-5351 uptake and
both age and Aβ burden strongly support that our measure of tau
burden, although potentially imperfect, was meaningful. Finally,
we did not consider other age-related changes of brain integrity,
such as cerebrovascular pathology, which are extremely common
(up to 50%) as a mixed pathology in individuals with Alzheimer’s
dementia
42, and Lewy bodies pathology, which shares some
genetic risk with AD
43.
Aging is the ultimate challenge that the brain has to face in order
to maintain optimal cognition across the lifespan. The bidirectional
detrimental interaction between disturbed sleep–wake regulation
and AD pathogenesis suggest that sleep–wake interventions could
be promising means to reduce the risk of dementia
6. Here, we
provide compelling evidence that sleep–wake regulation influences
cognition in healthy older individuals, particularly in the executive
domain, and beyond the changes in brain structural integrity that
can ultimately lead to dementia. Since both sleep homeostasis and
circadian rhythmicity show significant alteration as early as age
40
13,15, our results further reinforces the idea that sleep and
wakefulness could be acted upon to improve individual cognitive
health trajectory early in the lifespan. Our
findings could have
therefore implications for the understanding of brain mechanisms
underlying the maintenance of cognitive health in normal and
pathological aging, and for potential early intervention targets.
Methods
Study design and participants. Between June 15, 2016, and July 28, 2018, healthy older individuals aged 50–70 years were enrolled for this multi-modal cross-sectional study after giving their written informed consent, and received afinancial compen-sation. This research was approved by the Ethics Committee of the Faculty of Medicine at the University of Liège, Belgium. Exclusion criteria were: clinical symptoms of cognitive impairment (Dementia rating scale < 130; Mini mental state examination < 27); Body Mass Index≤ 18 and ≥29; recent psychiatric history or severe brain trauma; addiction, chronic medication affecting the central nervous system; hypertension; smoking, excessive alcohol (>14 units/week) or caffeine (>5 cups/day) consumption; shift work in the past 6 months; transmeridian travel in the past 2 months; anxiety, as measured by the 21-item self-rated Beck Anxiety Inventory (score≥ 10); depression, as assessed by the 21-item self-rated Beck Depression Inventory (score≥ 14). Participants with stable treatment (for > 6 months) for hypertension and/or hypothyroidism were included in the study. Participants with
Table 2 Associations between CEP and cognitive composite
scores of global and domain-speci
fic performance adjusted
for age, sex, and education.
Global performance (Z-score) Memory (Z-score) Attentional (Z-score) Executive (Z-score) CEP F1,55= 6.76 F1,55= 0.41 F1,55= 2.44 F1,55= 8.47 p= 0.01 p= 0.52 p= 0.12 p= 0.005 R²β*= 0.11 R²β*= 0.13 Age F1,55= 6.97 F1,55= 3.76 F1,55= 5.79 F1,55= 2.68 p= 0.01 p= 0.06 p= 0.02 p= 0.11 R²β*= 0.11 R²β*= 0.10 Sex F1,55= 0.01 F1,55= 0.02 F1,55= 0.05 F1,55= 0.11 p= 0.90 p= 0.90 p= 0.83 p= 0.74 Education F1,55= 6.18 F1,55= 0.14 F1,55= 3.60 F1,55= 6.52 p= 0.02 p= 0.71 p= 0.06 p= 0.01 R²β*= 0.10 R²β*= 0.11Statistical outputs of generalized linear mixed models with cognitive scores as dependent
measures, accounting for their respective data distribution profiles. R²β*corresponds to
semi-partial R² in GLMMs
Table 3 Associations between CEP and cognitive composite scores of global and domain-speci
fic performance after accounting
for global and region-specific brain structural integrity markers.
Global performance (Z-score) Memory (Z-score) Attentional (Z-score) Executive (Z-score)
CEP F1,52= 7.49 F1,52= 0.39 F1,52= 2.71 F1,52= 9.71 p= 0.009 p= 0.54 p= 0.11 p= 0.003 R²β*= 0.13 R²β*= 0.16 Age F1,52= 7.48 F1,52= 5.51 F1,52= 5.22 F1,52= 3.16 p= 0.009 p= 0.02 p= 0.03 p= 0.08 R²β*= 0.13 R²β*= 0.10 R²β*= 0.09 Sex F1,52= 0.04 F1,52= 0.29 F1,52= 0.01 F1,52= 0.75 p= 0.84 p= 0.59 p= 0.95 p= 0.39 Education F1,52= 6.47 F1,52= 0.99 F1,52= 3.22 F1,52= 5.82 p= 0.01 p= 0.32 p= 0.08 p= 0.02 R²β*= 0.11 R²β*= 0.10 Region-specific GM volume F1,52= 0.11 F1,52= 3.54 F1,52= 0.04 F1,52= 0.10 p= 0.75 p= 0.07 p= 0.85 p= 0.75
Region-specific Aβ burden F1,52= 0.14 F1,52= 1.96 F1,52= 0.02 F1,52= 0.02
p= 0.71 p= 0.17 p= 0.88 p= 0.90
Region-specific Tau burden F1,52= 1.17 F1,52= 0.66 F1,52= 1.07 F1,52= 2.51
p= 0.28 p= 0.42 p= 0.31 p= 0.12
Statistical outputs of generalized linear mixed models with cognitive composite scores as dependent measures, accounting for their respective data distribution profiles. When considering global
cognitive performance, region-specific Aβ and tau burden as well as GM density refer to whole-brain values. R²β*corresponds to semi-partial R² in GLMMs.
Fig. 4 Relationships between CEP and cognition. a Positive association between CEP and global cognition (n= 60; F1,55= 6.76, p = 0.01, R²β*= 0.11). b Domain-specific positive association between CEP and performance to tasks probing executive functions (n = 60; F1,55= 8.47, p = 0.005, R²β*= 0.13). c No significant association between CEP and memory performance (n = 60; F1,55= 0.39, p = 0.54). d No significant association between CEP and attentional performance (n= 60; F1,55= 2.44, p = 0.12). Simple regressions were used only for a visual display and do not substitute the GLMM outputs. Dotted lines represent 95% confidence interval of these simple regressions.
sleep apnea (apnea-hypopnea index≥ 15/h) were excluded based on an in-lab adaptation and screening night of polysomnography. One participant was excluded from the sample for all analyses because of outlier values on both PET assessments (>6 standard deviations from the mean). Demographic characteristics of thefinal study sample are described in Table1.
Magnetic resonance imaging. High-resolution structural MRI was performed on a 3-T MR scanner (MAGNETOM Prisma, Siemens). For each participant, multi-parameter mapping volumes (i.e. T1-weighted, proton density-weighted, magne-tization transfer (MT)-weighted) were acquired. We estimated individuals’ total intracranial volume and whole-brain GM volume based on the MT-weighted image, using the SPM12 toolbox (https://www.fil.ion.ucl.ac.uk/spm/). For regional quantification of GM, volumes of interest were first determined using the Auto-mated Anatomical Labeling atlas (AAL2)44. MT-weighted images were spatially
normalized into a study-specific template with the Diffeomorphic Anatomical Registration Through Exponentiated Algebra (DARTEL) toolbox45. Volumes of
interest were then applied on segmented normalized MT-weighted images and combined to extract GM volume in brain regions underlying each cognitive domain (Supplementary Table 4).
PET imaging. Aβ-PET imaging was performed with[18F]Flutemetamol, and
tau-PET imaging was done with[18F]THK-5351. For both radiotracers, all participants
received a single dose of their respective radioligands in an antecubital vein (target dose 185 MBq). Aβ-PET image acquisitions started 85 min after injection, and four frames of 5 min were obtained, followed by a 10-min transmission scan. For tau-PET, transmission scan was acquiredfirst and dynamic image acquisitions started immediately after injection, consisting in 32 frames (with increasing time dura-tion). All PET images were reconstructed usingfiltered back-projection algorithm including corrections for measured attenuation, dead time, random events, and scatter using standard software (ECAT 7.1, Siemens/CTI, Knoxville, TN). Motion correction was performed using automated realignment of frames without resli-cing. A PET sum image was created using all frames for Aβ-PET, and using the four frames corresponding to the time window between 40 and 60 min for tau-PET. PET sum images were reoriented manually according to MT-weighted structural MRI volume and coregistered to structural MRI using the MT-weighted volume. PET sum images were further corrected for partial volume effect (PETPVC toolbox, iterative Yang method46) and spatially normalized using the MRI
study-specific template. SUVR was calculated using the cerebellum GM as the reference region. The volumes of interest used for GM analysis were applied to normalized PET sum images to estimate regional SUVR of each radiotracer in cognitive domain-specific regions.[18F]THK-5351 radiotracer shows some unspecificity for
tau, particularly over the basal ganglia, which was taken into account by excluding basal ganglia from all computations of PET SUVR values for tau-PET. Cognitive assessment. Upon arrival for the wake-extension protocol and prior to being placed in dim-light (~7.5 h before habitual bedtime, corresponding to ~3:30PM for a representative subject with bedtime at 11:00PM), participants were administered thefirst part (~1 h) of the extensive neuropsychological assessment including: (1) Mnemonic Similarity Task; (2) Category Verbal Fluency (letter and animals); (3) Digit Symbol Substitution Test; (4) Visual N-Back (1−, 2−*, and 3-back variants); and (5) Choice Reaction Time. On another day while well-rested and during the day (from 12 to 6 h before habitual bedtime, i.e. between 11:00AM and 5:00PM for the same representative subject), the second part of the neu-ropsychological assessment was administered. This ~1.5 h session included: (1) Direct and Inverse Digit Span; (2) Free and Cued Selective Reminding Test; (3) Stroop Test; (4) Trail Making Test (part A and B); and (5) D2 Attention Test. The memory function composite score included Free and Cued Selective Reminding Test (sum of all free recalls) and Mnemonic Similarity Task (recognition memory score). The executive function composite score comprised verbalfluency tests (2-min score for letter and animal variants), the digit span (inverse order), Trail Making Test (part B), N-Back (3-back variant), and Stroop (number of errors for interfering items). The attentional function composite score included Digit Symbol Substitution Test (2-min score), Trail Making Test (part A), N-Back (1-back variant), D2 (Gz - F score), and Choice Reaction Time (reaction time to dissimilar items). We computed a composite score for each cognitive domain based on the sum of Z-scores on domain-related tasks, with higher scores reflecting better performance. Composite score for global cognitive performance score consisted of the standardized sum of the domain-specific composite scores.
Sleep assessment and spectral power analysis. As part of the screening process, participantsfirst performed an in-lab adaptation and screening night to minimize the disrupting effect caused by sleeping in a novel environment47, which might
have otherwise affected the sleep parameters subsequently assessed during the baseline night. Then, for 7 days prior to the wake-extension protocol, participants followed a regular sleep–wake schedule (±30 min), in agreement with their pre-ferred bed and wake-up times. Compliance was verified using sleep diaries and wrist actigraphy (Actiwatch©, Cambridge Neurotechnology, UK). Aside from the
fixed sleep–wake schedule, participants were also instructed to abstain from intense physical exercise for the last 3 days offixed-schedule circadian entrainment (i.e.
right before the wake-extension protocol; exercise/fitness levels were not controlled for more specifically). The day before the wake-extension protocol, participants arrived to the laboratory 8 h before their habitual bedtime and were kept in dim light (<5 lux) for 6.5 h preceding bedtime. Their habitual sleep was then recorded in complete darkness under EEG (baseline night, Fig.1a). Baseline night data were acquired using N7000 amplifiers (EMBLA, Natus Medical Incorporated, Planegg, Germany). The electrode montage consisted of 11 EEG channels (F3, Fz, F4, C3, Cz, C4, P3, Pz, P4, O1, O2), two bipolar electrooculograms, and two bipolar electromyograms. Scoring of baseline night in 30-s epochs was performed auto-matically using a validated algorithm (ASEEGA, PHYSIP, Paris, France)48. An
automatic artifact detection algorithm with adapting thresholds49was further
applied on scored data. Power spectrum was computed for each channel using a Fourier transform on successive 4-s bins, overlapping by 2-s., resulting in a 0.25 Hz frequency resolution. The night was divided into 30 min periods, from sleep onset until lights on. For each 30 min period, SWE was computed as the sum of gen-erated power in the delta band, both for the lower range (0.75–1 Hz) and higher range (1.25–4 Hz), during all the NREM 2 and NREM 3 epochs of the given period, after adjusting for the number of NREM 2 and 3 epochs to account for artefacted data. As the frontal regions are most sensitive to sleep–wake history13, SWE was
considered over the frontal electrodes (F3, Fz, F4).
Wake-extension protocol. The wake-extension protocol followed the baseline night and consisted of 20 h of continuous wakefulness under strictly controlled constant routine conditions, i.e. in-bed semi-recumbent position (except for scheduled bathroom visits), dim light <5 lux, temperature ~19 °C, regular isocaloric food intake, no time-of-day information, and sound-proofed rooms. The protocol schedule was adapted to individual sleep–wake time, and lasted up to the theo-retical mid-sleep time (e.g. ca. 07:00 AM-03:00 AM) to create a moderate wake-fulness extension challenge. Hourly saliva samples were collected for subsequent melatonin assays, allowing a posteriori data realignment and interpolation based on individual endogenous circadian timing. Importantly, participants were not informed about the schedule of the different events included in the wake-extension protocol (e.g. number and timing of scheduled TMS-EEG sessions, saliva samples collections, food intakes, etc.), nor about the exact duration of the protocol in order to avoid motivational/expectancy biases which might interfere with the wake-dependent effects on our measurements50. They were told during recruitment that
the wake-extension protocol lasted for around 20 h, until the middle of the night. Cortical excitability over the frontal cortex was measured 5 times throughout the protocol, using TMS-EEG, with increased frequency around the circadian wake-maintenance zone, as it represents a critical period around which the interplay between sleep homeostasis and the circadian system show important changes. Participants were instructed that that the protocol included a few TMS-EEG ses-sion but were not informed about the exact number.
TMS-EEG assessment. One TMS-EEG session was performed prior to the wake-extension protocol to determine optimal stimulation parameters (i.e. location, orientation, and intensity) that allowed for EEG recordings free of muscular and magnetic artifacts. As in previous experiments16,24,25, the target location was in the
superior frontal gyrus. For all TMS-EEG recordings, pulses were generated by a Focal Bipulse 8-Coil (Nexstim, Helsinki, Finland). Interstimulus intervals were randomized between 1900 and 2200 ms. TMS-evoked responses were recorded with a 60-channel TMS-compatible EEG amplifier (Eximia, Helsinki, Finland), equipped with a proprietary sample-and-hold circuit which provides TMS artifact free data from 5 ms post stimulation. Electrooculogram was recorded with two additional bipolar electrodes. EEG signal was band-passfiltered between 0.1 and 500 Hz and sampled at 1450 Hz. Before each recording session, electrodes impe-dance was set below 5 kΩ. Each TMS-EEG session included ~250 trials (mean = 252 ± 15). Auditory EEG potentials evoked by the TMS clicks and bone con-ductance were minimized by diffusing a continuous white noise through earphones and applying a thin foam layer between the EEG cap and the TMS coil. A sham session, consisting in 30 TMS pulses delivered parallel to the scalp with noise masking, was administered to verify the absence of auditory EEG potentials. TMS-EEG data were preprocessed as previously described16in SPM12 implemented in
MATLAB2013a (The Mathworks Inc., Natick, MA). In brief, TMS-EEG data underwent semi-automatic artifacts rejection, low-passfiltering at 80 Hz, down-sampling to 1000 Hz, high-passfiltering at 1 Hz, splitting into epochs spanning −101 and 300 ms around TMS pulses, baseline correcting (from −101 to −1 ms pre-TMS), and robust averaging. Cortical excitability was computed as the slope at the inflexion point of the first component of the TMS-evoked EEG potential on the electrode closest to the stimulation hotspot. For each participant, CEP value was defined as the regression coefficient of a linear fit (first order polyfit MATLAB function) across the 5 TMS-EEG measurements at the individual level. Melatonin assessment. Salivary melatonin was measured by radioimmunoassay. The detection limit of the assay for melatonin was 0.8 ± 0.2 pg/l using 500 μl volumes. Dim-light melatonin onset times were computed for each participant using the hockey-stick method, with ascending level set to 2.3 pg/ml (Hockey-Stick software v1.5)51. The circadian phase of all TMS-EEG data points was estimated
relative to individual dim-light melatonin onset time (i.e. phase 0°; 15°= 1 h).
Based on this, cortical excitability measures were resampled following linear interpolation at the theoretical phases of the TMS-EEG sessions of the protocol (−145°, −60°, 0°, 30°, 80°).
Statistics and reproducibility. Statistical analyses were performed using GLMMs in SAS 9.4 (SAS Institute, Cary, NC). Dependent variables distribution wasfirst determined using allfitdist function in MATLAB and GLMMs were adjusted accordingly. All statistical models were adjusted for age, sex and education. Sta-tistical significance was set at p < 0.05. Simple regressions were used for visual display only and not as a substitute of the full GLMM statistics. Degrees of freedom were estimated using Kenward-Roger’s correction. P-values in post-hoc contrasts (difference of least square means) were adjusted for multiple testing with Tukey’s procedure. Semi-partial R² (R²β*) values were computed to estimate effect size of significant fixed effects in all GLMMs52.
Reporting summary. Further information on research design is available in the Nature Research Reporting Summary linked to this article.
Code availability
The authors declare that the codes used for data processing and/or statistical analyses are available from the corresponding author upon request.
Data availability
The authors declare that the data supporting thefindings of this study are available from the corresponding author upon request.
Received: 11 June 2019; Accepted: 6 November 2019;
References
1. Giorgio, A. et al. Age-related changes in grey and white matter structure throughout adulthood. Neuroimage 51, 943–951 (2010).
2. Jack, C. R. et al. Tracking pathophysiological processes in Alzheimer’s disease: an updated hypothetical model of dynamic biomarkers. Lancet Neurol. 12, 207–216 (2013).
3. Reuter-Lorenz, P. A. & Park, D. C. How does it STAC up? revisiting the scaffolding theory of aging and cognition. Neuropsychol. Rev. 24, 355–370 (2014).
4. Jack, C. R. et al. NIA-AA research framework: toward a biological definition of Alzheimer’s disease. Alzheimer’s Dement. 14, 535–562 (2018).
5. Braak, H., Thal, D. R., Ghebremedhin, E. & Tredici, K. Del Stages of the pathologic process in Alzheimer disease: age categories from 1 to 100 years. J. Neuropathol. Exp. Neurol. 70, 960–969 (2011).
6. Van Egroo, M. et al. Sleep–wake regulation and the hallmarks of the pathogenesis of Alzheimer’s disease. Sleep zsz017, 42, (2019). 7. Van Someren, E. J. W. et al. Medial temporal lobe atrophy relates more
strongly to sleep-wake rhythm fragmentation than to age or any other known risk. Neurobiol. Learn. Mem. 160, 132–138 (2019).
8. Dubé, J. et al. Cortical thinning explains changes in sleep slow waves during adulthood. J. Neurosci. 35, 7795–7807 (2015).
9. Sexton, C. E., Storsve, A. B., Walhovd, K. B., Johansen-Berg, H. & Fjell, A. M. Poor sleep quality is associated with increased cortical atrophy in community-dwelling adults. Neurology 83, 967–973 (2014).
10. Lucey, B. P. et al. Reduced non–rapid eye movement sleep is associated with tau pathology in early Alzheimer’s disease. Sci. Transl. Med. 11, eaau6550 (2019).
11. Mander, B. A. et al.β-amyloid disrupts human NREM slow waves and related hippocampus-dependent memory consolidation. Nat. Neurosci. 18, 1051–1057 (2015).
12. Musiek, E. S. et al. Circadian rest-activity pattern changes in aging and preclinical Alzheimer disease. JAMA Neurol. 75, 582–590 (2018). 13. Schmidt, C., Peigneux, P. & Cajochen, C. Age-related changes in sleep and
circadian rhythms: Impact on cognitive performance and underlying neuroanatomical networks. Front. Neurol. 3, 118 (2012).
14. Duffy, J. F. & Dijk, D. J. Getting through to circadian oscillators: why use constant routines? J. Biol. Rhythms 17, 4–13 (2002).
15. Carrier, J. et al. Sleep slow wave changes during the middle years of life. Eur. J. Neurosci. 33, 758–766 (2011).
16. Gaggioni, G. et al. Age-related decrease in cortical excitability circadian variations during sleep loss and its links with cognition. Neurobiol. Aging 78, 52–63 (2019).
17. Rizzo, V., Richman, J. & Puthanveettil, S. V. Dissecting mechanisms of brain aging by studying the intrinsic excitability of neurons. Front. Aging Neurosci. 7, 1–9 (2015).
18. Oh, M. M., Oliveira, F. A. & Disterhoft, J. F. Learning and aging related changes in intrinsic neuronal excitability. Front. Aging Neurosci. 2, 1–10 (2010). 19. Yaffe, K., Falvey, C. M. & Hoang, T. Connections between sleep and cognition
in older adults. Lancet Neurol. 13, 1017–1028 (2014).
20. Oosterman, J. M., Van Someren, E. J. W., Vogels, R. L. C., Van Harten, B. & Scherder, E. J. A. Fragmentation of the rest-activity rhythm correlates with age-related cognitive deficits. J. Sleep. Res. 18, 129–135 (2009).
21. Lim, A. S. P., Kowgier, M., Yu, L., Buchman, A. S. & Bennett, D. A. Sleep fragmentation and the risk of incident Alzheimer’s disease and cognitive decline in older persons. Sleep 36, 1027–1032 (2013).
22. Bubu, O. M. et al. Sleep, cognitive impairment and Alzheimer’s disease: a systematic review and meta-analysis. Sleep 40, 1–18 (2016).
23. Shi, L. et al. Sleep disturbances increase the risk of dementia: a systematic review and meta-analysis. Sleep. Med. Rev. 40, 4–16 (2018).
24. Huber, R. et al. Human cortical excitability increases with time awake. Cereb. Cortex 23, 332–338 (2013).
25. Ly, J. Q. M. et al. Circadian regulation of human cortical excitability. Nat. Commun. 7, 11828 (2016).
26. Skorucak, J., Arbon, E. L., Dijk, D.-J. & Achermann, P. Response to chronic sleep restriction, extension, and subsequent total sleep deprivation in humans: adaptation or preserved sleep homeostasis? Sleep 41, 1–17 (2018). 27. Saletin, J. M., van der Helm, E. & Walker, M. P. Structural brain correlates of
human sleep oscillations. Neuroimage 83, 658–668 (2013).
28. Jurado, M. B. & Rosselli, M. The elusive nature of executive functions: a review of our current understanding. Neuropsychol. Rev. 17, 213–233 (2007). 29. Niendam, T. A. et al. Meta-analytic evidence for a superordinate cognitive
control network subserving diverse executive functions. Cogn. Affect. Behav. Neurosci. 12, 241–268 (2012).
30. Podell, J. E. et al. Neurophysiological correlates of age-related changes in working memory updating. Neuroimage 62, 2151–2160 (2012).
31. Gorbach, T. et al. Longitudinal association between hippocampus atrophy and episodic-memory decline. Neurobiol. Aging 51, 167–176 (2016).
32. Stern, Y. Cognitive reserve in ageing and Alzheimer’s disease. Lancet Neurol. 11, 1006–1012 (2012).
33. Masters, C. L. & Selkoe, D. J. Biochemistry of amyloid ß-Protein and amyloid deposits in Alzheimer disease. Cold Spring Harb. Perspect. Med. 2, a006262 (2012).
34. Kopeikina, K., Hyman, B. & Spires-Jones, T. Soluble forms of tau are toxic in Alzheimer’s disease. Transl. Neurosci. 3, 223–233 (2012).
35. Meyer, P. T. et al. Effect of aging on cerebral A1adenosine receptors: A [18F] CPFPX PET study in humans. Neurobiol. Aging 28, 1914–1924 (2007). 36. Scammell, T. E., Arrigoni, E. & Lipton, J. O. Neural circuitry of wakefulness
and sleep. Neuron 93, 747–765 (2017).
37. Chellappa, S. L. et al. Circadian dynamics in measures of cortical excitation and inhibition balance. Sci. Rep. 6, 1–13 (2016).
38. Wang, J. L. et al. Suprachiasmatic neuron numbers and rest-activity circadian rhythms in older humans. Ann. Neurol. 78, 317–322 (2015).
39. Farajnia, S., Deboer, T., Rohling, J. H. T., Meijer, J. H. & Michel, S. Aging of the suprachiasmatic clock. Neuroscientist 20, 44–55 (2014).
40. Norton, S., Matthews, F. E., Barnes, D. E., Yaffe, K. & Brayne, C. Potential for primary prevention of Alzheimer’s disease: an analysis of population-based data. Lancet Neurol. 13, 788–794 (2014).
41. Villemagne, V. L., Doré, V., Burnham, S. C., Masters, C. L. & Rowe, C. C. Imaging tau and amyloid-β proteinopathies in Alzheimer disease and other conditions. Nat. Rev. Neurol. 14, 225–236 (2018).
42. Alzheimer’s Association. Alzheimer’s disease facts and figures. Alzheimer’s Dement. 12, 459–509 (2016).
43. Guerreiro, R. et al. Genome-wide analysis of genetic correlation in dementia with Lewy bodies. Parkinson’s Alzheimer’s Dis. 38, 10–13 (2016).
44. Tzourio-Mazoyer, N. et al. Automated anatomical labeling of activations in SPM using a macroscopic anatomical parcellation of the MNI MRI single-subject brain. Neuroimage 15, 273–289 (2002).
45. Ashburner, J. A fast diffeomorphic image registration algorithm. Neuroimage 38, 95–113 (2007).
46. Thomas, B. A. et al. PETPVC: A toolbox for performing partial volume correction techniques in positron emission tomography. Phys. Med. Biol. 61, 7975–7993 (2016).
47. Tamaki, M., Bang, J. W., Watanabe, T. & Sasaki, Y. Night watch in one brain hemisphere during sleep associated with thefirst-night effect in humans. Curr. Biol. 26, 1190–1194 (2016).
48. Berthomier, C. et al. Automatic analysis of single-channel sleep EEG: validation in healthy individuals. Sleep 30, 1587–1595 (2007).
49. Coppieters’t Wallant, D. et al. Automatic artifacts and arousals detection in whole-night sleep EEG recordings. J. Neurosci. Methods 258, 124–133 (2016).
50. Hull, J. T., Wright, K. P. & Czeisler, C. A. The influence of subjective alertness and motivation on human performance independent of circadian and homeostatic regulation. J. Biol. Rhythms 18, 329–338 (2003).
51. Danilenko, K. V., Verevkin, E. G., Antyufeev, V. S., Wirz-Justice, A. & Cajochen, C. The hockey-stick method to estimate evening dim light melatonin onset (DLMO) in humans. Chronobiol. Int. 31, 349–355 (2014). 52. Jaeger, B. C., Edwards, L. J., Das, K. & Sen, P. K. An R 2 statistic forfixed effects in the generalized linear mixed model. J. Appl. Stat. 44, 1086–1105 (2017).
53. Beck, A. T., Epstein, N., Brown, G. & Steer, R. A. An inventory for measuring clinical anxiety: Psychometric properties. J. Consult. Clin. Psychol. 56, 893–897 (1988).
54. Beck, A. T., Steer, R. A. & Garbin, G. M. Psychometric properties of the Beck depression inventory: twenty-five years of evaluation. Clin. Psychol. Rev. 8, 77–100 (1988).
55. Buysse, D. J. et al. The Pittsburgh Sleep Quality Index: a new instrument for psychiatric practice and research. Psychiatry Res. 28, 193–213 (1989). 56. Johns, M. W. Daytime sleepiness, snoring, and obstructive sleep apnea: The
Epworth Sleepiness Scale. Chest 103, 30–36 (1993).
57. Horne, J. A. & Ostberg, O. A self-assessment questionnaire to determine morningness-eveningness in human circadian rhythms. Int. J. Chronobiol. 4, 97–110 (1976).
Acknowledgements
The authors thank M. Blanpain, M. Cerasuolo, E. Lambot, C. Hagelstein, S. Laloux, E. Balteau, A. Claes, C. Degueldre, B. Herbillon, P. Hawotte, and B. Lauricella for their help in different steps of the study. M.V.E., P.G., C.S., C.P., C.B., F.C., G.V. are supported by the FNRS-Belgium. G.G. was supported by Wallonia Brussels International (WBI) and Fondation Léon Fredericq (FLF). The study was supported by Fonds National de la Recherche Scientifique (FRS-FNRS, F.4513.17, T.0242.19, and 3.4516.11, Belgium), Actions de Recherche Concertées (ARC SLEEPDEM 17/27-09) of the Fédération Wal-lonie-Bruxelles, University of Liège (ULiège), Fondation Simone et Pierre Clerdent, European Regional Development Fund (ERDF, Radiomed Project).[18F]Flutemetamol
doses were provided and cost covered by GE Healthcare Ltd (Little Chalfont, UK) as part of an investigator sponsored study (ISS290) agreement. This agreement had no influence on the protocol and results of the study reported here.
Author contributions
E.S., P.M., C.P., C.B., F.C., and G.V. designed the experiment. M.V.E., J.N., D.C., P.V.G., P.G., V.M., C.S., G.G., G.B., X.P., E.T., D.M., C.L.G., E.C., A.L., E.S., P.M., M.A.B., C.P.,
C.B., F.C., and G.V. helped in data acquisition, analysis, and interpretation. E.S., A.L., P.M., and C.P. provided administrative, technical, or material support. M.V.E,, D.C., and G.V. wrote the manuscript. M.V.E., J.N., D.C., P.V.G., P.G., V.M., C.S., G.G., G.B., X.P., E.T., D.M., C.L.G., E.C., A.L., E.S., P.M., M.A.B., C.P., C.B., F.C., and G.V. contributed to manuscript revising.
Competing interests
The authors declare no competing interests.
Additional information
Supplementary informationis available for this paper at https://doi.org/10.1038/s42003-019-0693-y.
Correspondenceand requests for materials should be addressed to G.V.
Reprints and permission informationis available athttp://www.nature.com/reprints
Publisher’s note Springer Nature remains neutral with regard to jurisdictional claims in published maps and institutional affiliations.
Open Access This article is licensed under a Creative Commons Attribution 4.0 International License, which permits use, sharing, adaptation, distribution and reproduction in any medium or format, as long as you give appropriate credit to the original author(s) and the source, provide a link to the Creative Commons license, and indicate if changes were made. The images or other third party material in this article are included in the article’s Creative Commons license, unless indicated otherwise in a credit line to the material. If material is not included in the article’s Creative Commons license and your intended use is not permitted by statutory regulation or exceeds the permitted use, you will need to obtain permission directly from the copyright holder. To view a copy of this license, visithttp://creativecommons.org/ licenses/by/4.0/.
© The Author(s) 2019