The effect of concentrate allocation on traf
fic and milk production
of pasture-based cows milked by an automatic milking system
F. Lessire
1†, E. Froidmont
2, J. Shortall
3, J. L. Hornick
1and I. Dufrasne
11Fundamental and Applied Research on Animal and Health, Animal Production Department, Faculty of Veterinary Medicine, University of Liège, Quartier Vallée 2
avenue de Cureghem, 10, 4000 Liège 1, Belgium;2Production and Sectors Department, Walloon Agricultural Research Centre, rue de Liroux, 8, 5030 Gembloux,
Belgium;3Teagasc, Animal & Grassland Research and Innovation Centre, Moorepark, Fermoy, Co. Cork, Ireland
(Received 23 February 2016; Accepted 2 March 2017)
Increased economic, societal and environmental challenges facing agriculture are leading to a greater focus on effective way to combine grazing and automatic milking systems (AMS). One of the fundamental aspects of robotic milking is cows’ traffic to the AMS. Numerous studies have identified feed provided, either as fresh grass or concentrate supplement, as the main incentive for cows to return to the robot. The aim of this study was to determine the effect of concentrate allocation on voluntary cow traffic from pasture to the robot during the grazing period, to highlight the interactions between grazed pasture and concentrate allocation in terms of substitution rate and the subsequent effect on average milk yield and composition. Thus, 29 grazing cows, milked by a mobile robot, were monitored for the grazing period (4 months). They were assigned to two groups: a low concentrate (LC) group (15 cows) and a high concentrate (HC) group (14 cows) receiving 2 and 4 kg concentrate/cow per day, respectively; two allocations per day of fresh pasture were provided at 0700 and 1600 h. The cows had to go through the AMS to receive the fresh pasture allocation. The effect of concentrate level on robot visitation was calculated by summing milkings, refusals and failed milkings/cow per day. The impact on average daily milk yield and composition was also determined. The interaction between lactation number and month was used as an indicator of pasture availability. Concentrate allocation increased significantly robot visitations in HC (3.60 ± 0.07 visitations/cow per day in HC and 3.10 ± 0.07 visitations/cow per day in LC;P< 0.001) while
milkings/cow per day were similar in both groups (LC: 2.37 ± 0.02/day and HC: 2.39 ± 0.02/day; Ns). The average daily milk yield over the grazing period was enhanced in HC (22.39 ± 0.22 kg/cow per day in HC and 21.33 ± 0.22 kg/cow per day in LC;
P< 0.001). However the gain in milk due to higher concentrate supply was limited with regards to the amount of provided
concentrates. Milking frequency in HC primiparous compared with LC was increased. In the context of this study, considering high concentrate levels as an incentive for robot visitation might be questioned, as it had no impact on milking frequency and limited impact on average milk yield and composition. By contrast, increased concentrate supply could be targeted specifically to primiparous cows.
Keywords: grazing, dairy cows, concentrate, automatic milking system, cow traffic
Implications
Cow traffic to the automatic milking systems (AMS) is crucial for the efficiency of the system, particularly in pasture-based systems. In this study, the effect of concentrate level on voluntary cow traffic was evaluated during the grazing period. The high concentrate (HC) group returned to the robot more frequently without increase in milking frequency. The average daily milk yield and composition were improved at high concentrate level but these effects were limited. Thus providing cows with higher amounts of concentrates might be debated regarding economic balance between improved
milk yield and composition and concentrate consumption. However it could be considered in primiparous as an efficient way to increase milkings and milk yield.
Introduction
Since they werefirst developed in the 1990s, AMS have been increasing in popularity. According to de Koning (2011), around 8000 farms in 25 countries worldwide are equipped with a robot. In parallel, the interest for combining robotic milking with grazing has increased (Lyons et al., 2013a; John et al., 2016). Grazing has several advantages with the most frequently cited ones including benefits for animal health (Burowet al., 2011) and for the environment
†E-mail:flessire@ulg.ac.be
(Peyraud and Delagarde, 2013) which are positively perceived by the consumers (De Oldeet al., 2016). Including grazed pasture in cows’ diet lowers milk production costs (Hongerholtet al., 1997; Dillonet al., 2005) in comparison with barn feeding, and increases the ratio of polyunsaturated fatty acids in cows’ milk (Stockdaleet al., 2003; Waleset al., 2009). Despite these advantages, combining grazing and AMS remains a challenge due to the lower milking frequency observed when cows are grazing (van Doorenet al., 2002; Spörndly and Wredle, 2005).
Thus, the use of an AMS with grazing implies the need to stimulate cows’ traffic to the robot. Gregarious behaviour and distance to the robot make the cows less motivated to go for milking, causing irregularity in milking intervals over the lactation with a negative effect on milk production (Ayadi et al., 2004; Delamaire and Guinard-Flament, 2006). Therefore, cow traffic is a fundamental aspect to be considered in the attempt to combine AMS and grazing (Lyons et al., 2013b; Scottet al., 2014). Varying factors which may improve cow traffic to the AMS have been described in the literature. One such incentive is feed, which can be provided by giving new pasture allocation (Lyons et al., 2013a), by offering more concentrates (Bachet al., 2007) or by modifying timing of feed allocation (Lyonset al., 2013b). Numerous studies have shown discrepancies regarding the effects of the level of concentrates given during milking on cow traffic: some of these find no effect on milking frequency (Bach et al., 2007; Jago et al., 2007) while in more recent studies (Lyonset al., 2013b) returns to the robot were improved by pre-milking concentrate supplementation. Effects of concentrates supplied during milking by the AMS have been studied indoors by Halachmi et al. (2005) and by Bachet al. (2007). They concluded that concentrate supplementation was not effective at attracting the cows to the robot. Studies conducted on grazing cows demonstrated that concentrate supplementation induces a substitution rate effect decreasing cow pasture intake and impacting efficient utilisation of grazed pasture (Peyraud and Delaby, 2001; Peyraud and Delagarde, 2013). For grazing dairy cows milked by an AMS, the dilemma between efficient utilisation of pasture and cow traffic to the robot, encouraged by concentrate supplementation, has to be considered. Thus, the aim of this study was to examine to what extent two different levels of concentrate supplementation impact traffic of grazing cows milked by an AMS in pasture during the grazing period in Belgium. The interaction between efficient utilisation of pasture and concentrate was considered as well as the effects on average milk yield and composition to provide a complete overview of the benefits linked to concentrate supplementation.
Material and methods
Animals and experimental design
The study was conducted from 1stMay to 31stAugust 2013 (4 months) at the Experimental Farm of Sart Tilman, University of Liège, Belgium (5.58°E, 50.42°N). During the study period, the experimental herd was composed on
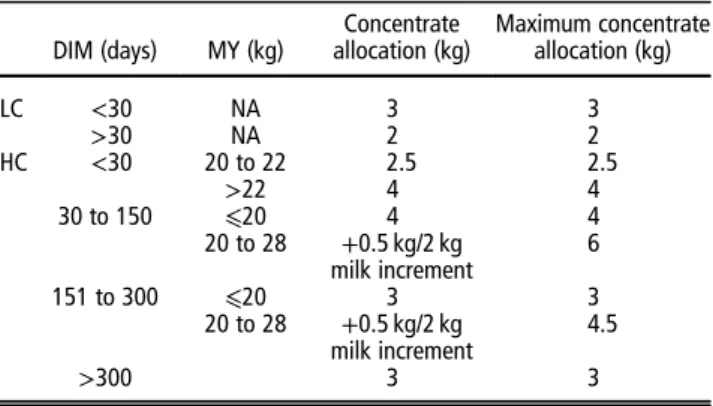
average of 45 cows (minimum: 40; maximum: 50). From these, only animals present from the beginning till the end of the grazing period were included in the study. The cows were randomly assigned to one of two groups receiving a different level of concentrate supplementation at the AMS. In total, 15 cows including seven primiparous, days in milk (DIM) 97 ± 63 days (SD), with an average lactation number (LN) 2.00 ± 1.25, were assigned in the low concentrate (LC) group. The HC group included 14 cows, of whichfive were primiparous (DIM = 94 ± 41 days; LN: 2.43 ± 1.91). From 1stMay to 31stAugust, cow’s diet was composed of grazed pastures and a variable amount of concentrate provided in the AMS during milking. The LC-group received on average 2.00 kg concentrate/d whereas the HC-group received on average 4.00 kg per day. Concentrate was supplied by Moulins Bodson (Villers l’Evêque, Belgium) and composed of 37% maize gluten, 11.5% dried beet pulps, 4% spelt, 10% barley, 24.5% wheat, 5% wheat distillers, 4% beet molasses and 4% soybean meal. It provided 170 g CP and 894 VEM/kg dry matter (DM) with VEM being the Dutch unit of net energy content for milk production (1000 VEM = 1650 kcal net energy for lactation). The amount given to each cow was computed in the robot following the schedule described in Table 1. Cows were allowed to visit the robot at any time but were milked only when a time interval of 4 h elapsed since the previous milking event.
The cows were milked by an AMS Lely A3next®(Maasluis, The Netherlands) placed on a trailer in order to be moved on pastures during the grazing period following the procedure described by Dufrasneet al. (2012). Once moved from the barn to pasture after the winter period, the trailer with the AMS stayed at the same location during the grazing period. Trans-pondersfixed on HR-tag neck collar (SCR, Netanya, Israel) were used in order to recognise the cows and to register several parameters: milk yield (kg/cow per day), number of milking per day (successful milking (SM)/d), number of failed milkings (robot failed to attach milking cluster (FM)/d), number of refusals (occurring if the delay between two visits is insuf fi-cient; RM/d), the amount of concentrate given (kg/cow per day), milk fat (F) and protein (P) content estimated auto-matically by IR analysis technology associated to the robot and
Table 1Description of the schedule of concentrate allocation in LC (low concentrate) and HC (high concentrate)
DIM (days) MY (kg) Concentrate allocation (kg) Maximum concentrate allocation (kg) LC <30 NA 3 3 >30 NA 2 2 HC <30 20 to 22 2.5 2.5 >22 4 4 30 to 150 ⩽20 4 4 20 to 28 +0.5 kg/2 kg milk increment 6 151 to 300 ⩽20 3 3 20 to 28 +0.5 kg/2 kg milk increment 4.5 >300 3 3
time of the day of milking visits. Milk yield was calculated by adding milk produced at every milking over a 24-h period (0000 to 2400 h). Milk response (MR) was calculated by dividing the extra-milk produced by HC compared with LC by the difference of kg of concentrate received by HC compared with LC. Robot visitations were calculated by summing SM, FM and RM.
Grazing management
In total, 24 ha of pasture, composed mainly of perennial rye-grass (Lolium perenne) and white clover (Trifolium repens), were divided into 15 paddocks ranging from 0.6 to 3.1 ha in size, with a maximum distance for cows to walk to the robot of 700 m, assuming that this distance has no influence on milking frequency and milk yield (Spörndly and Wredle, 2005; Dufrasne et al., 2012). All animals grazed as one herd without any physical separation. Cows were assigned in different paddocks for day and night. Change from day to night paddock was managed when cows exited the AMS, as they were directed by selection gates to their new allocation. The day and night paddock changes took place at 0700 and 1600 h. The targeted pasture intake was set at 17 kg DM/cow per day based on pasture production of previous grazing periods. This objective was reached by strip-grazing. Grass height was measured by an electronic rising plate meter (Jenquip®, Feilding, New Zealand) before the cows entering and after cows exiting the pasture to estimate average pasture consumed. Pasture cover was estimated by mowing a grass band 10 m long and 0.38 m width. The mowed sample was weighed, then oven dried (65°C during 72 h) to determine the DM content. The kg DM collected on the mowed area wasfirstly expressed by ha of grazed parcel and then multiplied by the parcel area. Thisfigure was then divided by the stocking rate at that time and by the days the cows stayed on. Pasture samples hand collected randomly on the pastures were oven dried (65°C for 72 h) and analysed by NIRS for composition prediction (CP, NDF, ADF, lignin, water-soluble carbohydrates (WSC), Ash) in order to determine the nutritional value according to the Dutch feeding system as described by De Boever (De Boeveret al., 2004).
Statistical analyses
The statistical analyses were performed using SAS (SAS Institute Inc., Cary, NC, USA). The data were analysed according to the PROC MIXED procedure with repeated measures and covariance analysis type autoregressive AR(1).
Yijk= μ + Gri+ Mj+ Nk+ Gri´ Mj+ Gri´ Nk+ eijk
whereµis the overall mean,Grithe group effect (i= LC to HC),
Mj the month effect (j= May to August), Nk the lactation
number effect (k= 1 to 2, 1 = primiparous and 2 multiparous), interactionsGri×Mj, Gri×Nkandeijkthe residual error ~N(0;σ²).
Yijk was tested for milk yield (MY; kg/cow per day),
F (% and kg/cow per day), P (% and kg/cow per day), milk solids (kg) calculated by summing F and P (kg/day), milk production/ milking (MM; kg), milking interval (MI; h), supplied concentrate (kg/cow per day).
The PROC MIXED procedure, with repeated values and covariance analysis type were used for statistical analysis of pasture nutritional values with the following model
Yij= μ + Mi+ eij
whereµis the overall mean,Mithe month effect (i = 1 to 4)
andeithe residual error ~N(0;σ²).
Milking and refusal time pattern was determined by the procedure PROC FREQ andχ2test and relative risk (RR) were assessed. Relative risk was calculated in two steps. First, the number of event (e.g. SM or RM) for a determined group (e.g. LC or HC; primiparous or multiparous) is calculated and divided by the total number of subjects in this group (R1). The same calculation is made in the second group (R2). Relative risk is equal to R1 divided by R2.
All the edited values are least squares means ± pooled standard error, excluding pasture height (means ± SD).
Results Grazing
Animals grazed for 4.6 ± 1.5 days on each paddock (minimum= 1 day and maximum = 12 days). Mean pre and post-grazing heights above ground were 11.4 ± 4.4 cm and 6.1 ± 2.1 cm, respectively. Pre-grazing pasture cover were at 2310, 917, 1587 and 1730 kg DM/ha in May, June, July and August, respectively. The grazing period in 2013 was unusual regarding weather conditions, with abundant rainfall levels in May (90.7 mm compared with 1991–2010 reference values of 66.5 mm) observed. In July and August, recorded temperatures in the Meteorological Station in Sart Tilman were higher than reference values of the last 30 years (July: 21.2°C, reference value: 16.5°C, August: 18.4°C, reference value: 16.0°C). During July and August, drought appeared with rainfalls 30% and 55% lower than those recorded during summers from 1991 to 2010, respectively. In June, due to poor climatic conditions, regrowth of grass was limited in some grazing paddocks.
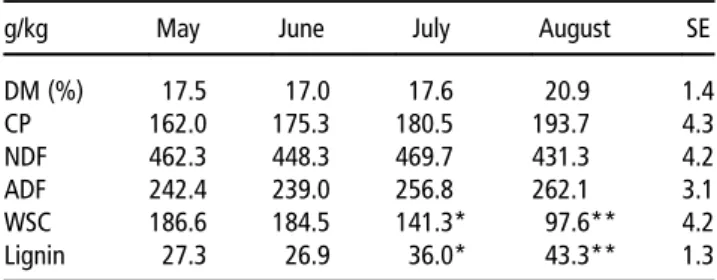
Pasture nutritional values are reported in Table 2. All values kept constant over the grazing period excepted lignin and WSC. Water soluble carbohydrates dropped from 186.6 g/kg DM in May to 141.3 (P< 0.05) and 97.6 g/kg DM (P< 0.001) in July and August, respectively. By contrast, lignin content increased from 27.3 g/kg DM in May to 36.0 (P< 0.05) and 43.3 g/kg DM (P< 0.001), in July and August, respectively.
Table 2Nutritional values of pasture from May to August
g/kg May June July August SE
DM (%) 17.5 17.0 17.6 20.9 1.4 CP 162.0 175.3 180.5 193.7 4.3 NDF 462.3 448.3 469.7 431.3 4.2 ADF 242.4 239.0 256.8 262.1 3.1 WSC 186.6 184.5 141.3* 97.6** 4.2 Lignin 27.3 26.9 36.0* 43.3** 1.3
SE= pooled standard error; DM = dry matter; WSC = water soluble carbo-hydrates.
Concentrates supplementation
Cows received a daily average 4.14 ± 0.03 kg of concentrates in HC and 2.14 ± 0.03 kg in LC (Table 3). The supplied amount decreased from 2.30 kg in May to 2.00 kg in August for LC (difference= 0.30 kg). This decline was more pronounced in HC (4.56 kg in May to 3.70 kg in August) with a difference between the amount given in May and August reaching 0.86 kg. The amount of concentrates was similar in both age classes (2.17, 2.10 kg in multiparous and primiparous, respectively) for LC, whereas in HC, multiparous received on average 0.59 kg/day more than primiparous.
Voluntary cow traffic to the robot
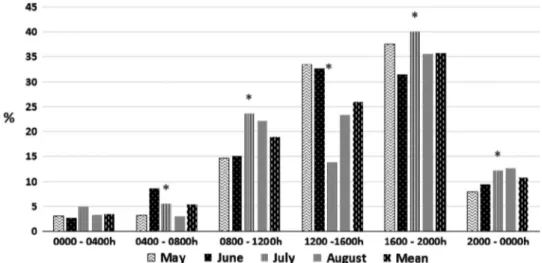
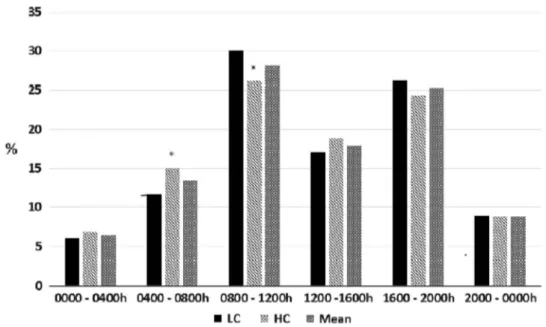
Milking frequency was similar in both groups (2.38 ± 0.02/day) whereas RM were more numerous in HC (1.05 ± 0.04/day in HC and 0.70 ± 0.04/day in LC,P< 0.01) inducing higher robot visitation in HC (3.6 ± 0.07/day in HCv. 3.1 ± 0.07/day in LC). The highest rate of RM due to visits separated by a delay<4 h was observed in June, the period of restricted grass. Month affected the time distribution of SM and RM (Figures 1 and 2). On the contrary, group had no effect on these parameters (Figure 3). A significant increase of the frequency of SM was recorded in LC from 0800 to 1200 h and from 1600 to 2000 h compared with HC. Over the day, SM and RM were not evenly distributed. In total, 53% of SM were observed from 0800 to 1200 h and from 1600 to 2000 h. That corresponds to a range of time between 1 and 3 h around the change of pastures allowed by the selection gates. From 1600 to 2000 h, cow traffic was the most intense with 25% of SM and 36% of RM observed at that time. On the contrary, only 15% of total SM and 14% of RM occurred from 2000 to 0400 h. From 0000 to
1200 h, the probability of SM increased whereas RM were less numerous. From 1600 to 2000 h, the proportion of RM became greater than that of SM. Over the grazing period, distribution pattern of robot visitations was influenced by the month: in July and August, less SM and RM were observed from 1200h till 1600 h while more robot visitations were recorded from 0400 to 0800 h and from 1600 to 2000 h.
Refusals occurred more frequently in primiparous compared with multiparous (1.00 ± 0.05/day to 0.75 ± 0.04/day for multiparous;P< 0.001; Table 4). However, in primiparous, RM number was different from one group to the other with a higher percentage of RM observed in HC-group: 63% of the total of RM were recorded in HC primiparous. The difference in behaviour observed in primiparous following concentrate allocation tended to alleviate from May to August and the RR of RM for LC to HC primiparous increased from 0.59 to 0.89 in August. Multiparous cows from the LC-group were more likely refused when coming back to the robot but the RR of LC/HC multiparous RM dropped over the grazing period from 1.42 in May to 1.12 in August. In June, the amount of recorded RM was the highest for all the groups (primiparous HC and LC, multiparous HC and LC). Odds ratio analysis demonstrated that milking time distribution was the same in both groups, except from 0400 to 0800 h when multiparous came back more often while from 1200 to 1600 h, more SM were performed on primiparous.
Milk production and composition
Milk yield decreased over the grazing period in both groups (Table 3). Milk production declined linearly in both groups following a parallel evolution. In May, MY of both groups was
Table 3Effect of month (5 to 8 for May to August) and of concentrate allowance (low concentrate (LC); high concentrate (HC)) on milk yield and composition, visitations, milkings, refusals to the robot of grazing cows milked by an automatic milking system
LC HC Statistical significance
Month 5 6 7 8 SE 5 6 7 8 SE tr Month tr× month
Concentrate (kg/day) 2.30Xa 2.13Xb 2.11Xb 2.00Xb 0.06 4.56a 4.33b 3.98c 3.70d 0.06 *** *** ***
Yield (kg/cow per day)
MY 26.37a 21.20Xb 20.41Xb 17.32Xc 0.46 26.05a 23.11b 21.62c 18.78d 0.47 ** *** Ns MM 10.61a 8.45Xb 8.96c 6.96d 0.16 10.81a 8.85b 9.09b 6.99c 0.16 * *** Ns F 1.00a 0.81Xb 0.75Xc 0.64Xd 0.02 1.03a 0.90b 0.81c 0.71d 0.02 *** *** Ns P 0.84a 0.67Xb 0.68Xb 0.58Xc 0.02 0.85a 0.74b 0.72b 0.63c 0.02 *** *** Ns Milk solids 1.85a 1.48Xb 1.43Xb 1.23Xc 0.04 1.88a 1.63b 1.54c 1.34d 0.04 *** *** Ns Composition F% 3.82a 3.79a 3.77a 3.77a 0.06 3.87a 3.86a 3.85a 3.85a 0.06 Ns Ns Ns P% 3.28a 3.26a 3.31a 3.28a 0.06 3.30a 3.30a 3.35b 3.32a 0.06 Ns *** Ns
Traffic ( per day)
Milkings 2.42a 2.42a 2.24b 2.39a 0.06 2.39a 2.48a 2.29a 2.41a 0.07 Ns *** Ns
Refusals 0.64a 0.91Xb 0.52Xa 0.73Xa 0.11 0.73a 1.26b 1.02c 1.21b 0.12 *** *** Ns Visitations 3.11a 3.33Xa 2.77Xb 3.18Xa 0.16 3.23a 3.82b 3.44a 3.91b 0.17 *** *** Ns
MI (h) 9.65a 9.54Xa 10.30Xb 9.54Xa 0.15 9.45a 9.05b 9.63a 8.51c 0.15 *** *** *** SE= pooled standard error; tr = treatment: concentrate allowance; MY = milk yield; MM = milk per milking; F = milk fat; P = milk protein; MI = milking interval (h).
Values are least square means and pooled standard errors.
a,b,c,d
Values are statistically different within treatment.
XValues are statistically different between treatments.
not significantly different. Then, from June till the end of grazing, this trend changed. The greatest difference between groups production was noticed in June (δ= 1.96 kg). On average, HC-group produced 1.07 kg milk/cow and per day more over the season, representing 0.56 kg of milk/kg concentrate (MR). Without taking into account May, the MR reached 0.79 kg milk/kg concentrate. The primiparous had a higher MR than multiparous (0.63 kg milk/kg concentrate in primiparous and 0.49 kg milk/kg concentrate in multiparous; Table 4). Over the study period, cows from HC produced 131 kg more milk than cows from LC while eating 247 kg more concentrates. Cows from HC had a shorter MI (35 min shorter) than those from LC (P< 0.001) and produced more milk per milking (MM; kg/milking) than the LC-cows (8.94 ± 0.06 kg/ milking in HC and 8.75 ± 0.05 kg/milking in LC;P< 0.05). The difference in MM was greatest in June (0.4 kg/milking;P< 0.05) while in other months differences were not significant.
Milk composition did not change significantly in F% in both groups over the grazing period. Neither did P% except in July when it was greater in HC. In May, F and P production (kg) were similar in both groups but from June till end of August, HC produced on average 0.07 and 0.06 kg/cow per day fat and protein, respectively, more than LC.
Milk P and F production decreased in both groups over the grazing period. The decline was more marked in LC than in HC. The decrease in F production was 36% in LC, compared with 31% in HC, whereas the P production decreased by 31% and by 26% for LC and HC, respectively. Milk solids decreased in LC and HC over the grazing period. Nevertheless, the decrease was less pronounced for HC. Thus, milk solids production was higher at 0.07 kg/cow per day for HC than for LC, resulting in an extra milk solids production of 0.04 kg/kg concentrate. As a consequence, HC-cows produced nearly 12.3 kg milk solids/cow more than LC cows over grazing period.
Figure 1 Time schedule of milkings of grazing cows milked by an automatic milking system: month effect. *Significantly different values.
When compared with multiparous, primiparous produced less milk over the experimental period in both groups. However, MR was higher in primiparous. HC-primiparous presented a significantly shortened MI (8.62 ± 0.08 h) compared with other groups (9.75 ± 0.1 h;P< 0.001).
Milk per milking was higher in multiparous compared with primiparous in both groups; this difference was more pro-nounced in HC (difference= 2.34 kg in LC and 3.73 kg in HC). Primiparous of HC produced less MM than LC-primiparous (−0.51 kg), due to the shortened MI, but over the day HC-primiparous produced on average 1.10 kg milk more than did
LC-primiparous. Although F% and P% were similar regardless the lactation number, primiparous produced less F (0.70 to 0.97 kg/cow per day) and P (0.59 to 0.84 kg/cow per day), respectively, in primiparous and multiparous. Milk solids production was influenced by the concentrate supply and by the lactation number.
Discussion
In this study, grazing cows milked by an AMS were monitored over a period corresponding to the typical grazing period in
Figure 3 Influence of treatment on milkings time schedule. *Significantly different values.
Table 4Effect of lactation number (LN) and of concentrate allowance (low concentrate (LC); high concentrate (HC)) on milk yield and composition, traffic (visitations, milkings and refusals) to the robot of grazing cows milked by an automatic milking system
LC HC Statistical significance
Primi Multi SE Primi Multi SE tr LN tr× LN
Concentrate (kg/day) 2.10 2.17 0.04 3.84 4.43 0.04 *** *** ***
Yield (kg/cow per day)
MY 17.90Xa 24.75Xb 0.30 19.00a 25.81b 0.30 *** *** Ns MM 7.58Xa 9.92Xb 0.09 7.07a 10.80b 0.08 *** * *** F 0.67Xa 0.93Xb 0.01 0.72a 1.00b 0.06 Ns Ns Ns P 0.58a 0.81Xb 0.01 0.60a 0.86b 0.01 *** *** Ns Milk solids 1.25Xa 1.74Xb 0.02 1.33a 1.87b 0.02 *** *** Ns Composition F% 3.79a 3.78a 0.05 3.79a 3.92a 0.05 Ns Ns Ns P% 3.26a 3.30a 0.05 3.23a 3.40a 0.06 Ns Ns Ns
Traffic (per day)
Milkings (SM) 2.28Xa 2.46Xb 0.03 2.46a 2.32b 0.03 Ns Ns ***
Refusals (RM) 0.61Xa 0.80b 0.06 1.41a 0.70b 0.06 *** *** ***
Visitations 2.93a 3.27b 0.09 4.10a 3.10b 0.09 *** *** ***
MI (h) 9.84Xa 9.67a 0.07 8.62a 9.71b 0.07 *** *** ***
Primi= primiparous; Multi = multiparous; SE = pooled standard error; tr = treatment: concentrate allowance; LN = lactation number (1: primiparous or 2: multi-parous); MY= milk yield; MM = milk per milking; F = milk fat; P = milk protein; SM = successful milking; RM = refused milking; MI = milking interval (h). Values are least square means and pooled standard errors.
a,b
Values are statistically different within treatment.
XValues are statistically different between treatments.
Belgium (4 months). This study represents thefirst time that this kind of data were collected with grazing and AMS over such a period in Belgium. Cow traffic to the robot is considered a key factor for AMS profitability (Scottet al., 2014). Halachmi (2004) demonstrated that a decline in returns to the robot even of short duration had a major impact on MY. Following his study, reduction from 2.5 to 2.0 visits/cow per day lead to a decrease in MY from 24 to 18 kg/cow per day. Analysing the impact of concentrate supplementation on voluntary cow traffic was the main objective of this study. The effect on cows’ production was also evaluated to verify whether concentrate allocation was profitable from an economic point of view – that is, if the extra costs linked to concentrate allocation were counterbalanced by a subsequent increase in milk yield. Impact on voluntary cow traffic
The use of AMS requires voluntary action of individual cows, while ordinarily their behaviour in pasture tends to be more gregarious. It is thus necessary to provide an incentive for increasing robot visitations and consequently milkings. Milking frequencies (2.37 ± 0.02/day in HC and 2.35 ± 0.02/day in LC) observed in our study were comparable with those reported by Spörndly and Wredle (2005). Other studies performed in fully grazing systems by Jago et al. (2007) and Lyons et al. (2013b) in New Zealand and Australia, respectively, recorded less milkings/day: 1.7 milkings/cow per day (Jago et al., 2007) and 1.5 milkings/cow per day (Lyonset al., 2013b). Milking permission time does not seem to be a limiting factor as cows were allowed to be milked after a 4-h interval, similar to Lyonset al. (2013b), while in Spörndly and Wreddle (2005), the time elapsed between two milkings must have been greater than 6 h.
In the present study, high concentrate level increased the robot visitations but also caused more RM in HC. At lower pasture availability and quality, visitations to the robot in HC were more frequent, while they stayed constant in LC. Refusals were increased in both groups at low pasture availability and quality. The impact of pasture availability on cow traffic to the robot has been previously described by Ketelaar-de Lauwere et al. (2000) in an experimental design including an AMS located in the barn. In these conditions, low pasture biomass was linked to an increase in time spent indoors and consequently to a rise in milkings. Lyonset al. (2014) observed that at low pasture availability, cows tend to walk to a new pasture allocation. A similar observation was made in the present study, as cows preferred to return to the robot and eventually get refused than to stay on the pasture.
Milkings and refusals distribution time over the grazing period
As described in other studies (Ketelaar-de Lauwereet al., 1999; Johnet al., 2016), fewer visits occurred at night. May recorded the highest number of robot visitations from 0000 to 0400 h, although visits at that time period remained uncommon (<10% of total milkings and <5% of total refusals). The cause of the higher frequency of night visits in
May is unclear. Weather conditions influenced milking and refusal schedules, with a reduction of robot visitations to the robot during hot period (1200 to 1600 h) in July and August with visit schedules moving to periods 1600 to 0000 h. This observation is in accordance with other studies (Ketelaar-de Lauwere et al., 2000; John et al., 2016). Although the majority of milkings (56% in LC and 50% in HC) occurred within periods of new pasture allocation corresponding to changing gates (from 0800 to 1200 h and from 1600 to 2000 h), HC came more regularly to the robot than LC. On the contrary, the majority of refusals in LC happened from 1600 to 2000 h. The same observations were made for all groups of cows except for HC-primiparous who recorded a high rate of refusals from 1200 to 1600 h. It appears that at HC, both pasture and concentrate supplementation influenced cow traffic while pasture allocation was the most important incentive in LC cows.
Influence of parity
Several studies have shown differences in the individual motivation of cows to be milked by an AMS– for example, hierarchy, aggressiveness, milk production and stage of lactation. Ketelaar-de Lauwere et al. (1996) described that the timing of visits to the AMS was influenced by the rank of the cows with a higher rate of night visits for dominated cows. Jacobs et al. (2012) showed that parity, linked to a lower BW could influence traffic to the robot with low-ranked cows staying a longer time in the waiting area before being milked. Ketelaar-de Lauwereet al. (2000) observed a higher frequency of non-milking visits in heifers. Halachmi (2004) included social priority in the simulation model helping for designing AMS facilities. In the present study, parity influenced traffic to the robot, but this impact differed following the concentrate allocation. Thus it is unlikely that the observed differences could be only due to the lower rank of primiparous. The HC-primiparous RM frequencies were the highest in all periods. On the contrary, LC-primiparous, SM and RM per day were consistently less frequent than LC-multiparous ones. Milking frequency seemed comparable in both groups but this figure was the result of the different behaviour of primiparous in both groups. In LC-group, primiparous were milked less frequently than multiparous, while the contrary was observed in HC-group. It is note-worthy to mention that all the cows were trained to be milked on pasture before the beginning of this experiment. The HC-primiparous might have become accustomed to visit the robot more frequently by the more attractive amount of concentrate provided. The rapid adaptation of heifers to pasture-based AMS is in line with other studies, which observed increase of heifers’ robot visitations (Ketelaar de Lauwereet al., 1998) and lower waiting time of primiparous in the robot facilities (Scottet al., 2014).
The level of concentrates influenced milking interval. It was shorter in HC (9.04 ± 0.05 h and 9.77 ± 0.05 h in LC) and surprisingly correlated with higher MM. This finding can be explained by the steady MM observed in HC in June compared with LC. During this period, the difference
between both groups reached 0.4 kg/milking impacting the mean MM recorded over the grazing period.
Milking frequency is correlated to AMS performance. Effect of minimum milking interval was studied in a pasture-based AMS by Jagoet al. (2007). They concluded that larger MI than 12 h could be targeted without negative impact on MY. By contrast, 16 h (Lyons et al., 2013b) to 18 h (Jago et al., 2007) of delay between milkings decreased milk pro-duction. A MI>12 h corresponding to <2 milkings/day was recorded in only 27% of HC compared with 31% in LC (P< 0.05). Only 12% HC demonstrated MI >16 h whereas it was recorded in 14% of LC. Primiparous from the HC-group had a major impact on that observation with a reduction in MI of 1 h compared with other groups whose value was similar (HC-multiparous: 9.71 h, LC-multiparous: 9.67 h and LC-primiparous: 9.84 h). Increased traffic to the robot initiated by higher concentrate supply could lower the time left for eating, grazing and ruminating as it has been demonstrated in other studies (Halachmiet al., 2005; Bach et al., 2007). However, in our study, lower MI of HC-cows increased robot visitations and affected positively MY. This effect was even more pronounced for primiparous.
Milk production and composition
The poor weather conditions recorded in 2013 tended to decrease pasture quality and availability over the grazing period. In these conditions, providing an additional amount of concentrates induced a greater response in milk production from June to August compared with May, where no difference in MY was observed between LC and HC. On average, HC cows produced an additional 1.19 kg milk representing 0.69 kg of milk per kg concentrate. Following the literature (Dufrasne et al., 1996; Reis and Combs, 2000; Bargoet al., 2002; Kennedy et al., 2003; McEvoyet al., 2008; Auldistet al., 2013), several factors influence the effect of concentrates supplementation on average milk yield and composition – for example, pasture availability and quality, stage of lactation and genetic merit. At high pasture allowance, pasture quality influences pasture intake: Peyraud and Delagarde (2013) reported that pasture intake could vary from 18.9 kg DM/cow per day for excellent pasture quality to 15.5 kg DM/cow per day in very poor pasture quality. In our study, higher pasture nutritional values were observed compared with those reported by McEvoy et al. (2008), Bargo et al. (2002) and Pérez-Prieto et al. (2011), promoting higher pasture intake and lower grass to concentrate substitution rate. The negative MR observed in May presumed a low substitution rate and could be explained by the high WSC content of spring pasture promoting increase in pasture intake and in MY, which is in accordance with other authors (Peyraud and Delagarde, 2013; Johnet al., 2016).
The mean MR of 0.56 kg milk/kg concentrate over the grazing period is lower than that reported in previous studies. An increase in milk production between 0.96 and 1.36 kg/kg concentrate at grazing was observed by Bargoet al. (2002), between 0.86 and 1 kg/kg concentrate by Reis and Combs (2000), 1.12 kg/kg concentrate by Jago et al. (2007) and 1.04 kg/kg concentrate by Delabyet al. (2001). Should periods
of high pasture availability not been considered (e.g. in May), closer figures to those reported in other studies would be obtained confirming that the effect of concentrates on MY was influenced by pasture availability and quality. Grazing management (strip-grazing modulating pasture allowance) could also be invoked to explain lower MR (Peyraud and Delagarde, 2013).
In our study, mean F% and P% over the grazing period were 3.82% and 3.37%, respectively. In similar conditions with cows receiving 2 kg concentrates, Dieguez et al. (2001) reported similar values (F%: 3.9% and P%: 3.3%) to the ones reported herein. In the present study, supplementation of concentrates increased milk fat and protein production. This result is con-firmed by previous studies (Delabyet al., 2001; Kennedyet al., 2003) reporting an increase in fat and protein production in relationship with introduction of concentrates of similar nutri-tional values. Low concentrate group produced less milk solids over the grazing period and the difference between both groups was more pronounced in June (difference= 0.16 kg/cow per day compared with 0.03 kg/cow per day in May) when pasture availability was the lowest. Then, the difference in solids production between HC and LC became stable till the end of grazing period (0.11 kg/cow per day in July and August). Conclusion
This experiment demonstrates a response to concentrate offered to grazing cows milked by a mobile AMS at numerous levels. The cow traffic to the robot was influenced by concentrates’ level during the measurement period, with more frequent robot visitations in the HC-group than in LC-group. By contrast, milking frequency did not change regardless of the level of concentrates. However it has to be noted that primiparous from the HC-group behaved differently. Milkings of primiparous were increased at higher concentrate allocation, as did refusals. Concentrate allowance increased traffic to the robot leaving less time for eating and ruminating. Despite this time and energy expenditure, milk production per milking and per day increased, except during periods of high pasture availability and quality. Average milk yield and composition were generally improved by higher levels of concentrate sup-plementation. When pasture availability and quality decreased, difference between HC and LC groups strengthened despite the energy spent to travel to the robot in HC-group. Finally, in the specific conditions of the present study, allocating higher amounts of concentrates might be questioned regarding the low MR. Thus, concentrate supply should be adapted with regards to pasture quality and availability to maximise economic impact on milk yield and on traffic. Using higher concentrate allocation could be advised to maximise primi-parous traffic to the robot and take full advantage of concentrate allocation related to their higher MR.
Acknowledgements
This research was funded by the EU project Autograssmilk SME FP7 314879.
References
Auldist MJ, Marett LC, Greenwood JS, Hannah M, Jacobs JL and Wales WJ 2013. Effects of different strategies for feeding supplements on milk production responses in cows grazing a restricted pasture allowance. Journal of Dairy Science 96, 1218–1231.
Ayadi M, Caja G, Such X, Rovai M and Albanell E 2004. Effect of different milking intervals on the composition of cisternal and alveolar milk in dairy cows. Journal of Dairy Research 71, 304–310.
Bach A, Iglesias C, Calsamiglia S and Devant M 2007. Effect of amount of concentrate offered in automatic systems on milking frequency, feeding behaviour, and milk production of dairy cattle consuming high amounts of corn silage. Journal of Dairy Science 90, 5049–5055.
Bargo F, Muller LD, Delahoy JE and Cassidy TW 2002. Milk response to concentrate supplementation of high producing dairy cows grazing at two pasture allowances. Journal of Dairy Science 85, 1777–1792.
Burow E, Thomsen PT, Sørensen JT and Rousing T 2011. The effect of grazing on cow mortality in Danish dairy herds. Preventive Veterinary Medicine 100, 237–241.
De Boever JL, Vanacker JM, Fiems LO and De Brabander DL 2004. Rumen degradation characteristics and protein value of grassland products and their prediction by laboratory measurements and NIRS. Animal Feed Science Technology 116, 53–66.
de Koning CJ 2011. Automatic milking: common practice on over 10000 dairy farms worldwide. In Dairy research foundation symposium (ed. P Celi), volume 16, pp. 14–31. University Printing services Sydney, Sydney, NSW, Australia. Delaby L, Peyraud JL and Delagarde R 2001. Effect of the level of concentrate supplementation, herbage allowance and milk yield at turn-out on the performance of dairy cows in mid lactation at grazing. Animal Science 73, 171–181.
Delamaire E and Guinard-Flament J 2006. Increasing milking intervals decreases the mammary bloodflow and mammary uptake of nutrients in dairy cows. Journal of Dairy Science 89, 3439–3446.
De Olde E, Oudshoorn FW, Sørensen CG, Bokkers EAM and De Boer IJM 2016. Assessing sustainability at farm-level: lessons learned from a comparison of tools in practice. Ecological Indicators 66, 391–404.
Dieguez F, Hornick JL, De Behr V, Istasse L and Dufrasne I 2001. Incidences phytotechniques et zootechniques d’une réduction ou d’une suppression de la fertilisation azotée sur des prairies pâturées par des vaches laitières. Animal Research 50, 299–314.
Dillon P, Roche JR, Shalloo L and Horan B 2005. Optimisingfinancial return from grazing in temperate pastures. . In Proceedings of a satellite workshop of the 20th General Meeting of the European Grassland Federation (ed. JJ Murphy), pp. 131–147. Wageningen Academic Publishers, Wageningen, the Netherlands.
Dufrasne I, Gielen M, Limbourg P, Korsak Koulagenko N and Istasse L 1996. Effets d’une augmentation de la fumure azotée ou de la distribution supplé-mentaire de concentré sur les performances et les teneurs en urée plasmatique de vaches laitières soumises au pâturage continu et en rotation. Annales de Zootechnie 45, 135–150.
Dufrasne I, Robaye V, Knapp E, Istasse L and Hornick JL 2012. Effects of environmental factors on yield and milking number in dairy cows milked by an automatic system located in pasture. In Proceedings of the 23rd General Meeting of the European Grassland Federation, Grassland – a European resource, volume 17, pp. 231–233. Polish Grassland Society Publishers, Poznan, Poland.
Halachmi I 2004. Designing the automatic milking farm in a hot climate. Journal of Dairy Science 87, 764–775.
Halachmi I, Ofir S and Miron J 2005. Comparing two concentrate allowances in an automatic milking system. Animal Science 80, 339–343.
Hongerholt DD, Muller LD and Buckmaster DR 1997. Evaluation of a mobile computerized grain feeder for lactating cows grazing grass pasture. Journal of Dairy Science 80, 3271–3282.
Jacobs JA, Ananyeva K and Siegford JM 2012. Dairy cow behavior affects the availability of an automatic milking system. Journal of Dairy Science 95 (suppl. 4), 2186–2194.
Jago JG, Davis KL, Copeman PJ, Ohnstad I and Woolford MM 2007. Supplementary feeding at milking and minimum milking interval effects on cow
traffic and milking performance in a pasture-based automatic milking system. Journal of Dairy Research 74, 492–499.
John AJ, Clark CEF, Freeman MJ, Kerrisk KL, Garcia SC and Halachmi I 2016. Review: milking robot utilization, a successful precision livestock farming evolution. Animal 7, 1–9.
Kennedy J, Dillon P, Delaby L, Faverdin P, Stakelum G and Rath M 2003. Effect of genetic merit and concentrate supplementation on grass intake and milk production with Holstein Friesian dairy cows. Journal of Dairy Science 86, 610–621. Ketelaar-de Lauwere CC, Devir S and Metz JHM 1996. The influence of social hierarchy on the time budget of cows and their visits to an automatic milking system. Applied Animal Behavior Science 49 (suppl. 2), 199–211. Ketelaar-de Lauwere CC, Hendriks MMWB, Metz JHM, Schouten WGP 1998. Behaviour of dairy cows under free or forced cow traffic in a simulated automatic milking system environment. Applied Animal Behavior Science 49 (suppl. 2), 199–211.
Ketelaar-de Lauwere CC, Ipema AH, Lokhorst C, Metz JHM, Noordhuizen JPTM, Schouten WGP and Smits AC 2000. Effect of sward height and distance between pasture and barn on cows’ visits to an automatic milking system and other behaviour. Livestock Production Science 65 (suppl. 1–2), 131–142.
Ketelaar-de Lauwere CC, Ipema AH, van Ouwerkerk ENJ, Hendriks MMWB, Metz JHM, Noordhuizen JPTM and Schouten WGP 1999. Voluntary automatic milking in combination with grazing of dairy cows. Applied Animal Behavior Science 64 (suppl. 2), 91–109.
Lyons NA, Kerrisk KL and Garcia SC 2013a. Comparison of 2 systems of pasture allocation on milking intervals and total daily milk yield of dairy cows in a pasture-based automatic milking system. Journal of Dairy Science 96, 4494–4504.
Lyons NA, Kerrisk KL and Garcia SC 2013b. Effect of pre-versus postmilking supplementation on traffic and performance of cows milked in a pasture-based automatic milking system. Journal of Dairy Science 96, 4397–4405.
Lyons NA, Kerrisk KL, Dhand NK, Scott VE and Garcia SC 2014. Animal behavior and pasture depletion in a pasture-based automatic milking system. Animal 8 (suppl. 9), 1506–1515.
McEvoy M, Kennedy E, Murphy JP, Boland TM, Delaby L and O’Donovan M 2008. The effect of herbage allowance and concentrate supplementation on milk production performance and dry matter intake of spring-calving dairy cows in early lactation. Journal of Dairy Science 91, 1258–1269.
Pérez-Prieto LA, Peyraud JL and Delagarde R 2011. Substitution rate and milk yield response to corn silage supplementation of late-lactation dairy cows grazing low-mass pastures at 2 daily allowances in autumn. Journal of Dairy Science 94, 3592–3604.
Peyraud JL and Delaby L 2001. Ideal concentrate feeds for grazing dairy cows-response to concentrates in interaction with grazing management and grass quality. In Recent advances in animal nutrition (ed. PG Garnsworthy and J Wiseman), pp. 203–220. University of Nottingham University Press, Nottingham, UK.
Peyraud JL and Delagarde R 2013. Managing variations in dairy cow nutrient supply under grazing. Animal 7 (suppl. 1), 57–67.
Reis RB and Combs DK 2000. Effects of increasing levels of grain supplementation on rumen environment and lactation performance of dairy cows grazing grass-legume pasture. Journal of Dairy Science 83, 2888–2898. Scott VE, Thomson PC, Kerrisk KL and Garcia SC 2014. Influence of provision of concentrate at milking on voluntary cow traffic in a pasture-based automatic milking system. Journal of Dairy Science 97, 14981–1490.
Spörndly E and Wredle E 2005. Automatic milking and grazing– effects of location of drinking water on water intake, milk yield, and cow behavior. Journal of Dairy Science 88 (suppl. 5), 1711–1722.
Stockdale CR, Walker GP, Wales WJ, Dalley DE, Birkett A, Shen Z and Doyle PT 2003. Influence of pasture and concentrates in the diet of grazing dairy cows on the fatty acid composition of milk. Journal of Dairy Research 70, 267–276. van Dooren HJCE, Spörndly E and Wiktorsson H 2002. Automatic milking and grazing. Applied grazing strategies. Deliverable D25, EU project‘Implications of the introduction of automatic milking on dairy farms’ (QLK5-2000-31006). Retrieved on 29 April 2014 from http://www.automaticmilking.nl
Wales WJ, Kolver ES, Egan AR and Roche R 2009. Effects of strain of Holstein-Friesian and concentrate supplementation on the fatty acid composition of milk fat of dairy cows grazing pasture in early lactation. Journal of Dairy Science 92, 247–255.