cahier n° 2002-03
Do private pension funds increase household
consumption? An empirical study
par
N. El Mekkaoui de Freitas, A. Mourougane
P. Ralle
D
OP
RIVATEP
ENSION FUNDS INCREASEHOUSEHOLD CONSUMPTION
? A
NE
MPIRICALS
TUDYNAJAT EL MEKKAOUI-DE FREITAS, ANNABELLE MOUROUGANE AND PIERRE RALLE1*
2NDV
ERSION : NOVEMBER, 2001
Private pension plans are now an important source of retirement income, especially in the United Kingdom and in the United States. They play an increasing role in the economy of most of the OECD countries. Therefore, we analyse the effect of pensions on private consumption.
We focus on the estimation of a ECM consumption function in the case of the United States and the United Kingdom. It is shown that pension funds would have a negative impact on households’saving ratio. However, these estimations remain fragile, given the very limited number of observations avalaible. Some preliminary estimations on panels data are then implemented, showing no impact of pension funds on private consumption. (JEL: C2, E21, G23)
KEYWORDS : HOUSEHOLD CONSUMPTION, SAVING, PRIVATE PENSION FUNDS.
During the last thirty years, private pension funds assets has been extraordinary. In the United Kingdom, we notice the rapid increase in private pension funds from 14 % of the GDP in 1962 to 75% in 1997. As far as the United States concerned, private pension funds reached the equivalent of 67% of GDP in 1997, compared to 13% in 1962.
The role of these institutions is to provide an additional source of income to their
* El Mekkaoui-de Freitas, Université Paris-Dauphine, Place du Maréchal de Lattre de Tassigny, 75116 Paris
Cedex 16. Mourougane, INSEE, Institut National de la Statistique et des Etudes Economiques, 15, Bd Boulevard Gabriel Peri, 92244 Malakoff Cedex. Ralle, DREES, Direction de la Recherche, des Etudes, de l’Evaluation et des Statistiques - 11, Place des cinq martyrs du lycée Buffon, 75696 Paris Cedex 14.The authors are grateful to Michel Dolle, Florence Legros, François Legendre as well to seminar participants at Département des Etudes Economiques, INSEE and at Forum Retraite, Caisse des Dépôts et Consignations.
members (retirees and their dependants). In this respect, the International Monetary Funds (1995) and the World Bank (1994) encourage the implementation of this system in order to solve the problem related to population ageing in the majority of OECD countries. These institutions conceive private pension funds as a significant instrument of national savings policy.
Since Feldstein (1974), which highlighted the negative link between the retirement system and saving, the impact of private pension schemes, both public and private, on the household savings has not been clearly established (see Bernheim and Scholz (1992), Caussat (1992), Munnell and Yohn (1992), Callen and Thimann (1997), Villetelle (1998)). There is no clear consensus on the impact of pensions plans on private savings.
This results from the fact that theory does not yield unambiguous predictions about the impact of household savings or consumption to the existence of private pension funds. The same possible incidence may be identified. First, if pension wealth is seen as a substitute for private accumulation there will be a displacement of the latter when the former is introduced. Second, the introduction of pension plans have been allowed to many workers to retire than they otherwise would. This early retirement would be expected to increase saving, since people who retire early are compelled to save a higher rate over a shorter working life in order to fund a longer period of retirement. But, because of pensions are usually paid in the form of annuities, total savings may be less than if each employee saved for his own retirement. Without pension annuities, the employee would be obliged to save sufficient assets to finance their retirement. By offering annuities, pension plans reduce the workers saving. Third, imperfect capital markets, often prevent households from borrowing freely, thereby forcing them to save more than they otherwise would. Such compulsory saving is most likely to occur among
lower-paid workers who have little saving to reduce in order to offset excessive pension accumulation. These lower-paid workers cannot borrow against future benefits. In this case, they end up saving more than they would have on their own. In this way, private pension funds may increase household savings. We think that, because of the ambiguities in the theoretical effects of these retirement programs on individual saving behavior, empirical research is required.
The main purpose of this paper is to show, using econometric techniques, the potential relation between the development of pension funds and household consumption within the OECD countries.
The first part of the paper analyses the relation from a simple descriptive outlook. The second part underlines the differents issues raised by any empirical work about private pension funds. Finally, the third part provides an assessment of the impact of their development on household consumption, using an econometric time series analysis for the United States and the United Kingdom.
The inadequacy of available observation data constrains the realization of this project. In order to establishes a link between the macroeconomic performances and the different retirement systems (pay-as-you-go versus private pension funds), we must indeed consider a long period of time, amounting to at least an entire life-cycle. This requires a homogenous set of data for each country spread over a minimum of sixty years, which represents a huge task. Moreover, lack of proper data prevents form taking into account the various institutional context according to each country.
The econometric analysis presented in this paper has two steps. Firstly, for the US and the UK where relatively long series of data (approximately thirty years) are available, we consider a consumption function into which pension funds are introduced. We find a minor positive effect on consumption and hence a minor negative effect on houselhold saving. Secondly, a similar equation is considered for a large number of
countries over a shorter period, which takes into account the cross-country dimension. In this case, we find no effect. The results presented appear not to be very conclusive. Two reasons can be put forward. On the one hand, this may prove that no relation exists between private pension funds, consumption and saving. On the other hand, the relation cannot be exhibited without properly taking into account institutional aspects.
I. Relative size of private pension funds and household consumption
Private pension plans are organized by one or more private or public companies to the benefit of their employees. They are assimilated to non-banking financial organizations which perceive wage and/or employers' contributions and are managed by capitalization. Such system exists in the majority of industrialized countries (United Kingdom (UK), United States (US), Germany, Canada, Denmark, Italy, Netherlands, Portugal, Japan, Australia, Sweden and Switzerland). Only France constitutes an exception with no private pension funds.
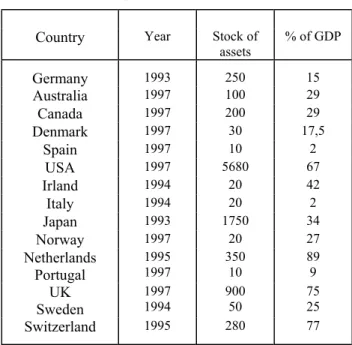
Table 1 : Assets of pension funds, ($bn.)
Country Year Stock of assets % of GDP Germany 1993 250 15 Australia 1997 100 29 Canada 1997 200 29 Denmark 1997 30 17,5 Spain 1997 10 2 USA 1997 5680 67 Irland 1994 20 42 Italy 1994 20 2 Japan 1993 1750 34 Norway 1997 20 27 Netherlands Portugal 1995 1997 350 10 89 9 UK Sweden 1997 1994 900 50 75 25 Switzerland 1995 280 77
Financial wealth of pension funds is particularly high in Anglo-American countries (see Table 1). In these countries, pension funds were instituted at the end of the nineteenth century. On the contrary, financial wealth of these retirement systems is relatively weak in all continental Europe2, where they have been established later. Several factors explain the growth of pension funds. First, the level of development of social security. In countries where social protection and old-age public insurance are well developed, the growth of pension funds is limited. This is noted in continental Europe countries (Fisher &Reisen, 1994). Second, the compulsory nature of pension funds. In Switzerland and the Netherlands for instance, where pension funds are compulsory, they represent respectively 89 % and 77% of the GDP (see Table 1). In all other countries, firms are not required to set up a plan for their employees. However, in the United States, United Kingdom, Canada and Japan, employees may switch their contribution from public to private system, thus allowing greater growth.
Third, the level of maturity. In the United States and the United Kingdom, the strong growth of pension funds respectively in the sixties and seventies (see Charts 1 and 2) reflects their low level of maturity. They should now experience a weaker growth (see Shieber and Shoven, 1994). For other OECD countries, great potential for growth still remain.
Four, the performance of financial markets. The return generated by the private pension funds constitutes a fundamental factor of their growth (see Davis (1988), Schieber & Shoven (1994), El Mekkaoui (1999)). Within the industrialized countries, the British, Australian and Irish pension funds exhibit best net returns over the period 1983-1993 (respectively, 10.3%, 11.4% and 10.2%). Over the same period, the American, Norwegian and Swedish funds profitability lie between and 8 % and 10%, whereas the Japanese, German and Dutch pension funds returns reached between 6 %
and 7%. These variations reflect differences in portfolio regulations. Less constraining regulations are presently in force in all Anglo-American countries. Thus, countries in which investments are managed without constraint allows dynamic management policies and show higher portfolio returns (Blake (1992), Reisen & Williamson (1994), Davis (1995), El Mekkaoui (1998)).
Five, the fiscal system. In all OECD countries, pension funds are subject to particular tax treatment, allowing tax exemptions (see EU (1994), Davis (1995)). These exemptions on employers and employees contributions and returns on investments have contributed to the emergence and growth of private pension funds.
The enormous growth of pension funds has brought attention on their impact on household consumption. Some stylized facts on household saving and private pension funds give a first idea of the potential relations between them. In the most of industrialized countries, the level of household saving was quite high in the mid-seventies, reaching nearly 24% in Japan, 15% in Germany, and nearly 10% in the United States.
In the early nineties, household savings are significantly high in some countries where pension funds are developed, particularly in Canada, Denmark, Switzerland, Japan and the UK. Nevertheless, the relation cannot be established in any easy way, since, in other countries where private pension funds are pervasive, such as the United States or the Netherlands, the level of household savings rate is low. However, international comparisons of household saving must be carried out cautiously due to differences in measurement methods. Institutional or countable divergences involve significant corrections in the saving rate (Artus and Morin (1991), Villieu (1997)).
Regarding the evolution, household savings rate is stable in the United Kingdom and decreases in the United States and Canada since the beginning of the eighties.
II. Results of previous empirical studies
A. The empirical study on the household saving were not conclusive
The first empirical contributions on the incidence of private pension plans coverage on the household saving rate by Cagan (1965), Katona (1965), Feldstein (1974, 1978, 1996) and Munnell (1976) show contradictory results.
The first studies were based on investigations on households. Cagan (1965) analysed the saving response of over 15 000 members of Consumers Union in 1958-59. He found that those covered by pension plans saved more in other forms that those not covered. Katona (1965) study was based on personal interviews conducted by Survey Research Center of the University of Michigan about American families in 1962-63. He also concluded that pension plan stimulate saving. Cagan and Katona’ results contradict the life-cycle model by implying that a person’s preference for present income over future income is modified by participation in a pension plan. Munnell (1974) analysed a subsample used by Cagan and found that the results contradicted Cagan’s earlier conclusions. The results of Munnell indicate that coverage by pension plans discourages saving in other forms. A second study by Munnell (1976) examined the relationship between pension funds and saving using a sample of men in their pre-retirement years over the period 1966-71. She showed again that pensions discourage saving and concluded that employees reduce their saving by 62 cents for every dollar of increased pension promises.
Feldstein (1974) has been one of the first authors to test an aggregate consumption function. He estimated an equation of private saving, with real disposal income, unemployment rate, private wealth, social security wealth and pension saving. The coefficients of pension saving and most other variables were not statistically significant. Later empirical studies remain still unconclusive (Bernheim and Scholz (1992), Caussat (1992), Munnell and Yohn (1992),
Callen and Thimann (1997), Villetelle (1998)). For example, the studies undertaken by Gordon and Wise (1983) emphasize the absence of relation between the pensions and household savings. Diamond and Hausman (1980), on other hand, identified a substitution between individual asset accumulation and pension benefits. They indicated that wealth was decreased by $ 5.84 for each dollar of annual benefits a household expected to receive after retirement. Callen and Thimann (1997) in a recent International Monetary Funds study indicate " existing empirical work on the impact of retirement system on the househlod saving
was generally not conclusive ". These studies highlight either a negative effect of the
retirement on saving, or alternatively, positive or neutral effect. Also we notice that most studies explored the relationship between private wealth accumulation and social security benefits and not between private wealth and pension funds.
B. Lack of data as a partial explanation of non conclusive results
The size of pension funds is mesured through their stock of assets. This value reported as a percentage of the GDP constitutes an approximation of the financial wealth of private pension funds within the economy (see Davis (1995), Demirgüç and Levine (1996)). In the last part of our analysis, we use this variable like a proxy of the financial wealth of private pension funds. Except for the United States and United Kingdom, the statistical series are only available from the eighties for Canada, Switzerland, Japan, Norway, Netherlands and Sweden. For the remaining OECD countries, the statistical series on the pension funds exist only from the nineties. The lack of long time-series reflects either the recent appearance of the phenomenon, the absence of information or the difficulty in collecting it. The international organizations have only recently started to gather data on the funds. The OECD, for instance, started publishing statistics related to the funds for industrialized countries only since 1997. This absence of data has made in the past and continue to turn the testing of the empirical
validity of economic theory very difficult to implement.
III. Some evidence of a significant link between private pension funds and the long term level of the consumption in the United States and the United Kingdom
To analyse the incidence of private pension funds on households' consumption and since Feldstein (1974, 1978, 1996), the framework of analysis is the life-cycle model. Because of the limited number of observations on pension funds assets for the majority of the countries, the study first focuses on the United States and the United Kingdom. Estimates on panel data are carried out thereafter.
A. Has the development of private pension funds affected households' consumption
in the United States and in United Kingdom?
1. Justification of the relation tested and properties of the series
An error correction equation of consumption was estimated. The determinants retained are the standard variables, namely purchasing power of the households disposable income, prices, and a variable representing the wealth of private pension funds.
(I) fdppib c fdppib c R c C c p c R c c C= + ∆ + ∆ + − + − + − + ∆
∆log 0 1 log 2 log 3log ( 1) 4log ( 1) 5 ( 1) 6
with C: household consumption in volume
R: purchasing power of households disposable income P: consumption deflator
Fdppib: ratio of pension funds assets over GDP
In accordance with the theory of permanent income (Friedman, 1957), the purchasing power of the households disposable income was introduced with dynamic effects. In the short
run, this variable should play the most significant role. In addition, it is usual to impose that the elasticity of income to consumption is equal to one, i.e. the propensity to consume is stable. With the notations of equation (I) this constraint is equivalent to c3 =−c4.
The consumption rate is supposed to react to the price changes describing either an effect of escape in front of the currency or a real cash effect depending on the sign of the relation. According to the first effect, households advance the date of their purchase because they anticipate rises in price in period of inflation. According to the second effect, on the contrary, households seek to maintain constant the purchasing power of their cashes. They thus decrease their consumption to compensate for erosion due to inflation. Similar consumption equations integrating traditional determinants are present in many macroeconomic models (see Michaudon-Prigent (1998), Groupe de comparaison des modèles (1996)). The pension funds growth was introduced into the equation by using the proxy « Pension funds assets in percentage of GDP ». Such a variable can be regarded as a term of household wealth. Implicitly, two assumptions are made. On the one hand, it is supposed that the totality of pension funds assets is held by the households. On the other hand, the households save only for their retirement. In particular, precautionary saving that ensures households in case of disease or unemployment is regarded as negligible. Obviously, these assumptions relativize the significance of the results which will be obtained. Neverthless, part of these assumptions, relating to unemployment precautionary saving, will be slackened thereafter.
In order to justify an error correction model of consumption, the statistical properties of the series were studied. The economics series are taken from the OECD Economic Outlooks database, the private pension funds series for the United Kingdom from the Central Statistical Office (CSO-ONS) and the private pension funds series for the United States from the Federal Reserve Board. We first look at the stationarity of the series. The Augmented Dickey-Fuller
and Phillips-Perron tests show that the series of the logarithm of consumption are integrated of order 1 (see Appendix 1). Such a result is well established in the literature (see Bloch-Maurel (1991), Bonnet-Dubois (1995) for France). The proxy of private pension funds growth is also integrated of order 1. This result being less known, complementary analyses were carried out to test its robustness (see Table 2 in Appendix 1).
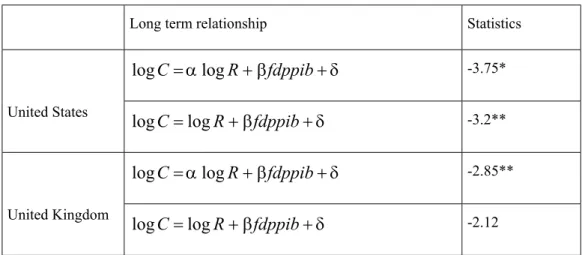
The Engle-Yoo test (1987) on the long term relation estimated residual shows, in the United States, the existence of a cointegration relation at 5% between the logarithm of consumption, the logarithm of the real income and the proxy. The result is less clear when the long term elasticity of income to consumption was imposed equal to one (see Table 2). In the United Kingdom, the stationnarity of the residual is accepted at 10% only if the long term elasticity of income to consumption is not constrainted to one. In this case, the assumption of cointegration is accepted only at 10%. Overall, in the two countries, the existence of a relation of cointegration justifies the form of model (I). These results should nevertheless be considered with caution. Indeed, the Engle-Yoo critical values were calculated for samples of 50 observations whereas the tests were carried out on a sample of 31 observations for the United States and 25 observations for the United Kingdom.
Table 2 : Engle-Yoo test results
Long term relationship Statistics
δ β α + + = R fdppib C log log -3.75* United States = +β +δ fdppib R C log log -3.2** δ β α + + = R fdppib C log log -2.85** United Kingdom = +β +δ fdppib R C log log -2.12
Reading :the residual is stationary at 5%(*), at 10%(**).
2. Results in the American case
Equation (I) was initially estimated in one step (see Table 3). A two steps estimate does not change significantly the results (see Appendix 2). Our method consisted in starting from the entire model (I) then to withdraw step by step the nonsignificant variables. This method leads us to retain the equation (3') whose statistical quality is rather satisfactory. The Goldfeld and Quandt test does not reject the assumption of homoscedascity in this equation. It should be recalled nevertheless that this test only detects heteroscedasticity caused by one of the variables present in the equation. In addition, the restricted number of observations strongly limits the relevance of this test. According to these estimates, pension funds display a positive effect on the long term level of consumption. Thus, private saving would involve a reduction in other forms of saving, in accordance with the life-cycle theory. The estimates of the equations (1'), (2') and (3') being similar from this point of view, this result can be regarded as rather robust. To precisely determine the elasticity of the proxy to consumption is more problematic. Indeed, this elasticity varies between 0.13 and 0.22 according to whether the constraint of the unit elasticity of income to consumption is imposed or not. However, the Fisher test rejects this constraint at 1% but accepts it at 5%. Also, even if the economic theory
tends to privilege the formulation with constraint, the fragility of this evaluation should be stressed.
Table 3 : One step estimation of the American consumption equation Variable explained : growth rate of consumption
Period of estimation :1963-1994 (1') (2') (3') (3) Intercept -0.03 (-1.74) -0.03 (-1.8) -0.06 (-2.64) 0.8 (1.92) R log ∆ 0.77 (6.66) (6.82) 0.77 (9.07) 0.96 (8.54) 0.9 p log ∆ -0.25 (-2.98) -0.25 (-3.1) - - ) 1 ( logR − 0.56 (3.42) (3.64) 0.57 (3.02) 0.54 (3.66) 0.65 ) 1 ( logC − -0.56 (c) -0.57 (c) -0.54 (c) -0.68 (-3.73) ) 1 (− fdppib 0.05 (1.93) (2.1) 0.05 (2.55) 0.07 (3.17) 0.15 fdppib ∆ 0.01 (0.14) - - - 2 R 0.8 0.8 0.77 0.8 SER (en %) 0.8 0.9 0.9 0.89 AR1 0.26 0.25 0.01 0.28
Reading: t statistics are provided in brackets, (c) means constraint
In order to illustrate the results, equation (I) can be reformulated so as to determine the effect of the development of pension funds on the households long term saving. According to the equation, an increase of 1% of pension funds as a percentage of GDP would materialize in the United States by a fall of 0.07/0.54=0.13 % of the household saving ratio under the assumption of a long term elasticity of income to consumption equal to one.
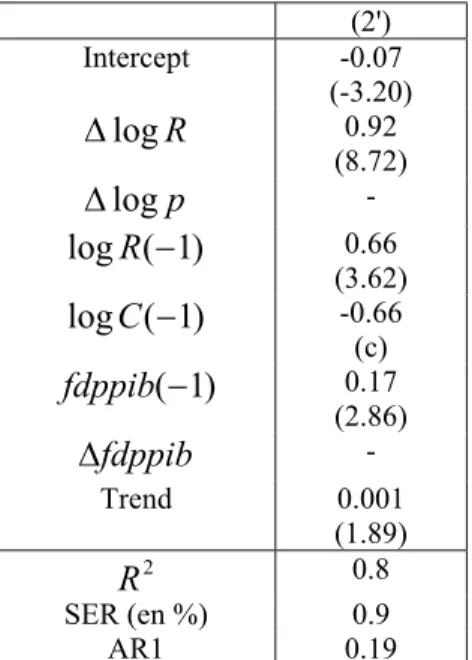
Complementary evaluations were carried out in order to test the robustness of the results presented and to adjust from bias. The evaluations presented above do not correct, for example, the effect of pension funds and rate of employee profit sharing (date of creation of pension funds, date of entry and exit of paid). This correction proves to be difficult to implement from a practical point of view because this type of data are very difficult to collect. An approximate correction was made by the introduction of a trend into equation (I). The addition of a linear trend does not modify the results obtained before, and has no significant
effect on the quality of the estimated model (see Table 4). An increase of 1% of pension funds as a percentage of GDP would coincide in the United States with a fall of 0.17/0.66=0.26 % of the households saving ratio.
Table 4 : one step estimation of the American consumption equation with maturity effect
Variable explained : growth rate of consumption Period of estimation :1963-1994 (2') Intercept -0.07 (-3.20) R log ∆ 0.92 (8.72) p log ∆ - ) 1 ( logR − 0.66 (3.62) ) 1 ( logC − -0.66 (c) ) 1 (− fdppib 0.17 (2.86) fdppib ∆ - Trend 0.001 (1.89) 2 R 0.8 SER (en %) 0.9 AR1 0.19
Reading: t statistics are provided in brackets, (c) means constraint
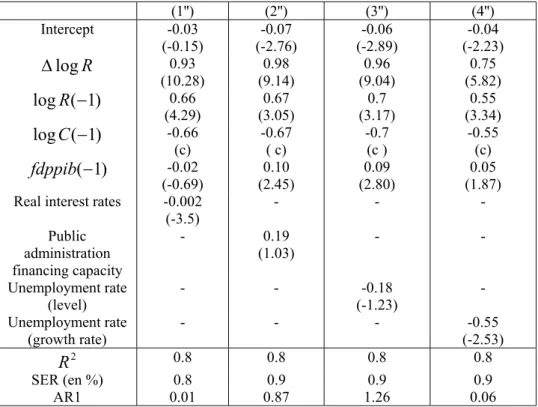
Many other determinants, usually evoked - interest rate, Ricardian equivalence, the unemployment rate- were not integrated in the analyses carried out previously. Their absence being able to bias the estimated coefficients, integrating them in the equation tests the robustness of the results obtained. It appears, that except in the case of the real interest rate, the introduction of the these variables into the list of the regressors does not modify significantly the results.
It is often argued that interest rate is a significant determinant of the behaviour of household consumption in particular in the Anglo-Saxon countries. From a theoretical point of view, the sign of its influence is a priori unspecified because of the simultaneous presence of income and substitution effects. When real short term interest rate is included in the
regression, the proxy pension funds is not more significant. The statistical quality of outcome is then comparable with that of the equation (3') (see Table 5). Thus, introducing a real interest rate effect relativizes the results obtained previously.
Within the framework of a neo-ricardian model, consumption depends on the public financial situation. More precisely, in the presence of public deficit, households will anticipate a rise in the taxes to finance this deficit and thus will save in the view of a future tax. The introduction of the public administrations financing capacity into an equation of consumption is a way to take this effect into account. It appears that this variable does not play a significant role in the American case and that in its presence pension funds as a percentage of GDP remains significant (see Table 6). Of course, the estimation carried is a very rough and simple test of the Ricardian equivalence, in particular because of the endogenous nature of public administration financing capacity variable.
Households can also save for a precautionary motive. Thus, it is often argued that households seek to be ensured against a possible reduction in their income, by increasing their saving. Labour market situation thus strongly condition this behavior. In particular, the existence of a high level of the unemployment rate is the sign of a bad situation on the labour market and encourages households to save more, the risks to lose their jobs being higher. This mechanism does not seem to play significantly in the United States and does not call into question the impact of pension funds on household savings ratio (see Table 6).
Table 5 : One step estimation of the American consumption equation Variable explained : growth rate of consumption
Period of estimation :1963-1994 (1'') (2'') (3'') (4'') Intercept -0.03 (-0.15) (-2.76) -0.07 (-2.89) -0.06 (-2.23) -0.04 R log ∆ 0.93 (10.28) (9.14) 0.98 (9.04) 0.96 (5.82) 0.75 ) 1 ( logR − 0.66 (4.29) (3.05) 0.67 (3.17) 0.7 (3.34) 0.55 ) 1 ( logC − -0.66 (c) -0.67 ( c) -0.7 (c ) -0.55 (c) ) 1 (− fdppib -0.02 (-0.69) (2.45) 0.10 (2.80) 0.09 (1.87) 0.05 Real interest rates -0.002
(-3.5) - - - Public administration financing capacity - 0.19 (1.03) - - Unemployment rate (level) - - -0.18 (-1.23) - Unemployment rate (growth rate) - - - -0.55 (-2.53) 2 R 0.8 0.8 0.8 0.8 SER (en %) 0.8 0.9 0.9 0.9 AR1 0.01 0.87 1.26 0.06
Reading: t statistics are provided in brackets, (c) means constraint
3. Results in the British case
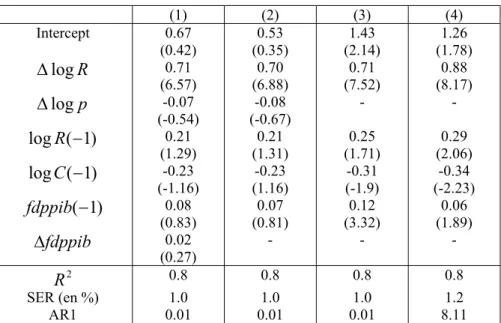
A similar analysis was carried out for the United Kingdom. When imposing the long term of income to consumption equal to one, no cointegration appears. Therefore, only the unconstraint estimate was implemented. The equation (3) was finally retained. As this equation shows (see Table 6), pension funds would have a significant impact on the growth of household consumption. The sign of the relation between the two variables is similar to that obtained for the United States. As in the American case, the Goldfeld and Quandt test does not reject the assumption of homoscedasticity. In spite of a rather good quality of the model as measured by the traditional statistics (see Table 6), the fragility of this result should be stressed. On the one hand, the error correction term is only significant at 10%. In addition, this estimate is not very robust. In particular, the lengthening of the period of estimate until 1994 deteriorates markedly the results and the coefficient corresponding to pension funds is only significant at 10% (see equation (4) in Table 6). The comparison between the equations
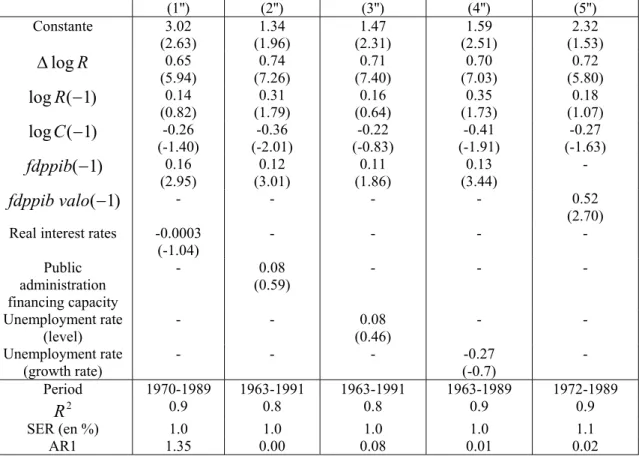
(3) and (4) proves that the measurement of the impact of the pension funds on the long term level of consumption is not robust. It varies between 0.4 (equation (3)) and 0.2 (equation (4)). Contrary to the American case, the introduction of the real interest rate, does not call into question these results. Indeed, the real interest rate does not seem a significant determinant of the private consumption in United Kingdom (see Table 8). This also holds for the financing capacity of public administrations and the unemployment rate (see Table 8). Indeed the former is not significant. The coefficient of the latter does not have the expected sign. In all the cases, the quality of the model estimated is deteriorated by the introduction of one of these determinants. In the same way, the introduction of the market returns does not improve the quality of the model (see table 7).
Table 6 : One step estimation of the British consumption equation Variable explained : growth rate of consumption
Period of estimation :1963-1989 except for equation (4) 1963-1994
(1) (2) (3) (4) Intercept 0.67 (0.42) (0.35) 0.53 (2.14) 1.43 (1.78) 1.26 R log ∆ 0.71 (6.57) (6.88) 0.70 (7.52) 0.71 (8.17) 0.88 p log ∆ -0.07 (-0.54) (-0.67) -0.08 - - ) 1 ( logR − 0.21 (1.29) (1.31) 0.21 (1.71) 0.25 (2.06) 0.29 ) 1 ( logC − -0.23 (-1.16) (1.16) -0.23 (-1.9) -0.31 (-2.23) -0.34 ) 1 (− fdppib 0.08 (0.83) (0.81) 0.07 (3.32) 0.12 (1.89) 0.06 fdppib ∆ 0.02 (0.27) - - - 2 R 0.8 0.8 0.8 0.8 SER (en %) 1.0 1.0 1.0 1.2 AR1 0.01 0.01 0.01 8.11
Table 7 : One step estimation of the British consumption equation Variable explained : growth rate of consumption
(1'') (2'') (3'') (4'') (5'') Constante 3.02 (2.63) (1.96) 1.34 (2.31) 1.47 (2.51) 1.59 (1.53) 2.32 R log ∆ 0.65 (5.94) (7.26) 0.74 (7.40) 0.71 (7.03) 0.70 (5.80) 0.72 ) 1 ( logR − 0.14 (0.82) (1.79) 0.31 (0.64) 0.16 (1.73) 0.35 (1.07) 0.18 ) 1 ( logC − -0.26 (-1.40) (-2.01) -0.36 (-0.83) -0.22 (-1.91) -0.41 (-1.63) -0.27 ) 1 (− fdppib 0.16 (2.95) (3.01) 0.12 (1.86) 0.11 (3.44) 0.13 - ) 1 (− valo fdppib - - - - 0.52 (2.70) Real interest rates -0.0003
(-1.04) - - - - Public administration financing capacity - 0.08 (0.59) - - - Unemployment rate (level) - - 0.08 (0.46) - - Unemployment rate (growth rate) - - - -0.27 (-0.7) - Period 1970-1989 1963-1991 1963-1991 1963-1989 1972-1989 2 R 0.9 0.8 0.8 0.9 0.9 SER (en %) 1.0 1.0 1.0 1.0 1.1 AR1 1.35 0.00 0.08 0.01 0.02
Reading: t statistics are provided in brackets, (c) means constraint
) 1 (−
valo
fdppib : market returns
B. Was the impact of pension funds time-varying?
As mentioned previously, the lack of data and the imperfect quality of those have been a strong impediment to obtain robust results in the former studies. The use of the Kalman filter partly makes it possible to be partly guarded against possible measurement errors. In addition, this technique also gives the possibility of authorizing time varying. In the analyses of the impact of pension funds on household consumption, it is particularly interesting to see whether this incidence varies as one approaches the end of the period of accumulation. Indeed, the former analyses suggested the existence of a rupture of behavior when the period of accumulation of the pension funds is completed. The equations (3') in the American case and (3) in the British case were thus estimated by using this procedure. In a general way, the coefficient associated with pension funds assets is not more volatile than the other coefficients
of regression. At any time, this coefficient was characterized by a larger variability. In the United States, pension funds would have had a negative incidence on the growth of private consumption until the period 1985-1986. The impact would have increased until the middle of the eighty, before stabilising. In United Kingdom, the coefficient of the pension funds would have known a similar evolution but would have been stabilized much more quickly, as of the end of the seventies.
C. According to a study on a sample of countries, the development of pension funds would
not have a significant impact on household consumption
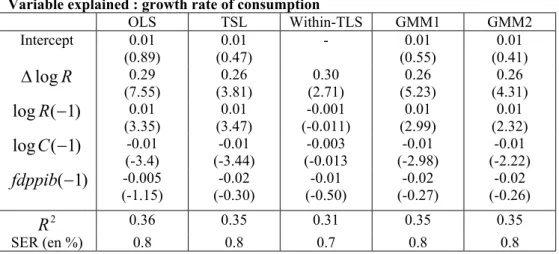
The results obtained for the United States and the United Kingdom are not sufficient to anticipate the impact of pension funds in other countries. Indeed, national specificities, in particular institutional characteristics, make it impossible to extrapolate the previous results. Regressions on panel data were carried out by using the data available on group of nine countries stackled in a non balanced file3. The use of such file was privileged with that of a balance one because it increases markedly the quantity of information used (134 observations against only 31 in the case of a balanced file). In particular, the series relating to the United States and United Kingdom which are available since the years 1960 are entirely used. Equation (I) is presented by omitting the effect of real cash effect and the variation pension funds as a percentage of GDP, whose introduction deteriorated the quality of the regression in the time series analysis. Because of the presence of a dynamic adjustment in this equation, the method of ordinary least squares leads to biased estimates of the coefficients and cannot thus be used. Its results are nevertheless presented for an illustrative purpose (see Table 10). In order to take into account the dynamic character of this equation, the method of the double least squares (TSLS) and the within estimate of the model using the double least squares were carried out (within-TSLS). Lastly, the method of the GMM or method of the generalized
moments was also implemented. A first estimate has been implemented with the White method to correct from heteroscedasticity stemming from the individual dimension (GMM1). Alternatively, in order to take into account a possible correlation of residuals, the procedure of Bartlett has been implemented (GMM2). In all the cases, the lagged explanatory variables have be used as instrument.
The within model gives the worst results, the coefficients of the long term relation not being significant. The estimates resulting from the methods of the double least squares and the GMM lead to very close outcomes. In all the regressions, the proxy for pension funds is never significantly different from zero. In other words, the development of pension funds would have had a neutral impact on household consumption using panel data. This result is not consistent with the former found for the United States and United Kingdom but is not surprising. Indeed, the households saving ratio increased considerably between 1980 and 1990 in countries where pension funds were developed, Switzerland for example. At the agregated level, the total effect can thus be a draw whilst it is significant at a country level.
Table 8 : Consumption function on panel data Variable explained : growth rate of consumption
OLS TSL Within-TLS GMM1 GMM2 Intercept 0.01 (0.89) 0.01 (0.47) - 0.01 (0.55) 0.01 (0.41) R log ∆ 0.29 (7.55) (3.81) 0.26 (2.71) 0.30 (5.23) 0.26 (4.31) 0.26 ) 1 ( logR − 0.01 (3.35) 0.01 (3.47) -0.001 (-0.011) 0.01 (2.99) 0.01 (2.32) ) 1 ( logC − -0.01 (-3.4) (-3.44) -0.01 (-0.013 -0.003 (-2.98) -0.01 (-2.22) -0.01 ) 1 (− fdppib -0.005 (-1.15) (-0.30) -0.02 (-0.50) -0.01 (-0.27) -0.02 (-0.26) -0.02 2 R 0.36 0.35 0.31 0.35 0.35 SER (en %) 0.8 0.8 0.7 0.8 0.8 IV. CONCLUSION
In the debate on retirement, our analysis is an empirical study to evaluate the impact of private pension funds on household consumption. According to the estimates, the
development of private pension funds display a slight and positive impact in the long term of the household consumption in the United States as well in the United Kingdom, but show no effect in a sample of countries. In addition to the fragility of the results obtained, this work presents several limits. From an econometric point of view, additional analyses could be carried out to ensure the relevance of the techniques employed. In that respect, the use of other proxies to approach the development of private pension funds would be interesting tests of robustness. In addition, the possible contribution of other available, such as the insurance life, could be specified from econometric relations. From an economic point of view, our study was limited to the observation of the behaviour of private consumption. An extension to other variables, the national saving ratio for example but also business investment, could bring complementary information.
REFERENCES
ANDO A. & MODIGLIANI F., (1963), « The life cycle hypothesis of saving : Aggregate implications and
tests », American Economic Review, 53, mars, pp.55-64.
ARTUS P., (1995), Macroéconomie, Economica, Paris.
ARTUS P.& MORIN P., (1991), Macroéconomie appliquée, PUF.
BANQUE MONDIALE, (1994), Averting The Old Age Crisis : Policies to Protect the Old and Promote
Growth, Oxford University Press.
BERNHEIM B.D. & SCHOLZ J.K., (1992), « Private Saving and Public Policy », N.B.E.R. Working Paper,
n°4215.
BLAKE D., (1992), Issues in Pension Funding, Londres : Routledge.
BLINDER A., GORDON R.H. & WISE D.E. (1983), « Social Security Bequests and the Life Cycle Theory of
Saving : A Cross-Sectionnal Tests », in Modigliani F. & alii, The Determinants of National Saving and Wealth, Londres : Macmillan Press.
BLOCH L. & MAUREL F., (1991), « Consommation-revenu permanent : un regard d’économètre », Economie
& Prévision, n°99.
BONNET X. & DUBOIS E., (1995), « Peut-on comprendre la hausse imprévue du taux d’épargne des ménages
depuis 1990 ? », Economie & Prévision, n°121.
CAGAN P., (1965), « The effects of pension plans on aggregate saving » - N.B.E.R. Occasional Paper, n° 95. CALLEN T. & C. THIMANN, (1997), « Empirical determinants of households saving : Evidence from OECD
countries », IMF, WP97/191, déc.
CAUSSAT L. , (1992), « Retraite et épargne, histoire d’un débat dans la littérature américaine », Revue
d’Economie Financière, n°23, pp.159-172.
CENTRAL STATISTICAL OFFICE, (CSO), Business Monitor, Insurance Companies and Pension Funds
COMMISSION EUROPEENNE, (1994), « Les régimes de retraite dans l’Union européenne, évolution,
tendances, problèmes à résoudre », Bruxelles : Commission Européenne.
DAVANZO L. & KAUTZ L.B., (1992), « Toward a Global Pension Market », The Journal of Portfolio
Management, Eté, pp.77-85.
DAVIS E.P., (1988), « Financial Market Activity of Life Insurance Companies and Pension Funds », Banque
des Réglements Internationaux, Economic Paper n°21.
DAVIS E.P, (1995), Pension Funds, Retirement-Income Security and Capital Markets : An international
Perspective, Clarendon Press Oxford.
DEMIRGÜC-KUNT A. & LEVINE R., (1996), « Stock Market development and Financial Intermediaries :
Stylized Facts », The World Bank Economic Review, vol. 10, n°2, pp.291-321.
DIAMOND P.A. & HAUSSMANN J.A., (1984), « Individual retirement and saving behavior », Journal of
Public Economics, vol. 23, pp. 81-114.
EL MEKKAOUI-de FREITAS N., (1998), Les comportements financiers des fonds de pension sur les marchés
internationaux de capitaux, Thèse de Doctorat, Université Paris-Dauphine.
FEDERAL RESERVE SYSTEM , Flow of Funds Accounts, Federal Reserve System, Washington D.C., 1997. FELDSTEIN M.S., (1974), « Social Security, Induced Retirement, and Aggregate Capital Accumulation »,
Journal of Political Economy, 82, n°3, Mai-Juin, pp.905-926.
FELDSTEIN M.S., (1978), « Do private pension increase national saving ? », Journal of Political Economy, 10,
Dec., pp.277-293.
FELDSTEIN M.S., (1982), « Social Security and Private Saving : Reply », Journal of Political Economy, 90,
fev-dec, pp.630-646.
FELDSTEIN M.S., (1996), « Social Security and Savings : New Time Series Evidence », National Tax Journal,
49, pp.151-164.
FISHER B. & REISEN (1994), « Pension Funds Investment From Ageing to Emerging Markets », OECD
Developement Center, Policy Brief, n°9.
FONDS MONETAIRE INTERNATIONAL, (1995), World Economic Outlook, Washington DC.,
International Monetary Funds.
HAMILTON J.D., (1994), Time Series Analysis, Princeton.
LAZEAR E. & MOORE R., (1988), « Pensions and Turnover » in Bodie Z., J. Shoven et D. Wise, Pensions in
the US Economy, University of Chicago Press.
MICHAUDON H. & PRIGENT C., (1998), « Présentation du modèle AMADEUS », Document de travail,
Direction des Etudes et Synthèses Economiques, Insee, n°G9801.
MUNNELL A., (1974), The effect of Social Security on Personal Saving, Cambridge.
MUNNELL A., (1976), « Private pensions and saving : New evidence », Journal of Political Economy, 84, oct.,
pp.1013-1032.
MUNNELL A. & YOHN F.O., (1992), « What is the impact of pensions on saving ? » in Pensions and the
Economy, Pensions Research Council & Universtity of Pennsylvania Press.
OCDE, The Macroeconomics of Ageing Pensions and Saving : A Survey, WP n°10, OCDE. OCDE, (1997), Institutional Investors : Statistical Yearbook, Paris : OCDE.
PHILLIPS AND DREW FUND MANAGEMENT LIMITED (PDFM), (1996), Pension Funds Indicators,
Londres : PDFM.
POTERBA J.M. , VENTI S. & WISE D., (1996), « How Retirement Saving Programs Increase Saving »,
Journal of Economics Perspectives, 10, pp.91-112.
REYNAUD E., (1994), « Les différentes logiques de financement des retraites en répartition », La Revue de
l’IRES, n°15, été, 125-141.
REISEN H. & WILLIAMSON J., (1994), « Pension Funds, Capital Controls, and Macroeconomic Stability »,
SHIEBER S.J. & SHOVEN J.B., (1994), « The consequences of Population Ageing on Private Pension Funds
and Saving Asset Markets », Working Paper, n°4665, NBER.
SKINNER J., (1991), « Individual Retirement Accounts : A review of the Evidence », NBER, WP n°3398, dec. VENTI S. & WISE D.A.,(1990), « Have IRAs Increased US Saving ? Evidence from Consumer Expenditive
Surveys », Quarterly Journal of Economics, août.
VILLETELLE J.P., (1998), L’influence des régimes de retraite sur l’épargne, note de lecture, Direction des
Etudes Economiques et de la Recherche, Banque de France, septembre.
APPENDIX 1 :
Table 1: Augmented Dickey-Fuller (ADF) unit root test
Variables United States United Kingdom C log -2.49 -3.25*** C log ∆ -4.35* -3.88** R log -1.92 -3.68** R log ∆ -4.18* -4.42* p log -1.39 -1.4 p log ∆ -2.39 -1.93 p log 2 ∆ -5.39* -4.77* Tcho -2.46 -1.82 tcho ∆ -4.55* -5.22* CAP -2.76*** -2.57 RR -1.77 -1.62 Reading : *:stationarity at 1%, ** : at 5%, ***: at 10% C : Household consumption
R : Purchasing power of households disposable income P : Consumption deflator
Tcho : Unemployement rate
CAP :Public administration financing capacity RR : Real interest rate
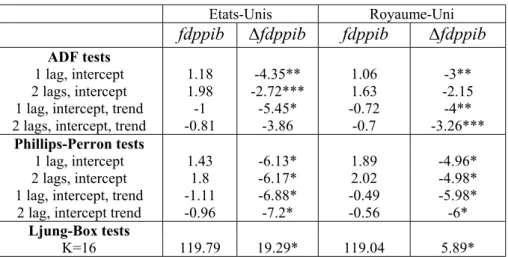
Table 2: Augmented Dickey-Fuller tests (ADF) and Phillips-Perron tests (PP) on the proxy
Etats-Unis Royaume-Uni
fdppib ∆fdppib fdppib ∆fdppib ADF tests
1 lag, intercept 1.18 -4.35** 1.06 -3** 2 lags, intercept 1.98 -2.72*** 1.63 -2.15 1 lag, intercept, trend -1 -5.45* -0.72 -4** 2 lags, intercept, trend -0.81 -3.86 -0.7 -3.26***
Phillips-Perron tests
1 lag, intercept 1.43 -6.13* 1.89 -4.96* 2 lags, intercept 1.8 -6.17* 2.02 -4.98* 1 lag, intercept, trend -1.11 -6.88* -0.49 -5.98* 2 lag, intercept trend -0.96 -7.2* -0.56 -6*
Ljung-Box tests
K=16 119.79 19.29* 119.04 5.89*
Reading :
ADF and PP tests * :stationarity at 1%, ** : at 5%, ***: at 10%. Ljung-Box tests :* :The assumption of white noise is accepted
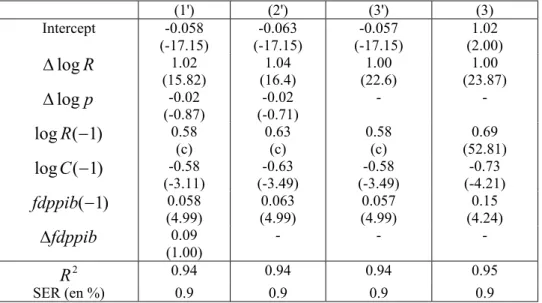
APPENDIX 2 :
Table 1 : Two steps estimation of the american consumption equation Variable explained : growth rate of consumption
Périod of estimation :1963-1994 (1') (2') (3') (3) Intercept -0.058 (-17.15) (-17.15) -0.063 (-17.15) -0.057 (2.00) 1.02 R log ∆ 1.02 (15.82) (16.4) 1.04 (22.6) 1.00 (23.87) 1.00 p log ∆ -0.02 (-0.87) (-0.71) -0.02 - - ) 1 ( logR − 0.58 (c) 0.63 (c) 0.58 (c) (52.81) 0.69 ) 1 ( logC − -0.58 (-3.11) (-3.49) -0.63 (-3.49) -0.58 (-4.21) -0.73 ) 1 (− fdppib 0.058 (4.99) (4.99) 0.063 (4.99) 0.057 (4.24) 0.15 fdppib ∆ 0.09 (1.00) - - - 2 R 0.94 0.94 0.94 0.95 SER (en %) 0.9 0.9 0.9 0.9
Reading: t statistics are provided in brackets, (c) means constraint
Table 2 : Two steps estimation of the british consumption equation Variable explained : growth rate of consumption
Périod of estimation :1964-1989 (1) (2) (3) Intercept 1.25 (4.43) (4.43) 1.47 (4.43) 1.47 R log ∆ 0.89 (12.73) (12.82) 0.91 (14.99) 0.93 p log ∆ -0.00 (-0.14) (0.48) 0.01 - ) 1 ( logR − 0.35 (32.25) (32.25) 0.41 (32.25) 0.41 ) 1 ( logC − -0.39 (-2.33) (-2.69) -0.47 (-2.73) -0.46 ) 1 (− fdppib 0.07 (5.22) (5.22) 0.08 (5.22) 0.09 fdppib ∆ 0.12 (1.86) - - 2 R 0.91 0.90 0.90 SER (en %) 1.1 1.1 1.1