HAL Id: hal-00918810
https://hal.inria.fr/hal-00918810
Submitted on 17 Dec 2013
HAL is a multi-disciplinary open access
archive for the deposit and dissemination of
sci-entific research documents, whether they are
pub-lished or not. The documents may come from
teaching and research institutions in France or
abroad, or from public or private research centers.
L’archive ouverte pluridisciplinaire HAL, est
destinée au dépôt et à la diffusion de documents
scientifiques de niveau recherche, publiés ou non,
émanant des établissements d’enseignement et de
recherche français ou étrangers, des laboratoires
publics ou privés.
A Fine-grained Approach for Power Consumption
Analysis and Prediction
Alessandro Ferreira Leite, Claude Tadonki, Christine Eisenbeis, Alba Cristina
M. A. de Melo
To cite this version:
Alessandro Ferreira Leite, Claude Tadonki, Christine Eisenbeis, Alba Cristina M. A. de Melo. A
Fine-grained Approach for Power Consumption Analysis and Prediction. [Research Report] RR-8416,
INRIA. 2013, pp.12. �hal-00918810�
ISSN 0249-6399 ISRN INRIA/RR--8416--FR+ENG
RESEARCH
REPORT
N° 8416
December 14, 2013 Project-Team ParallA Fine-grained Approach
for Power Consumption
Analysis and Prediction
RESEARCH CENTRE SACLAY – ÎLE-DE-FRANCE
1 rue Honoré d’Estienne d’Orves Bâtiment Alan Turing
Campus de l’École Polytechnique 91120 Palaiseau
A Fine-grained Approach for Power Consumption
Analysis and Prediction
A. Leite
∗, C. Tadonki
†, C. Eisenbeis
‡, A. de Melo
§Project-Team Parall
Research Report n° 8416 — December 14, 2013 — 9 pages
Abstract: Power consumption has became a critical concern in modern computing systems for various reasons including financial savings and environmental protection. With battery powered devices, we need to care about the available amount of energy since it is limited. For the case of supercomputers, as they imply a large aggregation of heavy CPU activities, we are exposed to a risk of overheating. As the design of current and future hardware is becoming more and more complex, energy prediction or estimation is as elusive as that of time performance. However, having a good prediction of power consumption is still an important request to the computer science community. Indeed, power consumption might become a common performance and cost metric in the near future. A good methodology for energy prediction could have a great impact on power-aware programming, compilation, or runtime monitoring. In this paper, we try to understand from measurements where and how power is consumed at the level of a computing node. We focus on a set of basic programming instructions, more precisely those related to CPU and memory. We propose an analytical prediction model based on the hypothesis that each basic instruction has an average energy cost that can be estimated on a given architecture through a series of micro-benchmarks. The considered energy cost per operation includes all of the overhead due to context of the loop where it is executed. Using these precalculated values, we derive an linear extrapolation model to predict the energy of a given algorithm expressed by means of atomic instructions. We then use three selected applications to check the accuracy of our prediction method by comparing our estimations with the corresponding measurements obtained using a multimeter. We show a 9.48% energy prediction on sorting.
Key-words: power consumption, energy, multimeter, prediction, profiling
∗Universit´e Paris-Sud / University of Brasilia (France / Brazil), [email protected] †MINES ParisTech / CRI (France), [email protected]
‡INRIA Saclay / Universit´e Paris-Sud (France), [email protected] §University of Brasilia (Brazil), [email protected]
A Fine-grained Approach for Power Consumption Analysis and Prediction
R´esum´e : Ce travail concerne la pr´ediction de la consommation ´energetique d’un programme `a partir d’un d´ecompte des diff´erentes instructions ´el´ementaires du code source. Nous nous int´eressons principalement aux nids de boucles et `a une classe d’instructions assez repr´esentative de celles les plus utilis´ees habituellement.
A Fine-grained Approach for Power Consumption Analysis and Prediction 3
I. INTRODUCTION
While keep striving to provide faster computers, hard-ware designers have to contend with power and heat constraints [1]. For decades, computers got faster by increasing the speed of the central processing unit, now commonly made up with several cores. However, high processor frequency means higher heat potential. This concern is central when it come to supercomputers [2], [3], for which we have a large aggregation of heavy CPU activities, thus a genuine risk of overheating. The cost associated to the required energy, also for cooling, can become financially prohibitive for larger systems. Beyond petascale, the way to exascale is marked by energy concerns, and power consumption is becoming a metric. A clear illustration of the fact that energy has come to the spotlight is the so-called Green500 project, which aims at providing a yearly ranking of the most energy-efficient supercomputers in the world.
For embedded systems or portable devices, which are battery powered, energy is obviously critical since avai-lable on a limited basis. The pervasiveness of portable devices will magnify and exacerbate this issue.
Cloud computing is another area where energy is
an important concern. Indeed, computing and storage devices are continuously requested by different users. Such intensive use of resources implies a significant power consumption at various levels. One way to address the problem is through the concept of federated clouds, where different clouds are virtually merged in order to provide a flexible system to end users. Based on this con-figuration, we need to find the less (energy/time) costly scheduling from both users and providers standpoints.
Fig. 1. Cloud computing illustration
Based on Ohm’s Law [4], the dissipated power is approximately proportional to the square of the CPU voltage and the CPU frequency, which gives
P = CV2
f, (1)
where C is capacitance, V is voltage, and f is frequency [5]. It is important to note that those parameters can be changed dynamically at runtime [6], which offers an opportunity for energy-aware scheduling. Network and memory activities also count, but the most common focus is on the pure CPU side.
Energy reduction is an important research topic, which is being investigated at all levels of system abstraction, from the physical layout to software design. There have been several contributions on energy saving focused on scheduling/processors [3], [6], [7], [8], [9], data organizations [10], [11], compilation [12], [13], [14], and the algorithmic level [15], [16], [6]. Power management in sensors network, where energy is really critical, is addressed in [17]. The research at the architecture level has led to new and advanced low energy architectures. Current and future generation processors have their clock frequency that can be dynamically modified, and some of them are equipped with a sensor to measure the temperature. In addition, the upper threshold temperature beyond which the fan is automatically triggered can be dynamically adjusted too. However, all these features need to be skillfully monitored. This could be done statically at compile time, or dynamically at runtime.
In order to guide the design of energy efficient pro-grams or power aware schedulers, it is important to have a clear methodology for power consumption modeling and estimation. In [18], an analytical model, based on a mathematical programming formulation, is provided for energy optimization related to fully featured SDRAM. In this work, we consider the problem at source code level. Our hypothesis is that, although the correlation between hardware mechanisms, the energy cost of each basic CPU operation can be estimated and used as a parameter for a macroscopic prediction. The main advantage is that, from an inventory of the basic operations contained in a given source code, its power consumption can be estimated by a linear approximation. We measure the energy directly from the electricity entry of the computer using a commercial multi meter, which is more general than focusing only on information related to the CPU.
The rest of the paper is organized as follows. The next section provided an overview of the related work. Our energy measurement methodology is explained in section III, and data are provided for a given machine. In section IV, we present our prediction model, followed in section V by an experimental validation. Section VI provides potential perspectives for this work, and section VII concludes the paper.
II. RELATEDWORK
There are many techniques in the literature that aim to improve the energy efficiency of computing resources. Most of them are based on Dynamic Voltage and Fre-quency Scaling (DVFS) [19], [20], [21]. DVFS tech-niques assume that applications dominated by memory accesses or involving heavy I/O activities can be ex-ecuted at lower CPU frequency with only a marginal impact on their execution time. In this case, the goal of a DVFS scheduler is to identify each execution phase of
A Fine-grained Approach for Power Consumption Analysis and Prediction 4
an application, quantify its workload characteristics, and then switch the CPU frequency to the most appropriate power/performance mode. There are also some works [22], [23], [24], [25] that consider the temperature of the computing node to make schedule decisions based on the amount of energy that is sufficient to consider decreasing the temperature. Moreover, number of researches explore software optimization at compiling level [26], [27], [28] in order to both improve performance and reduce energy. In [19], DVFS decisions are based on memory work-load prediction in order to avoid loss of performance. Experimental results on the NAS parallel benchmark and codes with large amounts of data communications and memory accesses show that the proposed approach can
save20% of energy with 4% of performance loss.
In [20], the power consumption of a chemistry appli-cation is studied in order to investigate potential energy savings and performance losses when using DVFS tech-nique, mainly relying on CPU stall cycles caused by memory accesses and I/O operations. Experiments show that even when the CPU activity is high, e.g. frequently computing integrals, it is more energy efficient than computing the integrals at the beginning and store them on disk for subsequent reuses.
In [24], a DVFS and temperature aware load balancing technique is presented to constrain core temperatures. The approach lets each core working at the maximum available frequency until a temperature threshold is reached. Experiments in a cluster with dedicated air
conditioning unit show that a cooling saving of57% can
be achieved with20% of timing penalty.
In [25], two energy-conscious task consolidation heuristics (ECTC and MaxUtil) are used to maximize resource utilization for power saving. The cost of the ECTC heuristics is computed considering the energy consumption to run a group of parallel tasks. The MaxUtil heuristic tries to increase the consolidation den-sity. Simulation results show that the proposed heuris-tics can lead to an energy saving of 18%(ECTC) and 13%(MaxUtil).
In [27], coarse-grained compiler optimization strate-gies are applied in order to minimize the energy con-sumption. First the registers are renamed in order to re-duce output dependencies. Then, the instruction that min-imizes the inter-instruction cost is selected for schedul-ing. The results show that the proposed optimization
strategies can cut power consumption by 9%, leading
to4.54% saving on the total energy dissipation.
A distributed compiler approach is presented in [28]. The idea is to use distributed compilers to apply code transformations or highlighting parts of the source code that could not be optimized. The energy minimization is based on the number of cycles that is required to execute
a given application. The results show a reduction of40%
in the number of cycles only employing some compiler optimization techniques.
Dabbagh et al. [29] propose a methodology to estimate the energy of operations that can be implemented in hardware. Considering the backpropagation algorithm, the proposed approach was able to estimate the energy
consumption with an error rate of5.44%.
In [30], a methodology for measuring the energy efficiency of an application is presented. The aim is to analyze the impact of the application design on its energy efficiency and the environment where the application is developed. The results show that the software abstraction design and the use of some frameworks and libraries must be considered when the goal is to minimize energy, especially for large applications. In other words, in many cases, the use of external frameworks and libraries incurs a high cost in terms of energy consumption.
The closest work to ours are [29] and [30]. Each of these works use the source code to estimate the energy consumption. Our work differs from these approaches in the following ways. First, we argue that the memory and I/O workload must be seriously considered to estimate the energy consumption of an application. Second, we in-cluded other kernel operations such as memory accesses (read, write and allocation), register comparison, and I/O and the effect of the CPU frequency in the execution of these operations. Tracking the energy cost per basic instruction, we end up with an analytical model to predict the energy performance of a given source code.
III. ENERGYMEASUREMENT
Our goal in this section is to validate our hypothesis that each basic CPU operation consumes a fixed amount of energy that can be calculated for a given architec-ture. The machine we have considered is an Intel(R) Core(TM) 2 Quad CPU Q6600, 2.40GHz with 4 GB of RAM running Fedora Linux (kernel version 3.9.8). The power and energy consumption of the machine is measured using the WattsUp power meter [31] with a
sampling rate of 1Hz. This approach of performing
measurements directly at the electrical level is expected to cover all sources of power consumption compared to methods that are based on data provided by the thermal sensor of the CPU. Due to the low measuring resolution of the multi meter (slot of 1 second), a large number of executions are needed in order obtain meaningful measurements. In addition, since the raw data provided by the power meter are the distribution of the
electri-cal power over the time, we obtain the corresponding
energy by just summing up those data. This summation corresponds to the discretization of the required integral
A Fine-grained Approach for Power Consumption Analysis and Prediction 5
of the power over the targeted time interval.
E(t0, t1) = ∫ t1 t0 P (t)dt ≈ t1 ∑ t=t0 P (t)∆t ≈ n ∑ t=0 P (t0+k), (2)
where n is the largest integer such that t0+ n ≤ t1.
We consider ∆t = 1 because, as previously explained,
the WattsUp power meter works by slots of 1 second. In order to capture possible fluctuations when estimating the energy, we perform several measurements (typically 10) and we take the average value.
We evaluate nine basic instructions{addition,
multi-plication, division, memory read, memory write, memory copy, print, comparison, malloc} in order to estimate their energy consumption under different CPU frequen-cies. For each of them, we apply the aforementioned method to estimate the associated power consumption. The following code is for the addition case, we use a similar code for other basic measurements.
void floating_point_addition() { register float s; int i,n; start_energy_counters(); for(n = 0; n < NB_REPEAT; n ++) { s = 0.25;
for (i = 0; i < LENGTH; i++) s += 0.3141516;
}
get_consumed_energy(); }
The outer loop is there just to magnify the compu-ting load (by NB_REPEAT times). Having a total of NB_REPEAT×LENGTH operations offer a more flexible way to sufficiently increase the computing time, other-wise we could stand below one second, means less than what the multi meter can really measure. In any case, the total energy is divided by NB_REPEAT×LENGTH to get the cost for a single operation.
For the case of memory reads and writes, we use inline assembly instructions in order to make sure the load (resp. store) instructions are really executed. We will come back later on this particular case regarding the impact of the level of cache. Taking into account the CPU frequency, our profiling is performed following the model described by Algorithm 1. It is important to note here that we compile our code without any optimization. Table I provides the results of energy consumption for a single addition (the overall energy is divided by the total number of additions performed). We display the measurement for each of the 10 executions. The goal is to give a picture of the variations, which we expected to be very slight. Indeed, it is, like with other basic
put the machine in the idle state;
foreach available CPU frequencyf do
set the frequency of the CPU’s core tof ;
foreach benchmarkb do
fori = 1 to 10 do
executeb;
end
consolidate the data of b;
end
sleep 5 seconds;
consolidate the data for frequencyf ;
end
Algorithm 1: Generic energy profiling algorithm
operations as the whole set of measurements will reveal.
N Time (s) Power (W ) Energy (nJ )
1 28.24 97.01 273 2 28.23 97.09 274 3 28.24 97.24 274 4 28.23 97.28 274 5 28.23 97.48 275 6 28.23 97.06 273 7 28.23 96.92 273 8 28.23 96.88 273 9 28.23 97.12 274 10 28.23 97.05 273 TABLE I
EXECUTION TIME,AVERAGE POWER CONSUMPTION AND ENERGY FOR THE ADDITION OPERATION ATCPUFREQUENCY OF1.6 GHZ.
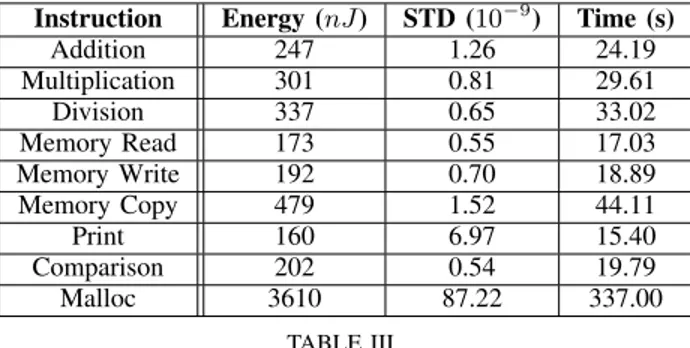
Tables [II-V] show the results of our energy measure-ments related to the selected set of basic instructions, using four different values for the CPU frequency (1.6 Ghz, 1.8 Ghz, 2.13 Ghz, and 2.4 Ghz). For each mea-surement, we first obtain a set of values similar to Table I, then we calculate the mean and the standard deviation. For memory operations (read, write, copy, and malloc), the energy provided is per MB (read, written, copied, or allocated). Figure Fig. 2 depicts an aggregated view of our measurements.
Instruction Energy (nJ ) STD (10−9) Time (s)
Addition 274 0.50 28.23 Multiplication 334 0.64 34.54 Division 372 0.55 38.53 Memory Read 191 0.42 19.88 Memory Write 207 0.58 21.52 Memory Copy 525 1.85 51.69 Print 172 5.14 17.60 Comparison 221 0.46 23.11 Malloc 3882 8.53 389.23 TABLE II
ENERGY CONSUMPTION AND EXECUTION TIME FOR EACH INSTRUCTION ANDCPUFREQUENCY OF1.6 GHZ. RR n° 8416
A Fine-grained Approach for Power Consumption Analysis and Prediction 6
Instruction Energy (nJ ) STD (10−9) Time (s)
Addition 247 1.26 24.19 Multiplication 301 0.81 29.61 Division 337 0.65 33.02 Memory Read 173 0.55 17.03 Memory Write 192 0.70 18.89 Memory Copy 479 1.52 44.11 Print 160 6.97 15.40 Comparison 202 0.54 19.79 Malloc 3610 87.22 337.00 TABLE III
ENERGY CONSUMPTION AND EXECUTION TIME FOR EACH INSTRUCTION ANDCPUFREQUENCY OF1.8 GHZ.
Instruction Energy (nJ ) STD (10−9) Time (s)
Addition 227 2.01 21.17 Multiplication 297 64.00 27.82 Division 308 1.54 28.89 Memory Read 158 1.07 14.91 Memory Write 176 1.48 16.55 Memory Copy 443 3.13 38.64 Print 142 1.22 13.00 Comparison 184 1.43 17.30 Malloc 3304 18.22 292.19 TABLE IV
ENERGY CONSUMPTION AND EXECUTION TIME FOR EACH INSTRUCTION ANDCPUFREQUENCY OF2.13 GHZ.
Instruction Energy (nJ ) STD (10−9) Time (s)
Addition 209 2.38 18.81 Multiplication 254 2.01 23.01 Division 285 1.41 25.68 Memory Read 146 1.45 13.25 Memory Write 164 1.41 14.83 Memory Copy 415 4.60 34.36 Print 132 5.68 11.60 Comparison 171 1.56 15.40 Malloc 3075 31.47 259.67 TABLE V
ENERGY CONSUMPTION AND EXECUTION TIME FOR EACH INSTRUCTION ANDCPUFREQUENCY OF2.4 GHZ.
Fig. 2. Atomic power consumption of basis operations
Let make some important observations:
• our hypothesis is general, but the energy per basic
instruction is of course machine dependent. The corresponding values should be seen as energy parameters useful for any macroscopic estimation.
• for arithmetic operations, our measurements
some-how follow the intuition. Indeed, the more the operation is complex from the hardware point of view, the more it consumes energy.
• the previous observations seems to be also true for
memory accesses (read and write). For memory copy, we use the memcpy() routine. We see that the result is slightly larger than read + write, which makes sense since copying a memory location nec-essary involves reading and writing.
• printing seems to consume less energy than any
other operation from our selected subset. This also makes sense as the CPU is not really involved.
• memory allocation is the most energy consuming.
However, the fact that it is done once before using the corresponding memory space will impact less energy in practice for time consuming programs.
• the energy is lower with higher CPU frequencies,
probably due to the reduction of the execution time. However, in case of time consuming processing, keeping the CPU at high frequency will incur a higher energy for cooling, which we do not count in this work. Because of the energy for cooling, since the energy variation related to CPU frequency is marginal, switching to lower CPU frequencies on memory and I/O operations should be globally rewarding over a long period of processing time.
IV. PREDICTION MODEL
For a given source code for which we could get an inventory of basic instructions, our prediction of the energy is given by E(f ) = p ∑ i=1 Niei(f ) + Ecooling(f, tmax), (3)
whereei(f ) is the energy of the corresponding atomic
operation at frequency f as previously calculated, and
Ni is the number of such instructions. These numbers
can be obtained either from a profiling, a code anal-ysis framework [32], or a complexity estimation. For a more rigorous estimation, one could proceed with the corresponding assembly code. The second term, Ecooling(f, tmax) is the energy for cooling, which
de-pends on
• how CPU temperature changes during the execution
(this depends on the code and the CPU frequency)
A Fine-grained Approach for Power Consumption Analysis and Prediction 7
• the temperature threshold (tmax) beyond which the
cooling system is activated, typically the fan for standard machines.
We do not consider the second term in this paper. We keep it, together with the corresponding study, in our list of perspectives. We think this concern is more relevant for programs with longer execution times.
The linear model defined by (3) could be refined by taking into account the following considerations
• the use of fuse multiply-add instructions, which may
correlate the energy for additions and multiplica-tions
• the level of cache where we read or write data, as
this has a significant impact on the execution time, thus on the overall energy
• the effect of instructions pipeline, which clearly
stands against an additive energy consumption model
The last two aspect are quite elusive, and could be addressed with rough estimations, unless a more rigorous analysis is made possible by the availability of key hardware and system information.
V. VALIDATION AND TECHNICAL DISCUSSION
In this section, we consider three case studies to illustrate and validate our power estimation approach. For each application, the number of basic operations is obtained from a direct complexity analysis of the corresponding algorithm. The reader should keep this in mind when reading the formulas provided for energy
estimation. We denote by ea(f ), em(f ), ed(f ), ec(f ),
el(f ), and es(f ), the energy consumed at CPU frequency
f for a single addition, multiplication, division, com-parison, load, and store respectively. We recall that the corresponding values are provided in Tables II, III, IV, and V.
A. Selection sort
for (i = 0; i < n; i++) do i min = i;
for (j = i + 1; j < n; j++) do if(u[j] < u[i min]) i min = j; end
x = v[i]; v[i] = v[i min]; v[i min] = x; end
Algorithm 2: Main loop of the selection sort Following our model and the complexity of Algorithm 2 (as it is written), we can estimate the energy as
Esort(f ) =
n(n + 1)
2 (ec(f ) + 2el(f )) + 2nes(f ). (4)
Depending on the relative order of the values in the array to be sorted, the cost of the last step, where we swap
two components, will depend on how distant arei and
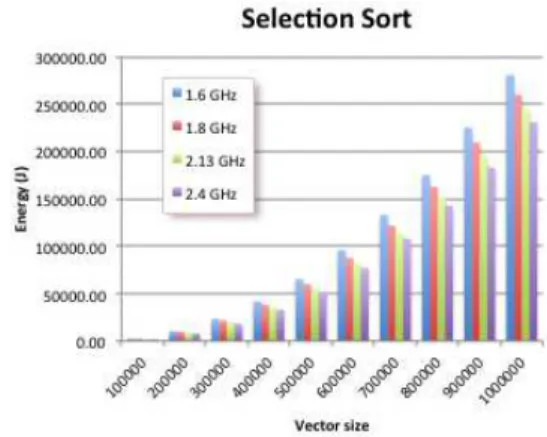
i min. Figure Fig. 3 displays the energy performances of the selection sort implemented from Algorithm 2.
Fig. 3. Measured power consumption of the selection sort
Table VI provides both our predictions and the mea-surements for the selection sort on arrays of various sizes
(N×105
), at different CPU frequencies.
N 1.6 Ghz 1.8 Ghz 2.13 Ghz 2.4 Ghz 1 3.0 2.6 2.7 2.4 2.5 2.2 2.3 2.0 2 12 10 11 9.6 10 8.9 9.3 8.1 3 27 23 25 22 22 20 21 18 4 48 42 44 38 40 35 37 33 5 75 65 68 60 62 55 58 52 6 108 96 97 87 90 82 83 77 7 148 133 134 122 122 113 113 108 8 193 175 175 163 160 151 148 143 9 244 225 222 209 202 195 187 183 10 301 281 274 260 250 244 231 231 TABLE VI
ENERGY PREDICTIONS VS PERFORMANCES(KJOULES)FOR THE SELECTION SORT ALGORITHM
The average relative error is 9.48%, which is quite
good, especially for sorting as the effective number of memory moves depends on the values of the array to be sorted. The impact of swapping is also values dependent. B. Weighted means s = 0; for (i = 0; i < n; i++) do s = s + w[i] ∗ v[i]; u[i] = s/(i + 1); end
Algorithm 3: Main loop of the weighted means The energy of Algorithm 3 (as it is written), can be
A Fine-grained Approach for Power Consumption Analysis and Prediction 8
estimated by
Emean(f ) = n(2ea(f )+em(f )+ed(f )+2el(f )+es(f )),
(5)
Fig. 4. Measured power consumption of the weighted means
N×105 1.6 Ghz 1.8 Ghz 2.13 Ghz 2.4 Ghz 1 1.8 1.9 1.7 1.8 1.6 1.6 1.4 1.5 2 3.7 4.1 3.3 3.8 3.1 3.6 2.8 3.3 3 5.5 6.5 5.0 5.9 4.7 5.6 4.2 5.2 4 7.4 8.5 6.7 8.0 6.2 7.5 5.7 7.0 5 9.2 10 8.4 10 7.8 9.4 7.1 8.8 6 11 13 10 12 9.3 11 8.5 11 7 13 15 12 14 11 13 9.9 12 8 15 17 14 16 13 15 11 14 9 17 19 15 18 14 17 13 16 10 19 21 17 20 16 19 14 18 TABLE VII
ENERGY PREDICTIONS VS PERFORMANCES(KJOULES)FOR THE WEIGHTED MEANS CALCULATION
The average relative error is 18.36%. We think that
instructions pipeline really applies here. However, we could reach 5.75% in some cases.
C. Scalar product
s = 0;
for (i = 0; i < n; i++) do s = s + u[i] ∗ v[i]; end
Algorithm 4: Main loop of the scalar product
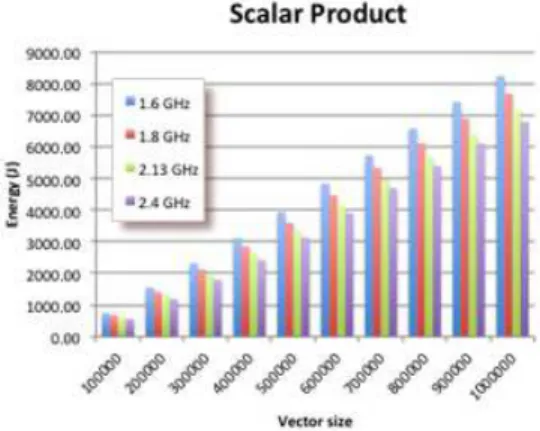
The energy of Algorithm 4 can be estimated by Escalar(f ) = n(ea(f ) + em(f ) + 2el(f )), (6)
Fig. 5. Measured power consumption of the scalar product
N×105 1.6 Ghz 1.8 Ghz 2.13 Ghz 2.4 Ghz 1 1.0 0.8 0.9 0.7 0.8 0.6 0.8 0.6 2 2.0 1.6 1.8 1.4 1.7 1.3 1.5 1.2 3 3.0 2.3 2.7 2.1 2.5 2.0 2.3 1.8 4 4.0 3.1 3.6 2.8 3.4 2.6 3.0 2.4 5 5.0 3.9 4.5 3.6 4.2 3.3 3.8 3.1 6 5.9 4.8 5.4 4.5 5.0 4.1 4.5 3.9 7 6.9 5.7 6.3 5.3 5.9 5.0 5.3 4.7 8 7.9 6.6 7.2 6.1 6.7 5.7 6.0 5.4 9 8.9 7.4 8.0 6.9 7.6 6.4 6.8 6.1 10 9.9 8.2 8.9 7.7 8.4 7.2 7.6 6.8 TABLE VIII
ENERGY PREDICTIONS VS PERFORMANCES(KJOULES)FOR THE SCALAR PRODUCTS CALCULATION
The average relative error is 18.18%. The same
ob-servation as for weighted means calculation holds. The relative erros here range from 10.05% to 24.11%.
VI. DISCUSSIONS AND PERSPECTIVES
As we have previously mentioned, our energy pre-diction can be refined by investigating on other energy consuming aspects as well as on the hardware corre-lation between some pairs of instructions. The case of
fuse multiply-add should be investigated following the
methodology considered in this paper. The gap observed with the scalar product and the weighted means might be due to such transformation by the compiler. Network activities and disk accesses should be studied to, thus leading to an extension of our model to larger computing systems like the Cloud or supercomputers.
A more deeper but very important investigation could address the energy coming from CPU cooling. This requires to be able to model the variation of the CPU temperature during the execution of a given program, and also the electrical power used for cooling.
VII. CONCLUSION
Modern computing devices are provided to deliver very fast processing capabilities. Either because of the
A Fine-grained Approach for Power Consumption Analysis and Prediction 9
limited amount of energy available for mobile devices and embedded systems, or because of the cost (finan-cial and environmental) of the energy related to larger systems, we need to have a good control on power consumption. Among possible approaches, quantitative modeling of energy prediction is particularly attractive, as it could be used for power aware programming or compilation. The approach proposed in this paper is one way to derive such a model and we think, either by construction or from the satisfactory validation results, that it deserves a close attention.
ACKNOWLEDGMENT
The authors would like to thank CAPES/Brazil, CNPq/Brazil, INRIA/France, and the french ministry of foreign affairs through the STIC-AmSud program (BioCloud project), for their financial support.
REFERENCES
[1] C. Tadonki, “High performance computing as a combination of machines and methods and programming,” in HDR book, University Paris-Sud Orsay, France, may 2013.
[2] C.-h. Hsu and W.-c. Feng, “A power-aware run-time system for high-performance computing,” in ACM/IEEE conference on Supercomputing (SC ’05), Seattle, November 12-18, 2005. [3] K. Cameron and al., “High-performance, power-aware distributed
computing for scientific applications,” in Computer, vol. 38(11), 2005, pp. 40–47.
[4] “Get connected with ohm’s law,” in
http://www.tryengineering.org/lessons/ ohmslaw.pdf.
[5] “Enhanced intel speedstep technology for the intel pentium processor,” in
ftp://download.intel.com/design/network/ papers/30117401.pdf, march 2004.
[6] X. Fan, C. Ellis, and A. Lebeck, “The synergy between power-aware memory systems and processor voltage scaling,” in Proc. 3rd Int’l Workshop Power-Aware Computing Systems, LNCS 3164, Springer-Verlag, 2003, pp. 164–179.
[7] D. Brooks and M. Martonosi, “Dynamically exploiting narrow width operands to improve processor power and performance,” in In Proc. Fifth Intl. Symp. High-Perf. Computer Architecture, Orlando, January 1999.
[8] V. Tiwari, S. Malik, A. Wolfe, and T. C. Lee, “Instruction level power analysis and optimization of software,” in Journal of VLSI Signal Processing Systems, vol. 13(2), August 1996.
[9] M. C. Toburen, T. M. Conte, and M. Reilly, “Instruction schedul-ing for low power dissipation in high performance processors,” in In Proc. the Power Driven Micro-Architecture Workshop in conjunction with ISCA’98, June 1998.
[10] W. Ye, N. Vijaykrishnan, M. Kandemir, and M. J. Irwin, “The design and use of simplepower: a cycle-accurate energy estima-tion tool,” in In Proc. Design. Automaestima-tion Conference (DAC), Los Angeles, June 5-9, 2000.
[11] F. Catthoor, S. Wuytack, E. Greef, F. Balasa, L. Nachtergaele, and A. Vandecappelle, “Custom memory management methodology - exploration of memory organization for embedded multimedia system design,” in Kluwer Academic Pub., June 1998. [12] W. Tang, A. V. Veidenbaum, and R. Gupta, “Architectural
adap-tation for power and performance,” in International Conference on ASIC, 2001.
[13] L. Bebini and G. De Micheli, “System-level optimization: Tech-niques and tools,” in ACM Transaction on Design Automation of Electronic Systems, 2000.
[14] T. Okuma, T. Ishihara, and H. Yasuura, “Software energy reduc-tion techniques for variable-voltage processors,” in IEEE Design and Test of Computers, 2001.
[15] M. Singh and V. K. Prasanna, “Algorithmic techniques for mem-ory energy reduction,” in Worshop on Experimental Algorithms. [16] S. Sen and S. Chatterjee, “Towards a theory of cache-efficient
algorithms,” in SODA, 2000.
[17] C. Tadonki and J. Rolim, “An integer programming heuristic for the dual power management problem in wireless sensor networks,” in 2nd International Workshop on Managing Ubiqui-tous Communications and Services, MUCS2004, Dublin, Ireland, December 13, 2004.
[18] ——, “An analytical model for energy minimization,” in III Workshop on Efficient and Experimental Algorithms, vol. DOI: 10.1007/978-3-540-24838-5 41, 2004, pp. 59–69.
[19] R. Ge, X. Feng, W.-c. Feng, and K. W. Cameron, “Cpu miser: A performance-directed, run-time system for power-aware clusters,” in International Conference on Parallel Processing, 2007, pp. 18–26.
[20] V. Sundriyal, M. Sosonkina, F. Liu, and M. W. Schmidt, “Dy-namic frequency scaling and energy saving in quantum chemistry applications,” in IEEE International Symposium on Parallel and Distributed Processing Workshops and PhD Forum, 2011, pp. 837–845.
[21] V. Hanumaiah and S. Vrudhula, “Energy-efficient operation of multi-core processors by dvfs, task migration and active cooling,” IEEE Transactions on Computers, vol. 99, 2012.
[22] D. Borgetto, H. Casanova, G. Da Costa, and J.-M. Pierson, “Energy-aware service allocation,” Future Generation Computer Systems, vol. 28, no. 5, pp. 769–779, May 2012.
[23] Z. Zhang and J. M. Chang, “A cool scheduler for multi-core systems exploiting program phases,” IEEE Transactions on Com-puters, vol. 99, 2012.
[24] O. Sarood and L. V. Kale, “A ’cool’ load balancer for parallel applications,” in International Conference for High Performance Computing, Networking, Storage and Analysis, 2011, pp. 21:1– 21:11.
[25] Y. C. Lee and A. Y. Zomaya, “Energy efficient utilization of resources in cloud computing systems,” The Journal of Super-computing, pp. 1–13, 2010.
[26] D. Brooks, V. Tiwari, and M. Martonosi, “Wattch: a framework for architectural-level power analysis and optimizations,” in Inter-national Symposium on Computer architecture, 2000, pp. 83–94. [27] G. Sinevriotis and T. Stouraitis, “A novel list-scheduling algo-rithm for the low-energy program execution,” in IEEE Interna-tional Symposium on Circuits and Systems, vol. 4, 2002, pp. IV– 97–IV–100.
[28] F. Fakhar, B. Javed, R. ur Rasool, O. Malik, and K. Zulfiqar, “Software level green computing for large scale systems,” Journal of Cloud Computing, vol. 1, no. 1, pp. 1–17, 2012.
[29] M. Dabbagh, H. Hajj, and H. Hajj, “An approach to measuring kernel energy in software applications,” in International Confer-ence on Energy Aware Computing, 2011, pp. 1–6.
[30] E. Capra, C. Francalanci, and S. A. Slaughter, “Is software ”green”? application development environments and energy ef-ficiency in open source applications,” Information and Software Technology, vol. 54, no. 1, pp. 60–71, Jan 2012.
[31] in https://www.wattsupmeters.com.
[32] M. Amini, C. Ancourt, F. Coelho, F. Irigoin, P. Jouvelot, R. Keryell, P. Villalon, B. Creusillet, and S. Guelton, “Pips is not (just) polyhedral software,” in 1st International Work-shop on Polyhedral Compilation Techniques (IMPACT 2011) in conjunction with CGO 2011, 2011, pp. IV–97–IV–100, http://pips4u.org/ .
RESEARCH CENTRE SACLAY – ÎLE-DE-FRANCE
1 rue Honoré d’Estienne d’Orves Bâtiment Alan Turing
Campus de l’École Polytechnique 91120 Palaiseau
Publisher Inria
Domaine de Voluceau - Rocquencourt BP 105 - 78153 Le Chesnay Cedex inria.fr