HAL Id: hal-01008881
https://hal.archives-ouvertes.fr/hal-01008881
Submitted on 14 May 2018HAL is a multi-disciplinary open access
archive for the deposit and dissemination of sci-entific research documents, whether they are pub-lished or not. The documents may come from teaching and research institutions in France or abroad, or from public or private research centers.
L’archive ouverte pluridisciplinaire HAL, est destinée au dépôt et à la diffusion de documents scientifiques de niveau recherche, publiés ou non, émanant des établissements d’enseignement et de recherche français ou étrangers, des laboratoires publics ou privés.
Sensitivity and uncertainty studies for the modelling of
marine growth effect on offshore structures loading
Franck Schoefs
To cite this version:
Franck Schoefs. Sensitivity and uncertainty studies for the modelling of marine growth effect on offshore structures loading. ASME 2002 21st International Conference on Offshore Mechanics and Arctic Engineering (OMAE’02), 2002, Oslo, Norway. pp.275-281, �10.1115/OMAE2002-28385�. �hal-01008881�
SENSITIVITY AND UNCERTAINTY STUDIES FOR THE MODELLING
OF MARINEGROWTH EFFECT ON OFFSHORE STRUCTURES LOADING
Schoefs FranckCivil Engineering Laboratory of Nantes - St Nazaire 2 rue de la Houssinière
F - 44322 NANTES (France) Tel : +33 (0) 2 51 12 55 22
E-mail : [email protected]
ABSTRACT
Structural response to extreme events or fatigue loadings and structural integrity are major criteria to be quantified in a rational process of reassessment. It is now well established that the probabilistic mechanics approach gives an efficient means for measuring the relative changing in safety level compared to a predefined requirement.
To this aim, effects of marine growth have been largely studied during the last two decades. This natural process of structural colonization is particularly hard to embrace because it leads to various consequences as over-loading effect coming from screen and drag effects, bio-chemical attacks of materials and mask effects for inspections methods. Only effects on loading are studied here.
These effects are particularly hard to quantify because of the bio-variety of marine growth, season conditioning, natural cleaning or death of species, severe competition leading to replacement of some species and of course local hydrodynamic conditions. As in situ data collection through inspections is hard to practice and very expensive, lot of works propose experiments respecting scale effects and numerical modelling. Both are needed to perform uncertainty and sensitivity analyses.
This paper proposes a numerical analysis of marine growth effects based on Response Surface Methodology. This method is here suggested to provide explicit approximations of load variables acting on offshore structures submitted to extreme events or fatigue loading as Jacket platforms. Then, from a sensitivity analysis, main factors conditioning load effects are pointed out. From a physical analysis of hydrodynamics parameters affecting these dominant variables, their probabilistic modelling is then suggested using available published experiments for several probabilistic characteristics.
INTRODUCTION
The proposed paper takes place in the actual challenge for the reassessment of existing offshore structures where some uncertainties are to be controlled on the basis of inspection reports analysis. When studying the mechanical behaviour of structures placed in severe environmental conditions as offshore platforms, the structural reliability analysis offers, after decades of developments, a set of robust tools and methods. It leads to state the importance of uncertainty and sensitivity analysis especially in view to characterise the stochastic structure of the loading acting on the platforms. One must consider the intrinsic randomness of waves and the modelling uncertainty of the fluid-structure interaction in their relative contribution to the response i.e. the load on the structure. Particularly, there is a need for taking into account the natural cluster of organisms i.e. the marine growth fouling (kelps, mussel beds ...) versus a probabilistic modelling. In fact, this settlement of the structure includes the major uncertainty source in term of diameter increment and hydrodynamic coefficients level. Its corresponding uncertainty evolves upon several factors (seasons, depth, ... ) and during the life of the structures and is greater at the design step when no inspection reports are available. As for steel fixed offshore structures like Jacket or Jack-up platforms, the hydrodynamic overloading caused by marine growth is major in terms of percentage on each component and consequently on their summation for the external global loading assessment, only effects on cylinders with small diameter compare to wave length are considered here.
Because of the cost of under-water inspections, it is not realistic to research a complete description of the marine growth during the life of the structure and to require a cleaning
program based on this complete knowledge. In fact, database are very poor, and assumption are to be specified on the based of rational criteria.
The proposed paper reviews the actual practice of modelling for marine growth effects on extreme events or fatigue loadings. The most important categories of marine growth with their influence on the fluid-structure interaction are presented in the case of North sea to embrace the main challenge of their modelling. In a second time, probabilistic modelling assumptions are analysed in their relative influence on the load response modelled through the Response Surface Methodology. It leads to purpose the information level on marine growth, which is needed. In this future, the Response Surface Methodology comes to be a versatile approach to perform sensitivity studies through Monte Carlo simulations or differential analysis.
For the illustration, the site of the North Sea is selected. Data are taken in the bibliography. The so-called jacket platforms, which are steel framed structures, are considered and subjected to a quasi-static loading during severe conditions (storms).
MARINE GROWTH MODELLING : ACTUAL PRACTICE It is instructive to firstly mention the relevant contributions, which can be distinguished in two families: hydrodynamic modeling from experiments and marine growth physical modeling from in-situ measurements.
In the first way, lot of works have been developed on the basis on sensitivity of overloading due to the nature and thickness of marine growth and hydrodynamic structure of flow. As the techniques of flow velocity and acceleration measurements are particularly in-depth, complete studies are mostly recent. In fact, the equipments in water tunnels or large basin are generally costly considering the fact that large-scale experiments must be consider for similitude conservation. Some of them are usefully reviewed and detailed by Sarpkaya [1]. The pioneer works due Sarpkaya [2] [3] concern fixed roughened cylinders placed in a sinusoidal oscillating flow. Others consider roughened cylinders subjected to sinusoidal oscillation in a large basin with intention of promoting two-dimensional flow [4]. After this period, another way of experimentation concerns the carriage technique i.e. forced sinusoidal oscillations of a cylinder in a basin [5] [6] [7]. The relative thickness i.e. thickness k divided by diameter D of cylinder tested like this varies from 1/240 to 1/50. These works contributed largely to a better understanding of relations between the nature and thickness of fouling and relative change of loads. Systematic measurements of Reynolds, Keulegan-Carpenter and Sarpkaya numbers allows to asses precisely the hydrodynamic conditions of the tests. In spite of “controlled laboratory conditions” significant differences in drag, inertia and lift coefficients data are found especially for Keulegan-Carpenter exceeded 8 with no predominant reason. [1] Effects of three-dimensional vortex instability may affect them. A specific work carried out by Theophanatos pointed out that the
one-parameter characterization of roughness i.e. k/D is not suitable to embrace all the complexity of fluid-structure interaction and to quantify loading [8]. In fact the shape of roughness, effects of soft seaweed, limitation of experimental scales and percentage of covertures have been shown to have a great influence on the results and to be taken into account. Note that in some sites like in the Guinea gulf for instance, waves and currents coexist with a similar contribution to loading and special effects of their combination should be studied [9].
In the second way, in situ observation after survey campaigns are analyzed to purpose a modeling of marine growth effects. It is first interesting to define what should be a good inspection i.e. the inspection with the right tool, on the right places at the right time. It is generally advocated to select a pile, or a face of a specific element of which the data are supposed to be representative of the entire level [6]. Near the splash area, horizontal members which are generally totally covered are also inspected. The area corresponding to the first thirty meters of depth are generally preferred because of their dominant contribution on hydrodynamic loading. Locally, is necessary to note with precision the colonized face [10]. Lot of works (see section 1) give a review of marine species present on offshore structures implanted in North Sea [6][10][11], near India [12], near the west coast of USA [13]. Most of these works define the way to assess the marine growth thickness from circumference measure with an uncertainty depending of the nature of species. Considering now, the impact on hydrodynamic coefficient of Morison equations [14], it is generally assumed [6] that drag coefficient is obtained following a linear regression with the thickness upon (k/D). Authors generally concluded that data are sparse and that more inspection are needed. Even with these data, there will still be non reducible uncertainties due to intrinsically variable patterns and measurement errors. In attempt to optimize cleaning programs there is a way to introduce this uncertainty through Risk Based Inspections strategy.
These studies allows to advocate guidelines for a probabilistic modelling at a given time : generally the stochastic process of marine growth colonization is unknown. In particular the process of colonization depends strongly on phenomena short in time as seasons ore severe storms during winter which are able to clean part of the structure and on some electrochemistry effects as cathode protection [14]. Recent works show how to introduce seasonal variation for changing the Global Design Number level [15]. It leads to less conservative combination values of marine growth and waves. Finally, it leads to mix a pure reliable approach based on the relative change of safety index levels due to increase of random loads with a deterministic one specifying conservative procedures and implementing sensitivity studies to hypothesis.
The next section deals with the nature and growth of marine fouling to overview the main biological effects as seasons, beam location and orientation, when planning inspection and cleaning.
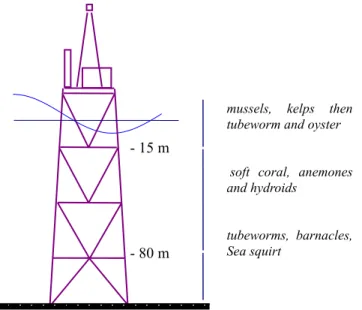
REVIEW OF SPECIES : THE CASE OF NORTH SEA Before modelling it is particularly instructive to review the extreme variety of marine growth. As such review is site specific, illustration is given here for the North sea area. It summarizes several works [6] [10] [11]. Once numbered up to 29 vegetal species and 60 animal species on one single platform. Generally, tree main layers of water are distinguished to present the type of colonization (see figure 1).
Figure 1. MAIN LAYERS OF COLONIZATION.
Only 12 of them are generally considered for modelling because of the surface they cover, their tail and life time. They are reported on table 1. The depth is counted from the mean sea level. It is to notice that the layer until 30 meters corresponds to the splash area for severe conditions. Some species are illustrated with a drawing to point out the variety of roughness shape and size ranking. This table gives an overview of the colonization density and process is also briefly described. Note that life time is mostly useful to introduce season effects on presence or not of fouling for a specific loading as storm. Moreover, the nature of structural attachment of rigid fouling has to be mentioned to analyse if shells still rest after death.
The most frequent vegetal species are kelps, which need light for implantation and growing (see table 2). They are generally meted up to 30 meter depth but are mainly present just under the splash area on all kind of structural components whatever their orientation. Their life time can be very short as the summer season to long period as 10 years depending of the specie. Cleaning them is easier than cleaning rigid marine growth and this fact has to be introduced to optimise inspection and cleaning program.
Other species are for example mobile animals as crabs, starfish, worms and shrimp who have an insignificant effect on structural loading. However they have an non-direct influence as starfish are predators for mussels and can reduce their life time and clean the structure from shell.
Usual name Colonization process
Life time Maximal size 0 to -20 m Bivalve mussel (R) bed established after 2 years l < 9 ; t > 15 (1) to 20 (2) Barnacle (R) thickness more than 3 cm 18 to 24 month but shell still attached → new support d< 3 ; h < 4 Sea-squirt (S) horizontal components protected / agitation l = 3 to 6 -30 to –100 m Anemone (S) After 1 year : density more than 300 / m² l = 20 Soft coral (S) Density more than 500 / m²
35 weeks for the grub d = 8 to 10 ; h > 20 -30 to –210 m Barnacle (R) adult at 7 years d < 5 ; h < 5 0 to bottom Tubeworms (R) Solitary specie
18 month but the tube keeps attached on the component d = 5 ; l < 10 Hydroids (S) at the beginning ; survive after for deepness more than 100 meters l < 15 0 to –300 m Sea-squirt (S) horizontal components protected / agitation // l = 3 to 6 -60 to –550 m Tubeworms (R) d = 30 to 50 ; h < 20 fragile d > 0,1 ; l > 5 -200 to -500 m
Rigid coral (R) Slow growth Great life time d = 8 to 10 ; h > 20 (1) and (2) : respectively for the North and South sectors of the
North Sea. (3) for very great deepness (200 - 500 meters) i.e.
west and north from Scotland.
Table 1. MAIN ANIMAL SPECIES IN NORTH SEA. In the last column, l denotes the length, t the thickness, h the height and d the diameter all in centimetre. The letters (R) and (S) are used to distinguish respectively rigid and soft marine growth.
- 15 m
- 80 m
mussels, kelps then tubeworm and oyster
soft coral, anemones and hydroids
tubeworms, barnacles, Sea squirt
Area Usual name Scientific name Life time Maximal size (1)
+2 to -2 m
Green kelps Enteromorpha intestinalis
1 summer season (short-lived)
l = 20
Ulva lactuca idem idem
2 to
-15 m Brown kelp Desmarestia l = 100 Red kelp Polysiphonia idem Brown seaweed Laminaria digitata About 10
years
l = 300
Lamin. hyperborea idem idem
Alaria esculenta idem idem (1) l : overall developed length in centimetre.
Table 2. MAIN VEGETAL SPECIES IN NORTH SEE.
Finally, the great number of inspection in North Sea and biological studies are sufficient to define the kind of components propitious to colonization of specific species [6]. This point is of importance because of the different nature of dominant loading, inertial or drag, acting on horizontal or vertical components. Table 3 resumes the main cases.
Area Kind of component Species
Area near surface (a)
Horizontal components Anemone, sea-squirt, soft coral – mussel, barnacle
Complexe risers
Mussel, Medium area Horizontal components
Mainly anemone (b) Anemone, soft coral
Deep area Horizontal components Sea-squirt, soft coral, anemone, hydroids, hydroids, barnacles
(a) : thickness stabilizes after 5 years - reaches less level as before. (b) : after 9 years in North area of North Sea.
Table 3. PREFERENCE LOCAL AREA OF COLONIZATION
Concerning loading effects, marine growth are generally classified into 3 classes :
- rigid marine growth (mussels, barnacles, tubeworms...), comprising rigid external skeleton (calcareous shell),
- soft marine growth (kelps, soft corals, anemones, hydroids, sea-squirt...), whose body texture varies,
- long kelps.
MODELING MARINE GROWTH EFFECT ON LOADING The previous sections give the main trends in view to propose marine growth modeling for overloading purposes. It appears that sources of uncertainty are various. First the data, based on circumferential measurement or R.O.V’s picture interpretation, leads to uncertain estimation on thickness and percentage of cover. Then the force measurements in laboratory leads to versatile results and leads to uncertain evaluation of loading. Finally, the use of Morison equations [16] for all in-situ orientations of components is a expansion of the standard
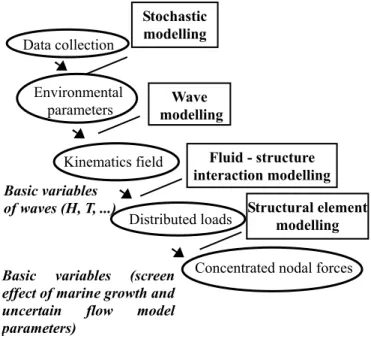
case where the formula as been developed and let us to introduce uncertainty on the model. Schematically, the nodal forces are found by following the path presented on figure 2.
Figure 2. PATH FOR NODAL FORCES ASSESSMENT
These uncertainties are introduced in the Morison equations. Their expression, translated in local coordinates, indicates that the force per unit span can be separated into drag (1) and inertial (2) components (figure 3),
(2)
Figure 3. LOCAL COORDINATES ON A BEAM (M) V (M) V 0 0 0 0 0 0 D 2 1 (M) fD mg → → θ ρ = D D X C C C π (1) f (M) 1 4 D C 0 0 0 C 0 0 0 C A (M) I 2 X M M = ′ → ρθmg π (2) where
- ρ is the water density, D the cylinder diameter,
-
→
V
(M) and→
A
(M) are respectively the instantaneous flow velocity and the acceleration at M point,Basic variables of waves (H, T, ...)
Basic variables (screen effect of marine growth and
uncertain flow model
parameters) Wave modelling Fluid - structure interaction modelling Structural element modelling Data collection
➘
Stochastic modelling Environmental parameters Kinematics field Distributed loadsConcentrated nodal forces
➘
➘
➘
L xbx
b→
y
→bz
b→
O b D Bottom side Bottom side Bottom side Bottom side- CX, CD, C'X, CM, are hydro-dynamic coefficients
(respectively two drag and two inertia coefficients) for modelling the fluid-structure interaction. There are introduced as model uncertainty variables.
- θmg acts as a multiplying coefficient for taking into
account the "marine growth" effects on beam diameter uncertainty (screen effect).
These equations generally predict the main trends in measured data quite well, once appropriate joint distribution for hydro-dynamics coefficients depending on sea-state parameters and distribution of θmg, depending of the marine growth nature
(hard or soft) and structure (percentage of curvature) can be provided. Nevertheless they are not able to translate all the complexity of the fluid-structure interaction with enough accuracy (i. e. high frequency content of the flow, gross vortex shedding effects, ...).
Keeping in mind these short comings as source of response problems, they are relevant to introduce non linear effects and their complexity is consistent with respect to the large uncertainty in marine growth or fluid interaction modelling caused by the lack of investigations. In fact higher complexity should be lost in this uncertainty. A matrix response surface has been developed [17] and is shown to be very tractable for sensitivity studies. By using energy considerations in a finite beam element model, the total external force at node L related to the beam-element ( L - P ) is obtained after some algebraic operation. The drag term has the form (3),
TLP l i 0 nb 2 2 (i) X 11 (i) d 22 (i) (i) 2 D mg a b C c b C c b a A b B = + + → + → = ∑ ⊥ ρ θ π Π Π (3) where c11(i) and c22(i) are the diagonal terms of influence
structural matrices, nb is the number of beam finite elements,( .
)(i) means the value of the expression ( . ) at the beginning
point Qi of the segment (Qi - Qi+1) of the finite element where
Q0 = L and Qnb = P,
Π
b is the orthogonal projection on thebeam element and
Π
b⊥ is the projection on the orthogonal plane of the beam element.Such a response enables us to introduce the main uncertainties in flow modelling versus Cd (drag coefficient) and
also the increasing screen effects due to marine growth (θmg).
SENSITIVITY STUDIES USING RESPONSE SURFACE Sensitivity analysis is recommended for analysing problems in which large uncertainties occur and where the transfer functions are non linear. The Monte Carlo method is well adapted to a large extend. It starts from a pseudo-random sampling to represent the system inputs. The well known Latin Hypercube Stratified sampling [18] provides a full coverage of the range of each input variable, but it remains questionable how far the selected samples are representative of the whole underlying distribution. The behaviour of an offshore platform in north sea conditions has been simulated versus R.S.M.
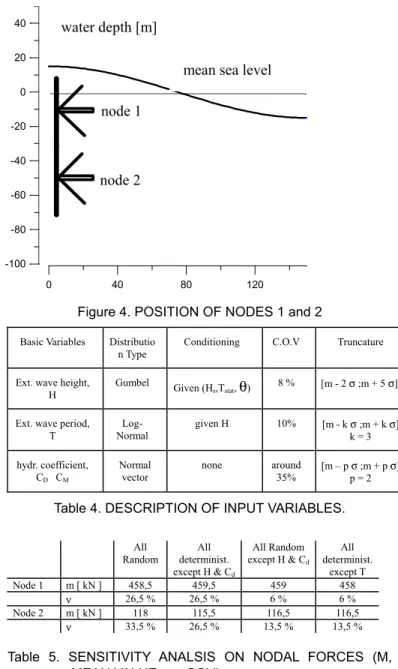
Random variables are described in table 4. It is then obtained the main contributors among the basic variables to the response by the corresponding contribution to the output statistical dispersion (see table 5) for configurations presented on figure 4. The diameter is 1,2 meters for vertical beams and 0,8 meters for others. Length is 28 meters for inclined components, 20 meters for each part of legs connected to each node and 20 meters for horizontal braces..
Figure 4. POSITION OF NODES 1 and 2
Basic Variables Distributio n Type
Conditioning C.O.V Truncature
Ext. wave height,
H Gumbel Given (Hs,Tstat, θ) 8 % [m - 2 σ ;m + 5 σ] Ext. wave period,
T Normal Log- given H 10% [m - k σk = 3 ;m + k σ] hydr. coefficient, CD CM Normal vector none around 35% [m – p p = 2 σ ;m + p σ]
Table 4. DESCRIPTION OF INPUT VARIABLES.
All
Random determinist. All except H & Cd All Random except H & Cd All determinist. except T Node 1 m [ kN ] 458,5 459,5 459 458 ν 26,5 % 26,5 % 6 % 6 % Node 2 m [ kN ] 118 115,5 116,5 116,5 ν 33,5 % 26,5 % 13,5 % 13,5 %
Table 5. SENSITIVITY ANALSIS ON NODAL FORCES (M, MEAN VALUE ; ν, COV).
This simulation starts from a pseudo-sampling approach to represent the system inputs. It leads to bias in mean estimation. Comparing the thirst and fourth column, the major contributions in the variance of the nodal load intensity come clearly from the wave height H and the drag coefficient Cd.
Results obtained on node 2 illustrate that the wave period acts upon when the water depth index increases.
0 40 80 120 -100 -80 -60 -40 -20 0 20 40 water depth [m] node 1 node 2
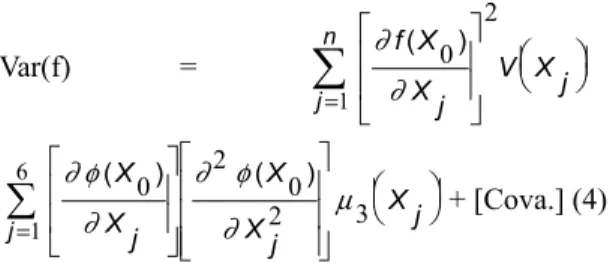
Explicit formulations obtained from R.S.M are very tractable for sensitivity analysis based on differential analysis. It can be used for ranking the basic variables and for evaluating their respective contribution to the total response variance Var(f) of the response function f under investigation. The second order Taylor expansion is in the form (4),
Var(f) = ∂ ∂ f X Xj V Xj j n ( ) 0 2 1 =
∑
+
∂ φ ∂ ∂ φ ∂ µ (X ) ( ) Xj X Xj Xj j 0 2 0 2 3 1 6 =∑
+ [Cova.] (4)where n is the number of basic random variables, µ3 is the
skewness coefficient, and Cova. denotes covariance terms. The example described above is developed ones again. The table 6 presents influence ratios (e.g. the contribution of each variable to the total output variance). This confirms the results previously obtained. It gives more precisely a quantitative measure of the relative importance of each variable and allows to discuss the ranking of basic random (H,T) and uncertainty (CD, …) variables .
Node n° H CD T Total
1 35 % 61 % 3 % 99 % 2 27 % 40 % 32 % 99 %
Table 6. INFLUENCE RATIOS INTO THE TOTAL RESPONSE VARIANCE.
It leads to propose a sensitivity analysis around the drag coefficient. The following results consider a beam of 15 meters long, placed between depth (-10 m) and depth (-25 m) in the same conditions as before. This element is mainly loaded by drag forces. Drag coefficient varies from 1 to 2 with values from 5 to 30 of the C.O.V in each case. The results of the selected nine cases are presented in table 7. Other variables keeps the same characteristics as defined on table 4.
Case n° 1 2 3 4 5 6 7 8 9 CD 1 1 1 1,5 1,5 1,5 2 2 2 c.o.v. (%) 5 15 30 5 15 30 5 15 30 m (L) (kN) 77,5 77,4 76,9 116,7 116,8 116,1 155,1 155 156,7 c.o.v (L) (%) 16,6 22,4 36,2 16,2 17,3 24,5 15,6 16,7 21,8 m (P) (kN) 62,4 62,6 61,9 94 94,1 93,4 124,9 124,8 126,2 c.o.v (P) (%) 18,2 23,8 37,1 17,8 18,8 25,1 17,2 18,2 22,9
Table 7. VARIATIONS OF LOADS STATITICS UPON CD.
It leads to conclude that mean values are not affected by the COV unless a bias minus than 2 %. It is mainly due to the normal distribution selected for CD. The hypothesis on COV
has a great influence on loads dispersion. As usual, the dispersion on load increases with the dispersion on CD. This
result is more sensitive for low mean values than for great ones and leads in this case to dispersions around 35 % for a dispersion of 30 on CD. These results are obtained without
conditioning of CD to local flow conditions i.e. the position of
the beam and value of the wave’s extreme height. This approach is conservative. Introducing this conditioning should reduce the dispersion and lead to a more accurate modelling of the marine growth effects on overloading.
CONCLUSION
Marine growth effects on structural overloading have to be specified with care. The paper presents the main trends concerning the screen effect introduced with θmg and the
hydrodynamic effect introduced with the several uncertainty coefficients. The format of R.S.M. allows to underlined various sources of uncertainty as in-situ collection of data, laboratory simulation and intrinsic model uncertainty. Drag coefficient is shown, trough a well adapted response surface, to be dominant in term of effect on the global variance.
Further works should introduce a conditioning of CD by H,
by using relevant expressions of Reynolds and Keulegan-Carpenter numbers. The study of horizontal and vertical components should be proposed because of the various effects of Inertial and Drag forces on these components.
ACKNOWLEDGMENTS
The work reported here had been carried out in collaboration with IFREMER. Its support is gratefully acknowledged.
REFERENCES
[1] Sarpkaya T., On the effect of roughness on cylinders , Journal of Offshore Mechanics and Artic Engineering, Transactions of the American Society of Mechanical Engineers, Vol.112, pp.334-340. (1990).
[2] Sarpkaya T., In-line and transverse forces on smooth and
sand roughened circular cylinders in oscillating flow at high Reynolds numbers, Technical Report n°
NPS-69SL-76062, Naval Post Graduate School, Monterey, California-USA. (1976).
[3] Sarpkaya T., In-line and transverse forces on cylinders on
cylinders in oscillatory flow at high Reynolds numbers,
Journal of Ship Research, Vol.21, N°4, pp.200-216. (1977). [4] Rodenbusch G. and Gutierrez C.A., Forces on cylinders in
two-dimensional flow, technical report. Vol. 1, BRC 123-83,
Bellaire Research Center, Houston, Texas – USA. (1983). [5] Kasahara Y., Koterayama W. and Shimazaki K. Wave forces
acting on rough circular cylinders at high Reynolds numbers, OTC 5372, Houston, Texas-USA, April 27-30.
(1987).
[6] Wolfram J., Jusoh I. et Sell D., Uncertainty in the
estimation of the fluid loading due to the effects of marine growth, Safety and Reliability Symposium, Proc. of 12th
int. conf. on Offshore Mechanics and Arctic Engineering, (O.M.A.E'93), Glasgow, vol. II, pp. 219-228 (ASME 1993).
[7] Justesen P. Hydrodynamic forces on large cylinders in
oscillatory flow. ASCE Journal of Waterway, Portg,
Coastal and Ocean Engineering. Vol. 115, N°4, July pp. 497-514. (1989).
[8] Theophanatos A., Marine growth and hydrodynamic loading of offshore structures, PhD thesis, University of Strathclyde - UK, Feb 1988.
[9] Asao T., Takagi N., Motora S., Sakuta M, and Uekita M. A
study on wave forces on a cylinder in the fields where wave and flow coexist, Proc. Of International Offshore
Mechanics and Arctic Symposium, Tokyo – Japan, pp. 130–135, ASME Pub. New York, (1986).
[10] Picken G.B., "Review of marine fouling organisms in the
North Sea on offshore structures", Discussion Forum and
Exhibition on Offshore Engineering with Elastomers, June 1985, Plastics and Rubber Inst., London , vol. 5, pp. 5.1 - 5.10 (1985)
[11] Sell D., "Marine Fouling", Proceeding of the Marine Conservation Symposium, Royal Soc. of Edinburg
[12] Sankalpa Mitra, Marine growth on offshore structures in
Indian offshore waters and removal strategy. First
International Offshore and Polar Engineering Conference, I.S.O.P.E, P.o. Box 1107 Golden U.S.A., pp. 143 - 147 (1991)
[13] Sharma J.N., Marine growth on the Hondo platform in the
Santa Barbara Channel. 15 th Annual Offshore Technology
Conference, vol. 2, Dallas U.S.A., pp. 469 - 474 (1983) [14] Eashwar M., Subramanian G., Chandrasekaran P.,
Manickam S.T., Maruthamuthu S. and Balakrishnan K. The
interrelation of cathode protection and marine macro-foulind, Bio fouling, vol 8, pp. 303-312, Harwood
Academic Publishers GmbH, Singapore, 1995.
[15] Faber M.H., Hansen P.F., Jepsen F.D. and Moller H.H.
Reliability-based management of marine fouling, Journal of
Offshore Mechanics and Arctic Engineering, vol 123, Issue 2, pp. 76-83, Elsevier Science Ltd, 2001.
[16] Morison, J.R., O'Brien M.P., Johnson J.W. and Schaff. S.A. The forces exerted by surfaces waves on piles, Petroleum trans. vol. 189, pp. 149 - 154. (1950)
[17] Labeyrie, J. and F. Schoefs, Matrix Response Surfaces For Describing Environmental Loads, vol. II Safety and Reliability, Proc. of 15th O.M.A.E, Florence, pp. 119-126., (1996).
[18] Iman R.L., Helton J.C. and Campbell J.E., An approach
to Sensitivity Analysis of Computer Models - Part I : Introduction, Input Variable Selection and Preliminary Variable Assessment, Journal of Quality Technology, vol.