HAL Id: hal-01068076
https://hal.archives-ouvertes.fr/hal-01068076
Preprint submitted on 24 Sep 2014HAL is a multi-disciplinary open access archive for the deposit and dissemination of sci-entific research documents, whether they are pub-lished or not. The documents may come from teaching and research institutions in France or abroad, or from public or private research centers.
L’archive ouverte pluridisciplinaire HAL, est destinée au dépôt et à la diffusion de documents scientifiques de niveau recherche, publiés ou non, émanant des établissements d’enseignement et de recherche français ou étrangers, des laboratoires publics ou privés.
How Nuclear Power Plants in Spain are reacting to the
Massive Introduction of Renewable Energy
Margaret Armstrong, Asana Sasaki, Frederic Novel-Cattin, Alain Galli
To cite this version:
Margaret Armstrong, Asana Sasaki, Frederic Novel-Cattin, Alain Galli. How Nuclear Power Plants in Spain are reacting to the Massive Introduction of Renewable Energy. 2014. �hal-01068076�
Interdisciplinary Institute for Innovation
How nuclear power plants in Spain
are reacting to the massive
introduction of renewable energy
Margaret Armstrong
Asana Sasaki
Frederic Novel-Cattin
Alain Galli
Working Paper 14-ME-02
September 23, 2014
CERNA, MINES ParisTech 60 boulevard Saint Michel
75006 Paris, France
1
How Nuclear Power Plants in Spain are reacting to the Massive Introduction
of Renewable Energy
Margaret Armstrong1, Asana Sasaki2, Frederic Novel-Cattin3 & Alain Galli4 1. MINES ParisTech, PSL - Research University, CERNA - Centre for Industrial Economics +33
140519313,margaret.armstrong@mines-paristech.fr
2. Ecole des Ponts ParisTech, +81 9035300295, asana.sasaki@gmail.com
3. Renault, +33 176876426 frederic.novel-cattin@renault.com
4. MINES ParisTech, PSL - Research University, CERNA - Centre for Industrial Economics +33 140519314, alain.galli@mines-paristech.fr
Abstract
This paper analyses the evolution of the bidding strategies of nuclear power plants on the Spanish day-ahead auction market, over the 11-year period from 2002 until December 2012. During that time the proportion of renewable energy especially wind and solar power increased dramatically. At the outset the nuclear plants offered almost all their production at zero cost; by the end, several were offering about 5% of their production at about 91 euro per MWh compared to the market ceiling price of 180.3 euro per MWh. This change in bidding strategy effectively increased the average wholesale price of electricity, leading to an overall increase in the revenues to power sellers of about $200 million euros per year in 2010 -2012, compared to what it would have been had they offered all their production at zero -cost. These results have important policy implications for regulatory authorities.
2
1. Introduction
According to the Economist (2013), power providers in Europe have lost over 500 billion euros in share value since 2008. Their income from traditional power stations has dropped, mainly because of the massive introduction of renewable energy. For example, the underlying income of Germany’s biggest utility, E.ON, dropped by 46% from 2012 to 20131. The second largest utility in Germany, RWE, saw its pre-tax income from continuing operations drop from +4978 M euros in 2010 to -1487 M euros in 20132, while in Spain, Iberdrola’s pre-tax profit dropped by 60% between 2012 and 20133. During 2013, wind and solar power provided about 22% of the electricity generated in Germany and more than 30% in Spain. Both countries had offered advantageous feed-in tariffs to encourage the development of wind and solar farms. As renewable energies have grid priority, they displace traditional baseload producers such as coal-fired and nuclear power stations from the bottom of the merit order. Gas-fired plants operate for far fewer hours per year and are making a loss. Ideally, they should shut down but they are required as back-up when the wind drops. While wholesale electricity prices have dropped on average, retail prices have increased due to the subsidies on renewables (Ciarret, Espinosa & Pizarro-Irizar, 2014).
The massive introduction of subsidized renewable energy is not the only factor causing difficulties for utilities. Other factors have aggravated the situation. The shale gas boom in North America means that US power plants are turning to gas and away from coal which is being exported to Europe. Because the electricity consumption had increased from 2000 to 2008 and had been expected to continue to increase, many new power plants were constructed (Cossent, Gomez & Olmos, 2011) but from 2008 onwards the electricity demand has dropped because of the global economic crisis. In this paper, we postulate that given the sharp drop in the income of traditional power generators, they have steadily changed their bidding strategies to enhance their profitability. To test this hypothesis, we carried out an empirical study of the behavior of nuclear power plants in Spain. The main reason for focusing on Spain is that the Iberian power exchange OMIE has a very open policy on releasing information. Bids are available on its website after a delay of three months. These give the name of the production unit, together with the quantity and price offered (and likewise for buyers). This makes it possible to track the evolution in bidding strategies.
Another reason for choosing Spain is that while it is coupled with Portugal, it has connections with only two other countries, Morocco and France. As these account for less than 5% of the power consumption, the Iberian Peninsula is almost isolated. We chose to focus on nuclear power plants rather than say coal or gas-fired plants, because there are only 9 of them and together they account for about 20% of the electricity consumed in Spain. The period under study starts in 2002 when renewable energy was just starting to come on line, and goes till the end of 2012. In 2013, the Spanish government stopped paying feed-in tariffs.
1 E.ON Group Financial Highlights 2013 available from https://www.eon.com/en/investors/key-figures.html 2 RWE Key Data Tool 2013 available from http://rwe-datatool.com/?lang=eng
3 Iberdrola Consolidated Financial Statements, Management Report and auditor’s Report for Fiscal Year 2013 Available from https://www.iberdrola.es/webibd/gc/prod/en/doc/IA_CuentasAnualesConsolidadas2013.pdf
3
The rest of the paper is organized as follows. After reviewing the regulatory framework for renewable energy in Spain, we describe the structure of the Spanish and Portuguese electricity sector (Section 2). In Section 3, we present our empirical study of how the bidding strategies of nuclear plants have evolved from 2002 to 2012. First we show that the period 2002 to 2012 can be split into three parts: an early period from 2002 to mid-2004 when renewable energy was just getting under way; a middle period from mid-2004 to the mid-2009 when the number of renewable energy producers increased rapidly and the final period from late 2009 till 2012 when the situation stabilized. At the outset the nuclear plants offered almost all their production at zero cost; by the end, several plants were offering part of their production at about 91 euro per MWh compared to the ceiling price of 180.3 euro per MWh. The question is how much impact does this have on prices? To estimate the effect this had, we built a counter-factual time series of prices for the period 2010 – 2012 assuming that the nuclear power plants proposed the same amount but at a zero price. No other changes in bidding strategy were envisaged. The average difference between the true prices and those in the counterfactual series is about 1 euro per MWh. When multiplied by the total quantity transacted on the day-ahead market gives an additional cost of about 200 million euros per year in Spain over the three year period. In the conclusions (Section 4) we discuss the implications of these findings.
2. Regulatory Framework for the Day-ahead Market and for Renewable Energy 2.1 Regulatory Framework for Renewable Energy
The European Union’s 20-20-20 climate and energy policy set three key objectives for 2020:
· A 20% reduction in EU greenhouse gas emissions from 1990 levels;
· Raising the power produced from renewable energies to 20% of EU energy consumption · A 20% improvement in the EU’s energy efficiency.
The Spanish government has been active in implementing this policy4. From 2004 to 2010, it provided generous incentives in the form of feed-in tariffs and premiums to support renewable energy producers (Saenz de Miera et al, 2008; Rivier Abbad, 2010; del Rio Gonzalez, 2008; Cossent et al, 2011; Ciarrreta et al, 2014). The Special Regime as it was called, covered wind power, solar power (both photovoltaic and thermal), small hydropower (less than 50 MW) biomass and cogeneration. The feed-in tariffs were progressively reduced from 2010 until 2013 when they were stopped. There were two reasons for this: firstly, the introduction of renewable energy had been a success and secondly due to the global financial crisis the Spanish government had to reduce its spending (Espinosa, 2013a; Ciarrreta et al, 2014).
As these incentives were very successful, the quantity of renewable energy increased rapidly causing problems for traditional power plants especially peak producers. In 2007, the Spanish government introduced capacity payments (“Garantia de Potencia”) designed to ensure the security of supply (Carbajo Josa, 2007; CNE 2012). Power plants received annual payments of about 20,000 euros per MW per year for the first 10 years of production to help cover investment costs. In addition combined cycles, coal-fired plants, fuel-oil plants that were available at times of peak demand
4 The EU decisions and the Spanish Royal Decrees are available on the website of the Iberian power exchange OMIE: http://www.omel.es/en/home/market-regulations
4
received an annual payment of around 4500 euro per MW; dam and step hydro power plants received about 1200 euro per MW per year.
2.2 Market structure in Spain
The electricity sector in Spain was liberalized in 1998 after the promulgation of the Royal Decree 2019/1997. This gave rise to the day-ahead market where the price is fixed for each 1-hour period in 24 uniform price auctions, and to an intra-day market which allows buyers and sellers to update the amounts that they want to buy/sell. In Spain, this consists of 6 uniform price auctions at different times prior to delivery in contrast to the continuous-time intraday market in Central Western Europe (France, Germany, Belgium & the Netherlands).
In July 2007, the Spanish and Portuguese market operators were merged, forming a common market called OMIE for the whole of the Iberian Peninsula. One difference between OMIE and most other European day-ahead markets is that bids are limited to being between 0 and 180.3 per MWh, compared to between -500 euro and +3000 euros for the CWE market.
During the period under study, bids to buy or sell electricity on the day-ahead market had to be sent by 10am on the day prior to delivery (by 12 noon after 15 October 2013). These consist of up to 25 pairs (called blocks) of a volume and a price, with the prices arranged in ascending order for sellers and conversely for buyers. One specific feature of the Iberian market is that in addition to simple bids, sellers may incorporate four types of complex bids5 in their offer, namely
2. Indivisibility (A minimum operating value can be fixed to the first block)
3. Load gradients (A maximum difference between the power to be delivered from one hour to the next)
4. Minimum income (The unit is only called if its income that day exceeds a certain value6) 5. Scheduled stop (This allows units that have been withdrawn because they did not reach the
minimum income required to carry out a scheduled stop.
These constraints have an enormous effect on market prices. The fine brown line in Fig 1 shows the aggregate curve of all the offers to sell electricity for the tenth hour (H10) on 17 January 2011 when the market-clearing price was 53 euro per MWh for a total of 32,017 MW. The blue line shows all the offers to buy power, with those that were accepted shown in bold. The bold red line shows the offers to sell that were accepted after the complex constraints had been taken into account. Without these constraints, the price would have been much lower: 15.6 euros per MWh. We will refer to the price without constraints as the theoretical price.
One of the reasons for choosing to study the Spanish market is that OMIE, the Iberian power Exchange, is much more open than most power exchanges. It releases the full data on the bids three months afterwards on its website. Because the names of the production units are included, it is possible to study the evolution of their bidding strategies over time.
5 See the OMIE website for details:
http://www.omel.es/en/home/markets-and-products/electricity-market/our-electricity-markets/daily-market
5
Figure 1. Aggregates curves on Spanish day-ahead market for the tenth hour (H10) on 17 January 2011. The market clearing gave a price of 53 euro per MWh, for a volume of 32,017 MW. The fine brown line is of all the offers to sell electricity whereas the blue line shows all the offers to buy power, with those that were accepted shown in bold. The bold red line shows the offers to sell that were accepted after the complex constraints had been taken into account. Without these constraints, the price would have been much lower: 15.6 euros per MWh. We will refer to the price without constraints as the theoretical price. Source of Data: OMIE. Our presentation.
Each production unit is identified by a code containing up to 7 characters. For example, BES1 denotes the thermal power plant C.T. Besos 1 owned by Endesa; BES4 is the combined cycle C.C. Besos 4 owned by Gas Natural; WMRE122 owned by Wind To Market operates under the Special Regime while WMVD161 also owned by Wind To Market sells excess production (i.e. not under the Special Regime)7. All told, there are more than 3000 such codes when the commercial buyers & sellers, importers and exporters, end consumers, distributors and generators are included. While it is easy to work out what type of fuel the traditional producers are using, this is much more difficult for the renewable energy producers.
3. Methodology
3.1 Studies on bidding strategies in Spain
This is not the first study on bidding behavior in the Spanish wholesale electricity market. Fabra & Toro (2005) and Ciarreta and Espinosa (2005) studied the day-ahead market up to 2003, that is, before the introduction of renewable energies. At that time there were two large producers, Endesa and Iberdrola, each with about 35% market share, and two smaller producers, Union Fenosa and Hidrocantabrico. Fabra & Toro (2005) focused on the dynamics between Endesa and Iberdrola during the first 12 months after the liberalization of the market (i.e. Jan – Dec 1998). They showed that
7
6
these two producers alternated between price wars and episodes of collusion. Going further, Ciarreta and Espinosa (2005) showed that smaller firms such as Union Fenosa and Hidrocantabrico bid production at its marginal cost whereas larger firms such as Endesa and Iberdrola optimize their profitability by strategic bidding.
Both studies concluded that the traditional power companies were bidding strategically in the period 1998 – 2003. From 2004 onward, more and more renewable energy was produced in Spain. This was introduced onto the day-ahead market at zero-cost (because of the feed-in tariffs), thereby making traditional power stations less profitable. Our hypothesis is that they will have continued using bidding strategies to enhance their revenue. The question we attempt to answer in this paper is precisely what strategies are they using.
3.2 Strategic bidding and market power
The topics of market power and strategic bidding have received considerable attention over the past 20 years since energy markets were liberalized, especially after the Californian electricity crisis in 2000. According Joskow (2001), government officials believed that power plants had been withdrawn from service at least partially for strategic reasons. Fridolfsson and Tangeras (2009) described inter-temporal strategies where hydro-generators in Nordic countries overproduced in summer so that thermal plants with higher costs would have to come on line to meet the demand in winter.
In their analysis of the Californian crisis using Cournot games, Borenstein and Bushnell (1998) showed that there was potential for individual firms to exercise market power in the high demand hours over several months of the year. They also noted the possibility that “firms engaging in repeated interactions with one another may compete less aggressively over time”. This idea was pursued by Tellidou and Bakirtzis (2007). By considering electricity markets as a repeated game in which SA-Q learning took place and by using agent-based simulations they showed that tacit collusion could emerge because of reinforcement learning.
In this paper we subscribe to the idea that players who compete regularly in the same auctions, develop strategies for increasing their profits. Several factors prevent them from optimizing their strategies: firstly, the demand is not perfectly known; secondly, the introduction of new entrants (renewable energy producers) changes the number of players, and thirdly, new regulations are brought in by the government, thereby changing the nature of the game.
3.3 Analysing the bids in the Spanish day-ahead market
Traditional power plants usually have a maximum capacity of over 300 MW. Typically CCGTs have a capacity of 350 – 400 MW; for nuclear plants it is around 1000 MW and the biggest hydro plants have a capacity over 3000 MW (e.g. those on the Douro & Tagus Rivers). Conversely, most renewable energy plants are small - less than 50 MW. Having said that, there are exceptions: the wind farms WMVD088 and WMVD092 have capacities of more than 1000 MW and 300 MW, respectively.
We computed the maximum amount offered by each producer during each quarter from 2002 to 2012, and then determined the number of producers in three ranges: 0 – 150 MW, 150 – 300 MW and above 300 MW.
7
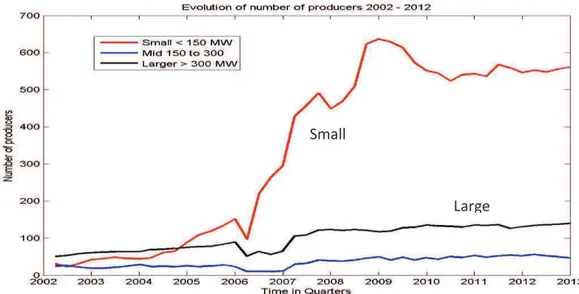
Figure 2: Quarterly evolution of the number of small, medium and large producers of electricity from 2002 to 2012. Small producers (red) produced at most 150 MW during the quarter; medium producers (blue) produced more than 150 MW but less than 300 MW while large producers (black) produced more than 300 MW. Note the sharp increase in the number of small producers from mid-2004 until mid-2009. This reflects the success government incentives to encourage renewable energy producers.
Figure 2 shows the evolution of the number of small, medium and large producers, each quarter, respectively in red, blue and black. While the numbers of medium and large producers increased gradually, the number of small producers started increasing in mid-2004 then increased exponentially from 2006 to 2009, before stabilizing from 2010 until 2012. Consequently we divided the study period into three periods:
· 2002 till mid-2004, when the number of small producers was fairly constant · October 2004 till mid-2009 when the number of small producers increased rapidly · Late 2009 till end 2012 when the number of small producers stabilized.
We consider that the increase in number of small producers during the middle period is mainly due to new producers of renewable energy. We now show that the bidding behavior of the nuclear plants was as expected: 100% at zero cost during the first period. During the second period, it changed frequently – producers were trying to adapt to the changing situation. In the third period, the bidding patterns stabilized, with several producers offering part of their production at 91.01 € per MWh.
3.4 Nuclear plants in Spain
Nine nuclear power plants were constructed in Spain (Table 1), and none in Portugal. Table 1 gives their names, their trading codes, their owners and their production capacities.
Small
8
Table 1: Nuclear power plants in Spain, their owners, their nominal capacity and the code used to
represent their bids on the power exchange. Sources: OMIE file Lista Unidade
3.4 Evolution of Bidding Strategies of Nuclear Power Plants 3.4.1 First period: 2002 - mid 2004: a calm period
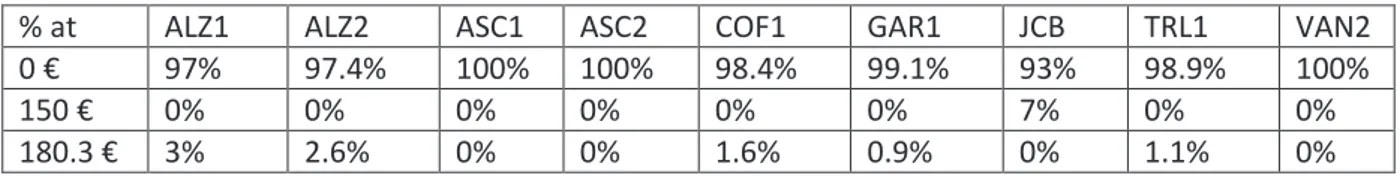
In 2002, three of the 9 nuclear power plants ( VAN2, ASC1 and ASC2) offered all of their production at zero cost; five more (ALZ1, ALZ2, COF2, GAR1 and TRL1) offered almost all the electricity produced at zero cost and the rest (less than 3%) at the market ceiling price of 180.3 euro per MWh while the last one (JCB1) offered 93% (140 MW) of its production at zero cost and the remaining 7% at 150 euro per MWh (Table 2).
Table 2: Summary of the bids made by the 9 nuclear plants in 2002. Source: our calculations.
% at ALZ1 ALZ2 ASC1 ASC2 COF1 GAR1 JCB TRL1 VAN2 0 € 97% 97.4% 100% 100% 98.4% 99.1% 93% 98.9% 100% 150 € 0% 0% 0% 0% 0% 0% 7% 0% 0% 180.3 € 3% 2.6% 0% 0% 1.6% 0.9% 0% 1.1% 0%
Figure 3 shows the quantity of electricity offered by ASC2 at zero cost hour by hour throughout 2002. This is a typical production profile for a nuclear plant: 100% production all the time except during planned maintenance and occasional outages. The production profiles of the other 8 nuclear power plants are show in Appendix 1. The bidding strategies remained the same in 2003 and the first three quarters of 2004, but they changed in the fourth quarter.
Code Name Owner Max Capacity ALZ1 C.N. ALMARAZ 1 GAS NATURAL SDG
ENDESA GENERACIÓN, S.A IBERDROLA GENERACIÓN
1032 MWe
ALZ2 C.N. ALMARAZ 2 GAS NATURAL SDG ENDESA GENERACIÓN, S.A IBERDROLA GENERACIÓN
1027 MWe
ASC1 C.N. ASCÓ 1 ENDESA GENERACIÓN, S.A IBERDROLA GENERACIÓN
930 MWe
ASC2 C.N. ASCÓ 2 ENDESA GENERACIÓN, S.A IBERDROLA GENERACIÓN
930 MWe
COF1 C.N. COFRENTES IBERDROLA GENERACIÓN 994 MWe GAR1 C.N. STA MARIA DE GAROÑA NUCLENOR 460 MWe JCB1 C.N. JOSE CABRERA GAS NATURAL SDG 160 MWe TRL1 C.N. TRILLO GAS NATURAL SDG
NUCLENOR
1066 MWe
VAN2 C.N. VANDELLOS1 IBERDROLA GENERACIÓN ENDESA GENERACIÓN, S.A
9
Figure 3: Quantity of electricity offered by ASC2 at zero cost hour by hour throughout 2002. This is a typical production profile for a nuclear plant: 100% production all the time except during planned maintenance and occasional outages
3.4.2 Second period: Oct 2004 – End 2009: A tumultuous period
On 16 and 17 October 2004, four of the power plants (ASC1, ASC2, GAR1 and VAN2) started offering 5% of production at 90.01 euro per MWh instead of 180.3 euro. On 29 January 2005, four more plants (ALZ1, ALZ2, COF1 and TRL1) dropped their top price from 180.3 euro down to 125 or 130 euros per MWh, then back up to 150 euros. Even more price changes occurred in 2006. For example, between 14 June and 28 August 2006, COF1 offered to sell power at a wide range of prices: 27.5€, 28.5€, 40€, 4 €, 42.01 €, 45.01€, 50€, 50.01€, 52.02 €, 54.02€, 54.99€, 55.02€, 61.03€, 62.02€, 133.75€ and 140€.
ASC1 and ASC2 started selling most of their production via bilateral contracts rather than on the day-ahead market. Changes in bidding patterns were frequent until 8 August 2009 when four plants settled on the following top prices around 91 euros per MWh:
· ASC1 91.00 euros per MWh · ASC2, GAR1 and VAN2 91.01 euro per MWh
It is not clear why the prices of 91.00 and 91.01 were chosen. But as the four power stations changed on the same date, the decision was concerted. Secondly, the fact that ASC1 was offering its production at a slightly lower price means that it would be called before the other three.
Lastly, in 2006, the smallest of the nine plants JCB1 stopped production. 3.4.3 Third period: 2010 – 2012: Stable Period
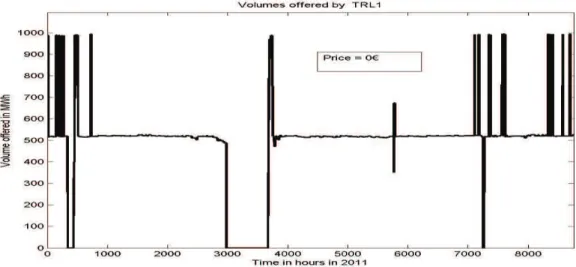
From 2010 onwards, the eight remaining plants offered only part of their production for sale on the day-ahead market. Figure 4 shows the quantity offered by TRL1, hour by hour during 2011. Note how rapidly the quantity offered rises up. Since nuclear power plants are not designed to ramp up and down quickly, the plant was probably at full production with the rest being sold via bilateral contracts.
During this period, a significant part of the production was sold via bilateral contracts. There were two bidding patterns for what was offered on the day-ahead market, four (ASC1, ASC2, GAR1 and
10
VAN2) offered part at zero and the rest at 91.00 and 91.01 euro while the other four (ALZ1, ALZ2, COF1, and TRL1) bid at zero cost.
Figure 4: Quantity of electricity offered by TRL1 at zero cost hour by hour throughout 2011. Note how quickly the quantity increased and decreased. Since nuclear plants normally run at full production except during maintenance periods and outages, this plant is probably selling the rest via bilateral contracts.
3.5 Why offer to sell power at 91 euro per MWh?
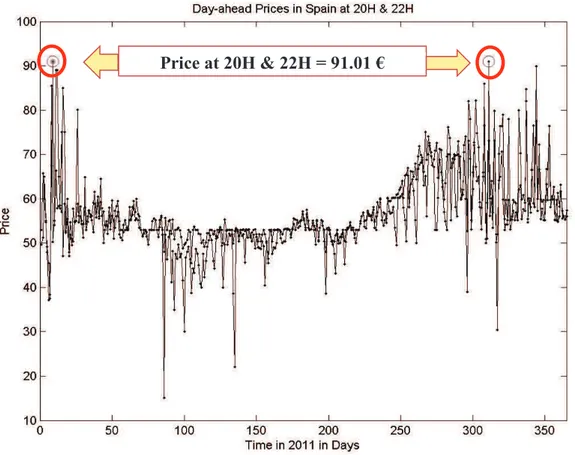
As the average prices on the day-ahead market in 2010, 2011 and 2012 were 37.0, 49.9 and 47.2 euros, it seems rather strange to offer part of the production at 91.00 and 91.01 euro. We wondered whether the bids were ever accepted and what effect this strategy would have had on market prices. Much to our surprise, the market closing price was actually 91.01 euros on two occasions at H20 and H22 in 2011 (Figure 5). So these bids were accepted on those two occasions, and nuclear power became the marginal producer. At all other times, the quantity of electricity offered at 91 euros was effectively removed from the market. Studies on the exercise of market power in electricity markets have shown that an unusually high incidence of outages during the electricity crisis in California pushed prices up (Joskow, 2001).
We also wondered whether many other sellers had made bids near 91.01 euro on those two days. As can be seen from the two tables in Appendix 2, there were seven bids at 91.02 euros at H20 and twelve at H22 plus one at 91.00 and another at 91.01, all from traditional thermal power plants. This seems an extraordinary coincidence.
3.6 Building a Counterfactual Time Series of Prices
In order to evaluate the impact of offering part of their production at 91 or 91.01 euro per MWh, we constructed a counterfactual time series by setting all the offers made by nuclear generators to zero, and computing the new day-ahead price. Having all the individual bids together with the bidders’ names, it was easy to determine what the aggregate selling curve would have been, and hence
11
determine the new theoretical price where the two curves intersect. The difficulty lies in working out what effect the four types of constraints would have had.
Figure 5: Day-ahead prices at H20 and H22 (superimposed) throughout 2011. Note that the day-ahead price was 91.01 euro per MWh on two occasions (9 January and 7 November). Surprisingly the marginal producer turned out to be the nuclear power plants (ASC2, GAR1 and VAN2). Another surprising feature is the number of days in spring/summer when the price was equal to 53 euro.
Our first idea was to plot the day-ahead price versus the theoretical price, fit a regression line and hence deduce what day-ahead price would correspond to the new theoretical price. As can be seen from Figure 6, there is too much dispersion for this to be effective. So we made the simplifying assumption that the ratio of the day-ahead price to the theoretical price would have remained the same as it was for that hour
3.7 Results
This approach was applied to the data for the years 2010, 2011 and 2012; that is, for all 8760 hours in each year. Table 3 gives the average ahead price (top row) and the average of the estimated day-ahead price (second row). Knowing the volume of electricity sold during each hour, we computed the total revenue to sellers on the day-ahead market (third row), and likewise what the total cost would have been if the bids by nuclear power stations had all been at zero (fourth row). The difference between the two corresponds to the additional revenue generated by this bidding strategy. The
12
amounts were about 200M euros per year for the three years considered. So this very simple and apparently innocuous strategy significantly increased the producers’ revenue.
Figure 6: Day-ahead price in Spain versus the theoretical price (i.e. the intersection of the aggregate curves of offers to buy/sell electricity without taking account of the four types of complex constraints). The red points correspond to peak hour prices between H8 and H23, while the black ones are off-peak prices. There is too much dispersion to be able to estimate the day-ahead price given the theoretical one.
Table 3: Additional Revenue Generated by this Bidding Strategy. The average day-ahead price is given in the top line (Source OMIE) ; the average of the counterfactual prices obtained if the nuclear generators offered all available power at zero euros instead of 91 or 91.01 euro (second line). By multiplying the first two lines by the total quantity transacted on the day-ahead market we obtain the total revenue received by all the sellers (third row) and the revenue that they would have obtained if the nuclear generators offered their power at zero (fourth row). The additional revenue obtained by sellers is given in the last line. That is, this additional amount was paid by consumers.
2010 2011 2012 Average of Actual Day Prices 37.0098 € 49.9198 € 47.2379 € Estimated Day-Ahead Price if nuclear plants
offered all their production at 0€
36.0041 € 48.9930 € 46.0705 €
Total Cost of Electric Power 8805 M€ 11053 M€ 11190 M€ New Estimated Total Cost 8605 M € 10881 M€ 10968 M€
13
4. Discussion, Conclusions and Perspectives
Our analysis of the evolution of the bidding strategies of nuclear power plants on the Spanish day-ahead auction market, over the 11-year period from 2002 until December 2012, showed that at the outset the nuclear plants offered almost all their production at zero cost; by the end, several plants were offering about 5% of their production at about 91 euro per MWh compared to the market ceiling price of 180.3 euro per MWh. During that time the proportion of renewable energy especially wind and solar power increased dramatically. This change in bidding strategy effectively increased the average wholesale price of electricity, leading to an overall increase in revenues to power sellers of about $200 million euros per year in 2010 -2012, compared what it would have been had they offered all their production at zero cost. This result has implications for regulatory authorities.
What view should we take on such practices? On the one hand, as McRae and Wolak (2009) noted:
A firm’s management has a fiduciary responsibility to its shareholders to take all legal actions to maximize the profits it earns from participating in the wholesale market. On the other hand
consumers have to pay the additional cost. But whatever view one takes on the practices, regulators and policy makers, and the community in general should be aware of what is going on.
What about other types of producers? In this paper we provide detailed evidence of how one class
of producers, nuclear power plants, have modified their behavior from an almost “pure merit order” approach to strategic bidding. Preliminary work suggests that all classes of producers, thermal plants and even hydro plants, have adopted similar strategic bidding strategies. Tables 4, 5 & 6 show the bids made by a typical CCGT and a major hydro producer respectively from the seventh hour (H7) until H13 on the 1st and 2nd January, 2011. The tables give the prices (top line) and the quantities that were offered at each price on those two days (lower line). Looking at Table 4, we see that from midnight until H7, the CCGT offered all its production (408.6 MW) at the market maximum price of 180.3 euro (that is, it did not want to produce). From then on it ramped up. At H8, it offered 150 MW at zero cost, and the rest at the maximum price. From H9 onward it offered its production at 7 different production ranging from 0 euro up to 20 euro, then the rest at 180.3 euro. Note how the quantities vary from one hour to the next on the same day even if the prices remain the same, and secondly that the prices change from one day to the next. Clearly it is not bidding all its production at its marginal production cost. At first we were surprised to find the plants offering their production at Difference 200.2 M€ 172.2 M€ 221.6 M€
14
the maximum market price when they clearly would not be called to produce. According Espinosa (2013b), Spanish power plants receive a capacity payment (designed to encourage investment and availability) in addition to the market price for any power that they offer to sell via the day-ahead market. This would give them a strong incentive to make the offer, even if they were not really interested in producing. Looking at Tables 5 & 6 we see a very similar pattern of bids at 11 or 12 prices ranging from 0 to 145 euros. The main difference is that the prices provide better coverage of the effective day-ahead prices.
Implica tions for agent-based simulat ions Most agent-based simulati ons of wholes ale electrici ty market s assume that power plants offer their product ion at the margin al product ion cost. As is well-known this optimizes social welfare. This study shows that while producers may have been bidding according to the “merit order”, they certainly are not now. Moreover it provides guidelines for more realistic behavior of the producers.
15 Table 4: Bids made by a typical CCGT on 1st and 2nd January 2011 from H7 to H13. From midnig ht until H7, the plant offered all its product ion (408.6 MW) at the market maxim um price of 180.3 euro (that is, it did not want to produce). From then on it ramped up. At H8, it offered 150 MW at zero cost, and the rest at the maximum price. From H9 onward it offered its production at 7 different production ranging from 0 euro up to 20 euro, then the rest at 180.3 euro. Note how the quantities vary from one hour to the next on the same day even if the prices remain the same, and secondly that the prices change from one day to the next. Clearly it is not bidding all its production at its marginal production cost. 7H 180.3€ (408.6) 0 0 0 0 0 0 8H 0€ (150) 180.3€ (258.6) 0 0 0 0 0 9H 0€ (256) 10€ (25.7) 12.50€ (25.7) 15€ (25.7) 17.50€ (25.7) 20€ (25.7) 180.3€ (15.1) 10H 0€ (256) 10€ (25.6) 12.50€ (25.6) 15€ (25.6) 17.50€ (25.6) 20€ (25.6) 180.3€ (15.6) 11H 0€ (256) 10€ (25.3) 12.50€ (25.4) 15€ (25.4) 17.50€ (25.4) 20€ (25.4) 180.3€ (16.7) 12H 0€ (256) 10€ (25.2) 12.50€ (25.2) 15€ (25.2) 17.50€ (25.2) 20€ (25.2) 180.3€ (17.6)
2 Jan 2011 PRICES & VOLUMES offered by a typical CCGT
7H 180.3€ (408.6) 0 0 0 0 0 0 8H 0€ (150) 180.3€ (258.6) 0 0 0 0 0 9H 0€ (256) 10€ (32) 13.33€ (32.1) 16.60€ (32.1) 20€ (32.1) 180.3€ (15.3) 0 10H 0€ (256) 10€ (31.7) 13.33€ (31.7) 16.60€ (31.7) 20€ (31.7) 180.3€ (16.8) 0 11H 0€ (256) 10€ (31.3) 13.33€ (31.2) 16.60€ (31.2) 20€ (31.2) 180.3€ (18.7) 0 12H 0€ (256) 10€ (30.8) 13.33€ (30.8) 16.60€ (30.8) 20€ (30.8) 180.3€ (20.4) 0
16
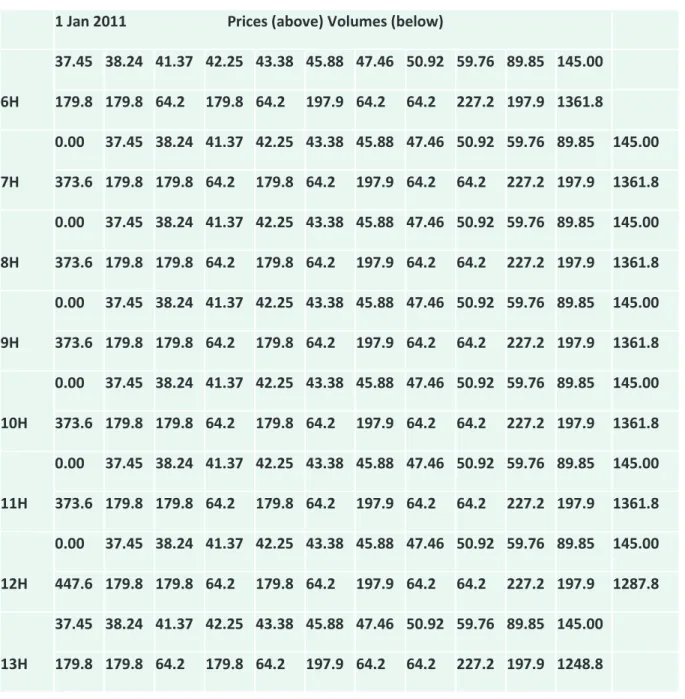
Table 5: Bids made by a major hydro producer on 1st January 2011 from H6 to H13. It offered its production at 12 different production ranging from 0 euro up to 145 euro. Note how the quantities vary from one hour to the next on the same day even if the prices remain the same, and secondly that the prices change from one day to the next.
1 Jan 2011 Prices (above) Volumes (below)
6H 37.45 38.24 41.37 42.25 43.38 45.88 47.46 50.92 59.76 89.85 145.00 179.8 179.8 64.2 179.8 64.2 197.9 64.2 64.2 227.2 197.9 1361.8 7H 0.00 37.45 38.24 41.37 42.25 43.38 45.88 47.46 50.92 59.76 89.85 145.00 373.6 179.8 179.8 64.2 179.8 64.2 197.9 64.2 64.2 227.2 197.9 1361.8 8H 0.00 37.45 38.24 41.37 42.25 43.38 45.88 47.46 50.92 59.76 89.85 145.00 373.6 179.8 179.8 64.2 179.8 64.2 197.9 64.2 64.2 227.2 197.9 1361.8 9H 0.00 37.45 38.24 41.37 42.25 43.38 45.88 47.46 50.92 59.76 89.85 145.00 373.6 179.8 179.8 64.2 179.8 64.2 197.9 64.2 64.2 227.2 197.9 1361.8 10H 0.00 37.45 38.24 41.37 42.25 43.38 45.88 47.46 50.92 59.76 89.85 145.00 373.6 179.8 179.8 64.2 179.8 64.2 197.9 64.2 64.2 227.2 197.9 1361.8 11H 0.00 37.45 38.24 41.37 42.25 43.38 45.88 47.46 50.92 59.76 89.85 145.00 373.6 179.8 179.8 64.2 179.8 64.2 197.9 64.2 64.2 227.2 197.9 1361.8 12H 0.00 37.45 38.24 41.37 42.25 43.38 45.88 47.46 50.92 59.76 89.85 145.00 447.6 179.8 179.8 64.2 179.8 64.2 197.9 64.2 64.2 227.2 197.9 1287.8 13H 37.45 38.24 41.37 42.25 43.38 45.88 47.46 50.92 59.76 89.85 145.00 179.8 179.8 64.2 179.8 64.2 197.9 64.2 64.2 227.2 197.9 1248.8
17
Table 6: Bids made by a major hydro producer on 2nd January 2011 from H6 to H13. It offered its production at 12 different production ranging from 0 euro up to 145 euro. Note how the quantities vary from one hour to the next on the same day even if the prices remain the same, and secondly that the prices change from one day to the next.
2 Jan 2011 Prices (above) Volumes (below)
6H 37.45 38.24 41.37 42.25 43.38 45.88 47.46 54.23 65.74 89.85 145.00 179.8 179.8 64.2 179.8 64.2 197.9 64.2 64.2 227.2 197.9 1482.8 7H 37.45 38.24 41.37 42.25 43.38 45.88 47.46 54.23 65.74 89.85 145.00 179.8 179.8 64.2 179.8 64.2 197.9 64.2 64.2 227.2 197.9 1482.8 8H 37.45 38.24 41.37 42.25 43.38 45.88 47.46 54.23 65.74 89.85 145.00 179.8 179.8 64.2 179.8 64.2 197.9 64.2 64.2 227.2 197.9 1414.8 9H 37.45 38.24 41.37 42.25 43.38 45.88 47.46 54.23 65.74 89.85 145.00 179.8 179.8 64.2 179.8 64.2 197.9 64.2 64.2 227.2 197.9 1414.8 10H 37.45 38.24 41.37 42.25 43.38 45.88 47.46 54.23 65.74 89.85 145.00 179.8 179.8 64.2 179.8 64.2 197.9 64.2 64.2 227.2 197.9 1414.8 11H 37.45 38.24 41.37 42.25 43.38 45.88 47.46 54.23 65.74 89.85 145.00 179.8 179.8 64.2 179.8 64.2 197.9 64.2 64.2 227.2 197.9 1414.8 12H 37.45 38.24 41.37 42.25 43.38 45.88 47.46 54.23 65.74 89.85 145.00 179.8 179.8 64.2 179.8 64.2 197.9 64.2 64.2 227.2 197.9 1414.8
18
Acknowledgements:
The data collection phase of this project was carried out by Asana Sasaki during her internship at Renault under the supervision of Frederic Novel-Cattin because of the importance of electricity prices for electric cars. We would like to thank the French agency for energy management, ADEME, for its support.
References
Borenstein, S. and J. Bushnell (1998) An empirical analysis of the potential market power in California’s electricity industricity, Power working paper PWP-044r, 51pp
Carbajo Josa, A., (2007) Garantia de Potencia, Seminario sobre ahorro y eficiencia energetica, UPM, held in Madrid, 15 Nov 2007, available from
http://www.fundacionenergia.es/PDFs/Ahorro%20Eficiencia%2011-07/Alberto%20Carbajo.pdf
Ciarreta, A. and M.P. Espinosa (2005) A Supply function Competition Model for the Spanish Wholesale Electricity Market,
Ciarret, A., M.P. Espinosa & C. Pizarro-Irizar, (2014) Is Green Energy Expensive? Empirical Evidence from the Spanish electricity market, Energy Policy 69 (2014) 205-215
CNE (2012) Propuesta del mecanismo por el que est establece el servicio de garantia de suministro, 5 Dec 2012, 44p
Cossent, R., T. Gomez and L. Olmos (2011) Large-scale integration of renewable and distributed generation in Spain: Current situation and future needs, Energy Policy 39 (2011) 8078-8087 Del Rio Gonzalez, P., (2008) Ten years of renewable electricity policies in Spain: An analysis of
successive feed-in tariff reforms, Energy Policy 36 (2008) 2917-2929
Economist (2013) Europe’s electricity providers face an existential threat, 12 Oct 2013
Espinosa, M.P. (2013a) An austerity driven energy reform, DFAE Working paper Series 2013-07, available from http://wwwdfaeii.ehu.es
Espinosa, M.P. (2013b) Understanding tariff deficits and its challenges, DFAE Working paper Series 2013-01, available from http://wwwdfaeii.ehu.es
Fabra, N. and J. Toro (2005) Price wars and collusion in the Spanish electricity market, Int J Industrial Organisation 23 (2005) 155-181
Fridolfsson, S-O. and T.P.Tangeras, (2009) Market power in the Nordic electricity wholesale market: A survey of the empirical evidence. Energy Policy, doi:10.1016/j.enpol.2009.04.036
Joskow, P.L. (2001) California’s electricity crisis, CEEPR Centre for energy and Environmental Policy Research, WP 001-006
McRae and Wolak, (2009) How do firms exercise unilateral market power? Evidence from bid-based wholesale electricity markets, Robert Schumann Centre for Advanced Studies, EUI Working Papers, 59pp
Rivier Abbad,J., (2010) Electric market participation of wind farms: the success story of the Spanish pragmatism, Energy Policy 38 (2010) 3174-3179
Saenz de Miera, G., P. del Rio Gonzalez and I. Vizcaino (2008) Analysing the impact of renewable electricity support schemes on power prices: The case of wind electricity in Spain, Energy Policy 36 (2008) 3345-3359
Tellidou, A.C. and A.G. Bakirtzis (2007) Agent-based analysis of capacity withholding and tacit collusion in electricity markets, IEEE Trans Power Systems, 22 (4) 1735-1742
19
Appendix 1: Bidding behavior of nuclear plants in 2002
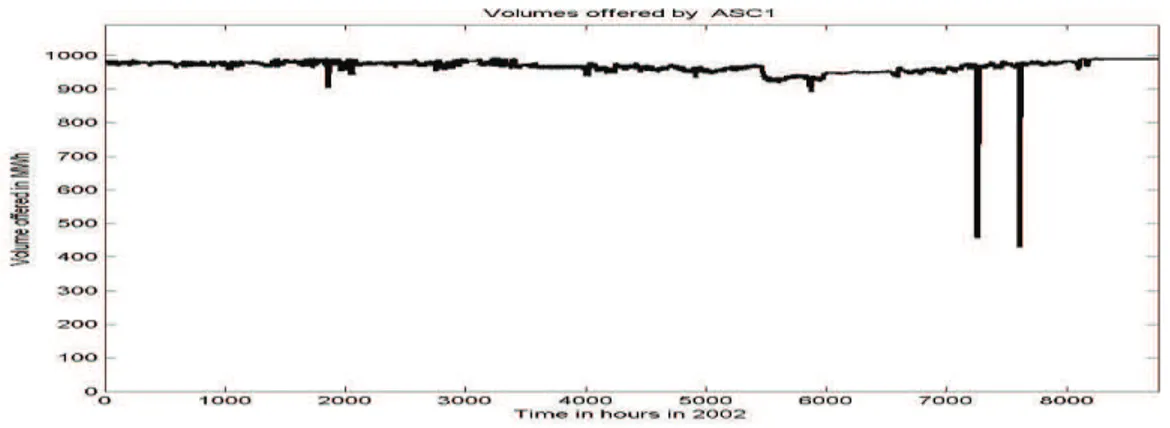
The production profile and the bidding structure of eight of the 9 nuclear power plants are presented. (The corresponding information for the ninth one ASC2 is shown in Figure 3). The first two plants, ASC1 and VAN2, are like ASC2. They offered all available electricity at zero cost except during planned maintenance and outages. See figures A1.1 and A1.2.
Figure A1.1 the nuclear power plant ASC1 offered all of its production at zero cost during 2002
Figure A1.2 the nuclear power plant VAN2 offered all of its production at zero cost during 2002. Note the planned maintenance early in the year
The next five nuclear plants (ALZ1, ALZ2, COF1, GAR1 and TRL1) offer almost all their production at zero cost and the rest (less than 3%) at the ceiling price for the market 180.3 euro per MWh. The last one (JCB1) offered 93% at zero and the remaining 7% at 150 euro per MWh. The bids at 150 euro and at 180.3 euro were not accepted.
20
Figure A1.3 the nuclear power plant ALZ1 offered almost all of its production at zero cost during 2002. Note the planned maintenance early in the year
Figure A1.4 the nuclear power plant ALZ2 offered almost all of its production at zero cost during 2002.
Figure A1.5 the nuclear power plant COF1 offered almost all of its production at zero cost during 2002. Note the outages in addition to the maintenance period.
21
Figure A1.6 the nuclear power plant GAR1 offered almost all of its production at zero cost during 2002.
Figure A1.7 the nuclear power plant TRL1 offered almost all of its production at zero cost during 2002.
Figure A1.8 the nuclear power plant JCB1 offered 93% of its production at zero cost during 2002.
22
Appendix 2: Bids just above and below the maximum day-ahead price of 91.01 euro per MWh in 2011
Table A2.1: Bids made at H20 on
Bid Price Volume Code Type
86.69 125.0 ALIMA LIMA (EDP)
86.78 17.0 CTJON1R Combined Cycle C.C.Castejon1 (REPR) 86.91 25.0 DANSV03 Dansk Import 87.49 74.4 SIL Hydro U.G.H. Sil 87.63 300.0 FOI1 Thermal C.T. Foix 88.09 59.4 CRC1 Thermal C.T Cercs 1 88.97 248.7 SRI3 Thermal C.T. Soto 3 89.07 76.3 SRI3 Thermal C.T. Soto 3 89.91 25.0 DANSV03 Dansk Import 91.00 41.0 ASC1 Nuclear C.N. Asco 1 91.01 22.0 GAR1 Nuclear C.N. Garona 91.01 32.1 VAN1 Nuclear C.N. Vandellos 2 91.01 28.7 ASC2 Nuclear C.N. Asco 2 91.02 419.7 PGR5 Thermal C.T. Puentes 5 91.02 2.5 LIT1 Thermal C.T. Litoral 91.02 0.3 PGR3 Thermal C.T. Puentes 3 91.02 1.1 PGR1 Thermal C.T. Puentes 1 91.02 1.1 PGR2 Thermal C.T. Puentes 2 91.02 0.9 PGR4 Thermal C.T. Puentes 4 91.02 62.1 LIT2 Thermal C.T. Litoral 2 91.71 54.5 DUER Hydro U.G.H Duer
92.3 26.4 STC4R Combined Cycle C.C. Santurce 4 92.45 605.2 ALG3 Thermal C.T Algeciras 3 92.87 488.0 BRR1 Thermal C.T. Los Barrios 1 94.24 84.7 SIL Hydro U.G.H. Sil
23 Table A2.2: Bids made at H22
Bid Price Volume Code Type Name 84.75 73.8 SIL Hydro U.G.H. Sil 85.50 40.6 AGUG Hydro U.G.H. Aguayo
89.00 30.0 TEMON Hydro Sistema Tejo-Mondego 90.00 83.5 VIES Hydro U.G.H.Viesgo
91.00 39.0 ASC1 Nuclear C.N. Asco 1 91.00 31.1 PGR1 Thermal C.T. Puentes 1 91.01 60.0 ELC1 Thermal C.T. Elcogas GICC 91.01 20.0 GAR1 Nuclear C.N. Garona 91.01 5.70 ASC2 Nuclear C.N. Asco 2 91.01 19.1 VAN2 Nuclear C.N. Vandellos 2 91.02 31.1 PGR2 Thermal C.T. Puentes 2 91.02 22.1 LIT3 Thermal C.T. Litoral 3 91.02 30.3 PGR3 Thermal C.T. Puentes 3 91.02 17.5 LIT1 Thermal C.T. Litoral 1 91.02 33.0 TER1 Thermal C.T.Teruel 1 91.02 30.9 PGR4 Thermal C.T. Puentes 4 91.02 33.0 TER2 Thermal C.T.Teruel 2 91.02 32.0 TER3 Thermal C.T.Teruel 3 91.02 24.0 CC03 Thermal C.T. Compostilla 3 91.02 17.0 COM4 Thermal C.T. Compostilla 4 91.02 7.0 CC02 Thermal C.T. Compostilla 2 91.02 16.0 COM5 Thermal C.T. Compostilla 5 92.30 26.4 STC4R Combined Cycle C.C. Santurce 4 93.20 16.9 CTJON2R Combined Cycle C.C. Castejon 2 95.7.0 412.0 CTN3 Combined Cycle C.C. Castellon 3