HAL Id: hal-01244786
https://hal-mines-paristech.archives-ouvertes.fr/hal-01244786v2
Submitted on 22 Jun 2016HAL is a multi-disciplinary open access
archive for the deposit and dissemination of sci-entific research documents, whether they are pub-lished or not. The documents may come from teaching and research institutions in France or abroad, or from public or private research centers.
L’archive ouverte pluridisciplinaire HAL, est destinée au dépôt et à la diffusion de documents scientifiques de niveau recherche, publiés ou non, émanant des établissements d’enseignement et de recherche français ou étrangers, des laboratoires publics ou privés.
Public Domain
MODERN MINING GEOSTATISTICS
CONVENTION WITH CODELCO YEAR 10 (2015)
-ANNIVERSARY REPORT
Serge Antoine Séguret, Francky Fouedjio, Ramon Freire, Sebastian de la
Fuente, Cristian Guajardo, Claudio Rojas
To cite this version:
Serge Antoine Séguret, Francky Fouedjio, Ramon Freire, Sebastian de la Fuente, Cristian Guajardo, et al.. MODERN MINING GEOSTATISTICS - CONVENTION WITH CODELCO YEAR 10 (2015) - ANNIVERSARY REPORT. [Research Report] R151215SSEG, Mines ParisTech; Center for geo-sciences. 2016, 117 p. �hal-01244786v2�
Convenio 2015 - Summary 1
MODERN MINING GEOSTATISTICS
CONVENTION WITH CODELCO YEAR 10 (2015)
ANNIVERSARY REPORT
(June 2016 version)
For the Ecole des Mines :
Serge Antoine Séguret, Francky Fouedjio
For CODELCO :
Ramon Freire, Sebastian de la Fuente, Cristian Guajardo, Claudio Rojas
December 2015
N° R151215SSEG
Mines ParisTech
Centre of Geosciences and Geoengineering
35 rue Saint Honoré
Convenio 2015 - Summary 2
Equipe Géostatistique
Visa Jacques Rivoirard
Serge Antoine Séguret
Global report of year 10 (2015). Contrat ARMINES/CODELCO Chile no. 10701 "Geostatistical consulting, tutoring, development and implementation contract". Décembre 2015. 117 pages.
Convenio 2015 - Summary 3
Introduction
During the 10th year of the convention between CODELCO and the Ecole des Mines of Paris, effort has been made to promote the work done previously by attending four congresses in three countries (Chile, France, Germany), two presentations being made by engineers of Codelco, namely Cristian Guajardo (Chuquicamata) and Sebastian de la Fuente (Radomiro Tomic).
In comparison to previous years, this anniversary report is presented as a catalog containing the papers and the relevant oral presentations with comments. For Mine-Planning and Geomin, no paper was published.
This report is not confidential and can be distributed in the good will of Codelco managers and engineers.
Content
A Geostatistical comparison between blast and drill holes in a porphyry copper deposit àpage 5
B The oral presentation with comments of “Geostatistical comparison between blast and drill
holes in a porphyry copper deposit”
àpage 15
C The oral presentation with comments of “Diamond Drill Holes, Blast Holes & Cokriging” àpage 35
D The oral presentation with comments of “Anisotropy of the Rock Quality Designation
(RQD) & its Geostatistical Evaluation”
àpage 55
E Geostatistical Evaluation of Rock-Quality Designation and its link with Linear Fracture
Frequency
àpage 77
F The oral presentation with comments of “Geostatistical Evaluation of Rock-Quality
Designation and its link with Linear Fracture Frequency”
àpage 87
G Breccia Pipe Prediction: a new approach using non-stationary covariance àpage 107
Convenio 2015 – A - “Blast and drill hole...”, the paper 5
Chapter A
Geostatistical comparison between blast and
drill holes in a porphyry copper deposit
(June 2016 version)
Serge A. Séguret (Mines ParisTech, France)
A paper presented at WCSB7, 7
thworld conference on sampling and blending,
10-12 June, Bordeaux, France
Abstract
Diamond drill-hole grades are known to be of better quality than those of blast holes; is this true? We present a formal study of a porphyry copper deposit in Chile where the variogram of 3 meter long drill hole samples is compared to 15 meter long blast hole ones and we show that the blast holes can be assumed to regularizing the point information deduced from the drill holes, except for a nugget effect specific to the blast samples. Complementary analyses based on migrated data show that the drill holes also have their own errors.
After a brief description of the first steps in the blast sampling protocol, we show, by using extension variance concepts, that the blast error is not due to the arbitrary removal of material from the sampling cone produced by drilling.
The present study establishes a formal link between blast and drill holes which leads to linear systems:
· Removal by kriging of the blast (or the drill) error;
· Deconvolution of the blast measurements to transform them into point ones; · Block modeling where drill and blast holes are used together.
In the paper, we thought it useful to detail some calculations and give some key formulas so that the reader can eventually adapt to other comparisons such as diamond drill holes compared to reverse circulation drill holes. Overall, this study shows how to combine measurements known on two different supports, a very complex challenge.
S. A. Séguret “Blast & Drill holes...” Draft author. Final paper in: Proceedings of the 7th International Con-ference on Sampling and Blending , Kim H. Esbensen Editor, IMP publications, DOI 10.1255/t0sf.51
Geostatistical comparison between blast and drill holes in a porphyry
copper deposit
(June 2016 version)
Serge Antoine Séguret
MINES ParisTech, Center for Geosciences/Geostatistical team, 35 rue Saint Honoré, 7730 Fontainebleau, France. E-mail: [email protected]
Serge has worked for more than thirty years in the famous laboratory founded by Georges Matheron in 1968 at Fontainebleau, where the major developments of Geostatistics have been achieved. For the last ten years, he has been heavily involved in mining operations via a long term collaboration with Codelco (Chile) and Vale (Brazil).
Abstract
Diamond drill-hole grades are known to be of better quality than those of blast holes; is this true? We present a formal study of a porphyry copper deposit in Chile where the variogram of 3 meter long drill hole samples is compared to 15 meter long blast hole ones and we show that the blast holes can be assumed to regularizing the point information deduced from the drill holes, except for a nugget effect specific to the blast samples. Complementary analyses based on migrated data show that the drill holes also have their own errors.
After a brief description of the first steps in the blast sampling protocol, we show, by using extension variance concepts, that the blast error is not due to the arbitrary removal of material from the sampling cone produced by drilling.
The present study establishes a formal link between blast and drill holes which leads to linear systems: · Removal by kriging of the blast (or the drill) error;
· Deconvolution of the blast measurements to transform them into point ones; · Block modeling where drill and blast holes are used together.
In the following, we thought it useful to detail some calculations and give some key formulas so that the reader can eventually adapt to other comparisons such as diamond drill holes compared to reverse circulation drill holes. Overall, this study shows how to combine measurements known on two different supports, a very complex challenge.
Data
The data comes from an open-pit copper mine in Northern Chile of which a 600x400x125 m3 sub domain is analysed (Figure 1) as it is almost homogeneously covered by around 3,000 drill-hole samples (3m long) and 13,000 blast-hole samples (15m long).
S. A. Séguret “Blast & Drill holes...” Draft author. Final paper in: Proceedings of the 7th International Con-ference on Sampling and Blending , Kim H. Esbensen Editor, IMP publications, DOI 10.1255/t0sf.51
Figure 1. Base maps of blast (black) and drill (red) measurements
Over this sub domain, the averaged copper grades of the blast and the drill holes are almost identical (around 0.6%). The variograms of blast and drill holes have similar behaviours (Figure 2), a high percentage of nugget effect (around 50%) and they differ mainly by their sills (0.12 for drill holes, 0.8 for blast holes), a comprehensible property as the blast support is larger.
Figure 2. (a) Drill hole copper grade variogram; (b) Blast copper grade variogram. Three directions are represented,
45° North (N45), 135° North (N135), and vertical (D-90). Black continuous line is the isotropic variogram
Methodology
The geostatistical comparison between the two types of measurements is decomposed into two steps: 1 Deconvolution & Convolution:
· Starting from the drill variogram, identifying the basic structures that model its behavior and deducing the underlying “point” variogram by deconvolution;
· Making the theoretical convolution of the point variogram on 15-meter long supports and checking that it correctly fits the vertical and horizontal blast variograms, except for an additional nugget effect of 0.2.
2 Migration & Cross variogram
· As there is no point where both drill and blast measurements are known, we make some blast holes migrate to drill hole locations and calculate the cross variogram;
· The objective is to measure the nugget effect shared by the two types of measurements.
There are not enough drill samples to distinguish between horizontal and vertical drill variograms (they are drilled along many different directions). This is the first reason why an omnidirectional variogram will be considered for the drill samples, the second one is that all the formulas at our disposal require isotropy.
Consequently, we make two comparisons between:
· An omnidirectional drill variogram and a vertical blast one; · An omnidirectional drill variogram and a horizontal blast one.
The distinction is important because the formulas differ between the two cases.
General formulas
All the formulas have been known for a long time in the literature, but in different places, and some are not even published. For the convolution charts, the most useful reference is probably 1; for the complete fundamental formulas, refer to 2. Concerning the extension formulas, refer to 3.
S. A. Séguret “Blast & Drill holes...” Draft author. Final paper in: Proceedings of the 7th International Con-ference on Sampling and Blending , Kim H. Esbensen Editor, IMP publications, DOI 10.1255/t0sf.51
support “l” (the distance “h” being large in comparison with the dimension of the support):
( )
lh
( )
( )
( )
(
h
-
( , )
(
(
l l
(1) with 2 0 01
( , )
(
)
l ll l
u
v dudv
l
=
ò ò
g -
(2)!"(#, #) is the average of the point variogram when both extremities of vector h describe the support independently. In (2), 1D inte-grals are used because the core diameters are small compared to the lengths.
The way this formula is applied depends on the structure of the point variogram (spherical, exponential, linear, etc…) but also on the calculation direction compared with the regularization direction. In the following, we consider two situations:
· The calculation direction is parallel to the regularization direction, notationgl//( )h ; · The calculation direction is perpendicular to the regularization direction, notationgl^( )h .
For the structures with a range, whether asymptotically (Exponential, Gaussian) or real (Spherical), we have:
range of
(h)
l = range of(h)
+ l (3)Note that (3) is not compatible with approximation (1) which amounts to assigning to the regularized model the same range as that of the point model. So (1) is essentially useful for comparing the sills of regularized structures.
Step 1: deconvolution & convolution
Fitting the drill-hole variogram
Three basic structures are necessary: nugget, exponential, linear:
| | 2
(h)
(1
drill)
| |
h a
drill drill
C
drille
b
drillh
-= e
+
-
+
(4) with: 2 0.015 0.05, 0.05, 3 35 , 100drill Cdrill adrill m bdrill
e = = = =
S. A. Séguret “Blast & Drill holes...” Draft author. Final paper in: Proceedings of the 7th International Con-ference on Sampling and Blending , Kim H. Esbensen Editor, IMP publications, DOI 10.1255/t0sf.51
Nugget effect (or small-range structure) deconvolution & convolution
The attenuation of the nugget effect, whether “pure” or associated with a microstructure which reaches its sill long before the first variogram lags, is proportional to the ratio of the supports. In the present case study, the diameters of drill holes and blast holes are considered to be equal and we ratio the lengths but generally speaking, one has to consider the ratio of the volumes:
2 drill 2 blast drill blast l l e = e (5)
With ldrill=3, lblast=15, the nugget effect of the blasts must be five times smaller than that of the drills. For 2
0.05 drill
e = (Figure 2a) we obtaine2blast =0.01, a value three times smaller than the 0.03 value deduced from the blast variogram (Figure 2b). If one takes the blast nugget effect as a reference, the drill nugget effect should be 0.15, a quantity above the local sill of the variogram and not realistic.
Conclusion: the support cannot explain the differences between the nuggets of the blasts and of the drills. The blast nugget is too large.
Vertical variograms – Deconvolution & convolution
The calculation direction is parallel to the blast regularization direction ( i.e. vertical).
Exponential structure
If the practical drill range is 35m, the parameter associated with the underlying point exponential structure is expressed by (3):
0 0
3a =35 3- ®a =10.7
If g()denotes a variogram normalized by its sill, the underlying point sill C0 of the exponential structure is produced by (1):
0(1 (3,3))
drill
C =C - g
For the exponential structure, the charts in 1 yield:
0 (3,3) 0.087 C 0.055 g = ® = For l=15m, we deduce: 15 0(1 (15,15)) C =C - g and we obtain: 15 (15,15) 0.34 C 0.036 g = ® =
We will see later if these results correspond to the experimental blast variogram, but we must first look at the linear structure which completes the model (4).
Linear structure
For h>l we have, where b is the slope of the structure 1:
( , ) 3 l l l b
g = (6)
The slope b, which does not change with the support, is given by the drill samples and the difference between two supports l and l’ equals: ' ( , ) ( ', ') 3 l l l l l l b -g - g = (7)
S. A. Séguret “Blast & Drill holes...” Draft author. Final paper in: Proceedings of the 7th International Con-ference on Sampling and Blending , Kim H. Esbensen Editor, IMP publications, DOI 10.1255/t0sf.51
When l=0m and l’=3m, and with 0.015 100 drill
b = obtained by (4), the attenuation is 0.00015, a negligible quantity. When l=3m and
l’=15m, the attenuation is 0.0006, still negligible. In any case, the effect of the regularization on the linear structure is negligible. This
is due to the weak slope of the linear structure.
The combination of all the regularizations is shown in figure 4a where the dotted line represents the actual model and the red line the model we should obtain with a more realistic nugget effect. One can see that apart from the problem of the nugget effect, the variation range is acceptable, even if the linear part of the theoretical structure does not appear in the vertical experimental blast variogram.
Figure 4. In blue, the points of the experimental blast variogram; dotted line, the theoretical model for the blasts
deduced from the drills; in red, the theoretical model with a more realistic nugget effect (a) Theoretical regulari-zation parallel to the vertical blast variogram (b) Theoretical regulariregulari-zation perpendicular to the horizontal blast
variogram.
Horizontal variograms – Deconvolution & convolution
The calculation direction is perpendicular to the blast regularization direction (i.e. horizontal).
The same procedure is followed, the only difference is that approximation (1) is not acceptable and we have to use charts that produce the exact calculation (see 1, chart number 11).
We obtain figure 4b where the dotted line represents the actual model and the red line the model we should obtain with a more realistic nugget effect. The fit is good.
First conclusions
If we omit the problem of the nugget effect, we see that both blast and drill holes can be considered as a regularization of the same reality according to their respective supports. This result, which we did not dare to hope, surprised us pleasantly and shows that the measurements from the blast holes are not as bad as people often think, anyway the case for this company. But the approach followed up to now suffers from two uncertainties:
· The analyses are done independently. Imagine that all the blast locations have been shifted from a constant equal to the range (around 100m). In that case, the correlation between blast and drills will be zero while the same coherence prop-erties are maintained when making individual regularizations as previously;
· The analyses refer to the drill nugget assumed to be a “natural” micro structure; is this true?
To answer these questions, cross variograms must be calculated but we do not have any location with both measurements, so a migration is necessary.
S. A. Séguret “Blast & Drill holes...” Draft author. Final paper in: Proceedings of the 7th International Con-ference on Sampling and Blending , Kim H. Esbensen Editor, IMP publications, DOI 10.1255/t0sf.51
Migration
In order to obtain a significant number of measurements at the same location, around 1,000 blasts samples were migrated to drill locations when the migration distance did not exceed 10 meters. Figure 5a presents the scatter diagram between the migrated values and the drill ones. The correlation coefficient is low (0.4) because the nugget effects are large.
Figure 5. (a) Scatter diagram between migrated blasts and drills; (b) Direct variogram of migrated blasts (black
triangles), corresponding drills (red points) and cross-variogram of both (blue stars). The cross variogram reveals a tiny negative nugget effect with no comparison with the drill or blast ones
On Figure 5b, points (resp. triangles) present the migrated blast (resp. drill) variograms. They differ slightly from the previous ones because the number of samples is smaller and the migration affects the results. In the same figure, the stars represent the cross variogram which does not show a significant nugget effect, possibly a small negative one without any magnitude in common with the effects encountered on the individual variograms.
Conclusions
It seems that the drill-holes have their own errors too, independent of the blast ones, and the two measurements share only the structured parts of the variogram: the exponential and linear structures.
Analyse of the blast error
Description of the blast sampling
Up to now the theoretical blast support has been set to 15m but in fact the blast drilling length is approximately 17m, producing a large cone from the floor of which around 5cm of material is removed by hand across the entire surface, the idea being to restore an overall volume of 15m. Without any consideration of the numerous sampling procedures, we stay at this stage and ask the question: could the error specific to the blasts be due to the arbitrary removal of material and the blast length variability?
Randomization of the blast support
Let l and l’ be two different supports. One finds in 3 the formula which expresses the variance of the difference between the two grades Y over l and l’, called “extension variance from l to l’, also equal to twice the variogram between the grades averaged over the two supports:
2 2 '
' ' '
( ( )l l( )) [( ( )l l( )) ]) 2 ll( ) 2 ( , )h ( , ) ( ', ')
S. A. Séguret “Blast & Drill holes...” Draft author. Final paper in: Proceedings of the 7th International Con-ference on Sampling and Blending , Kim H. Esbensen Editor, IMP publications, DOI 10.1255/t0sf.51
In (8), l’h represents the translation of the support l’ by a vector h. g( , )l l and g( ', ')l l represent the averaged variogram when
two points move independently along both the supports involved.
Suppose that l and l’ are randomly and independently selected uniformly in an interval, for example equal to [12.5m, 17.5m]. Then one has to calculate the mathematical expectation of (8) to obtain the resulting variogram. We have:
[ ( , )] [ ( ', ')] E g l l =E g l l (9) ' ' [ ll( )] [ ( , )]h [ ( , )] E g h =E g l l -E g l l (10)
(10) is the theoretical variogram that we want to compare to the actual experimental variogram in order to verify if the blast nugget could be associated with some support-length uncertainty.
'
[ ( , )]h
E g l l is a continuous function, complex to calculate as it depends on the mutual configuration of l and l’, but about which we know that for h greater than the range plus l, it reaches and stays at the sill of the underlying point variogram. In practice, the only structure that we consider is the exponential; its point sill is 0.055. For the interval of support-length uncertainty [12.5m, 17.5m],we deduce from (10) that the sill is reduced by a quantity obtained by:
17.5 12.5 1 [ ( , )] ( , ) E l l l l dl l g =
ò
g (11)To evaluate the range of variations, the integral (11) is approximated by a finite sum:
13,14,15,16,17 1 [ ( , )] ( , ) 5l E l l l l = g »
å
g (12)We use the same charts as previously to calculate the values of g( , )l l involved and finally (12) yields: 1
[ ( , )] 0.055 (0.295 0.305 0.325 0.337 0.352) 0.055*0.323 5
E gl l » + + + + = (13)
Notice that even if we randomize the blast support over a larger interval still centered around 15m, the variance reduction does not change and stays approximately equal to the sill multiplied by 0.325. If we suppose that the support fluctuation is not symmetric around 15m, but around 13m for example, the multiplicative factor for the sill reduction decreases to 0.295. In any case, we con-clude that:
· The uncertainty on the support length does not produce a nugget effect but a variance reduction; · This variance reduction represents approximately 30% of the underlying variogram sill ;
· The arbitrary removal of the material, as well as the uncertainty on the blast length, cannot explain an error specific to the blasts and necessarily linked to the subsequent sampling procedures.
Summary: a formal link between blast and drill holes
Formal link Finally, we have: 15 ( , , ) ( , , ) ( ) ( , , ) blast m Y x y z =Y x y z *p z +R x y z (14) with
Y(x,y,z), the point grade assumed to be isotropic and devoid of any measurement error; “*” denotes a convolution product;
15 15 ( , , ) m( ) ( , , ) m( ) Y x y z p z Y x y u p z u du +¥ -¥ * =
ò
- ;S. A. Séguret “Blast & Drill holes...” Draft author. Final paper in: Proceedings of the 7th International Con-ference on Sampling and Blending , Kim H. Esbensen Editor, IMP publications, DOI 10.1255/t0sf.51
15 15 [0, ] 2 1 ( ) 1 (| |) 15 m p z = z ; 15 [0, ] 2
1 (| |)z the indicator function equal to 0 outside the interval and 1 inside it;
R(x,y,z), a “white noise” residual statistically and spatially independent from Y(x,y,z) and representing the blast error
The variogram of Yblast(x,y,z) becomes:
15 ( ) ( ) ( ) blast h m h R h g = g + g (15) with ( ) R h
g , the nugget effect due to the blast error, having the variance s2R;
15m( )h ( P15m)( ) (h P15m)(0)
g = g * - g * ;
( )h
g , the point variogram, assumed to be isotropic;
15 2 [0,15] 1 ( ) ( ) ( | | 15)1 (| |) 15 m P h = *p p h = - h + h 15 1 ( ) ( ) 1 ( ) ( ) ( )
The model supposes that the blasts and the drills have the same average because the independent residuals are of zero mean. It must be verified when using this model. It is approximately the case here (0.63 for the drills, 0.69 for the blasts).
Removing the blast error by kriging
Model (14) can be used to remove the blast error by “Factorial Kriging” estimation5. One can easily build a linear system applicable to each blast measurement, choosing a local neighborhood of surrounding blast samples. The system is presented symbolically by using matrix formalism:
$!%&'+ !* 1
1 0- ./23 = .!%&'+ 4*
5
1 3
In this system, gRdisappears from the second member of the linear system whereby we remove, from the estimation, the part
associated with the measurement error. It does not mean that in the remaining part 6! 7 8%&' there is no nugget effect; it means that only the “natural” part remains. In our case, the complete nugget effect has to be removed because blasts and drills do not share any micro-structure.
Deconvolution by kriging
It may be interesting to remove the effect of regularization on the blast using a kriging system which estimates, for each blast measurement, a “point” value while simultaneously removing the part of the nugget effect associated with blast errors:
$!%&'+ !* 1
1 0- ./23 = .! 7 9%&': (! 7 9%&')(0) + 4*
5
1 3
The difference with the previous system is that in the second member, ! 7 8%&' (capital “8&'”) is replaced by:
15m( ,x y, z) ( ,x y, ) 15m( z )
p h h h h h u p h u du
+¥ -¥
g * = g
ò
- (small “p”).Block estimate by cokriging drill and blast measures
Finally, one can imagine locally renewing the mine planning block model by using blasts and drills together through a cokriging system with a linked mean (same average for both measurements):
;!<',%&'!<' !!%&'<',%&'+ !* 11
1 1 0> ; / /? 2> = ; ! 7 9<'7 9@: (! 7 9<'7 9@)(0) ! 7 9%&'7 9@: (! 7 9<'7 9@)(0) + 4*5 1 >
S. A. Séguret “Blast & Drill holes...” Draft author. Final paper in: Proceedings of the 7th International Con-ference on Sampling and Blending , Kim H. Esbensen Editor, IMP publications, DOI 10.1255/t0sf.51
These systems were tested on a realistic simulation where the truth is known; they produce good results which will be published in the near future.
Conclusion
In this deposit – and more generally, in this company (other test have been done), diamond drill hole grades and blast hole grades are consistent in the sense that, apart from the nugget effect, the structured part of their respective variograms follow the theoretical laws of regularization.
Concerning the nugget effects, we discover, by cross-analyses, that there is no natural micro-structure in the underlying point grade and the large nugget effects encountered on the variograms (approximately 50% of the variance for blasts and drills) are due to blast and drill measurement errors, independent of either measurement type.
The analysis of the blast error leads to the conclusion that the error is not due to the first step of the sampling procedure, it has to be found later in the process.
As a conclusion, some linear systems are proposed for removing the nugget effects from the data, reducing the effect of convolution and, more importantly, using blasts and drills together for the short-term mine planning. These systems, among numerous different potential ones, easy to demonstrate, result directly from the formal link established here between blast and drill holes. Before using these systems, the link must be verified by adhering to the methodology presented here.
Acknowledgements
The author would like to thank CODELCO Chile, for its strong support in the implementation of good geostatistical practices along the copper business value chain. I warmly thank the Editor for his excellent recommendations which improved the manuscript. Many thanks to Sebastian de La Fuentes and the complete team of R&T. Without them, nothing would have been possible.
References
1. A.G. Journel, Ch. J. Huijbregts, “Mining Geostatistics”, 5nd Edn. The Blackburn Press (1991).
2. J. Serra, « Echantillonnage et estimation locale des phénomènes de transition miniers ». Doctoral thesis, Faculté des Sciences de Nancy (1967).
3. G. Matheron, « Les Variables Régionalisées et leur estimation ». Masson et Cie Editeurs (1965).
4. S. A. Séguret, “Spatial sampling effect of laboratory practices in a porphyry copper deposit”. Proceedings of the 5th world conference on Sampling and Blending, Santiago, Chile (October 2011).
Convenio 2015 – B – “Blast and drill holes...”, the oral presentation 15
Chapter B
The oral presentation with comments of
“Geostatistical comparison between blast and
drill holes in a porphyry copper deposit”
(June 2016 version)
Serge A. Séguret (Mines ParisTech, France)
Presented at WCSB7, 7
thworld conference on sampling and blending, 10-12
June, Bordeaux, France
Good morning everybody.
I am pleased to present you the work entitled
“GEOSTATISTICAL COMPARISON BETWEEN BLAST AND DRILL HOLES IN A PORPHYRY COPPER DEPOSIT ».
This work is supported by the Chilean company Codelco, which produces copper, and the Paris School of Mines where I have worked for over thirty years in the Geostatistical laboratory founded by Georges Matheron at Fontainebleau.
Sampling 2015 - Bordeaux - France
S A Séguret
Typically in open pit mines, geologists, mining engineers, metallurgists, have at their disposal two types of measurements for the grades:
A first type, from drill holes – “diamond drill holes” in our case. A second type, from the blast holes.
2
Sampling 2015 - Bordeaux - France
S A Séguret
Because they are much more expensive, the diamond drill holes are less numerous than the blast holes, and it is usual to encounter sampling rates ranging from one over three to one over ten or worse.
Not only the sampling density is involved but also how samples are distributed in space too, as shown on the slide: • The circles, representing the drill holes, are widely spaced, see the left horizontal cross-section
• In the same figure, the green crosses, representing the blast holes, are more densely spaced
• Vertically, on the right-hand figure, it is the reverse, with almost continuous drill hole information while the blasts are more widely spaced
These differences make it even more difficult to compare the statistical properties of the two types of measurements, including when calculating directional variograms because statistical inference conditions are not the same
3
Sampling 2015 - Bordeaux - France
S A Séguret
Another difference concerns the way the measurements are used.
The long road that leads to the opening of the mine is marked by drilling campaigns, to achieve the block model that will condition the exploitation at large scale as well as for medium- and long-term planning. Typically, kriging and Geostatistics are used to build the model at this stage.
In addition, the blast holes are used for short term planning with no need of Geostatistics, a simple moving average is often used to estimate the block quantity of metal
These separate uses of two types of measurements that are supposed to represent the same thing raise questions about their relationship. In particular, would it not be possible to enrich the short-term estimate, now based only on blast holes, by adding the drill hole measurements?
4
Sampling 2015 - Bordeaux - France
S A Séguret
Finally, we often hear, without real justification, that the diamond drill holes are much better than the blast ones. We ask the questions:
• Better how? • Better for what? • Is it true?
5
Sampling 2015 - Bordeaux - France
S A Séguret
These are the reasons why this study is divided into three stages:
1 - Comparing the measurement qualities by comparing their variograms 2 - Establishing a formal link between the two measurements
3 – Deducing linear systems enabling us to use the two types of measurements together
6
Sampling 2015 - Bordeaux - France
S A Séguret
The data are from an open-pit copper mine in Northern Chile of where sub domain is analysed
because it is almost homogeneously covered by around 3,000 drill-hole samples (3m long) and 13,000 blast-hole samples (15m long)
7
Sampling 2015 - Bordeaux - France
S A Séguret
Blasts and drills differs by their sampling density, their support size and their orientation
Horizontally we have approximately one blast every 10 meters and vertically every 15 meters
For the drills, it is a bit more complex because they are not all vertical and the grid is not regular but we have approximately one drill hole every 50 meters horizontally, and every 3 meters along the drill hole.
3m is assumed to be the support of the drill samples; 15 meters is assumed to be the support of the
blast samples.
The global sampling ratio is approximately one drill sample to four blast samples
8
Sampling 2015 - Bordeaux - France
S A Séguret
The geostatistical comparison between the two types of measurements is divided into two steps:
Starting from the drill variogram, identifying the basic structures that model its behavior and deducing the underlying point-support variogram
Making the theoretical convolution of the point variogram on 15-meter long supports and comparing it to the blast variogram
It is important to distinguish two situations: variogram calculation parallel or perpendicular to the
regularization direction because the formulae are not the same
9
Sampling 2015 - Bordeaux - France
S A Séguret
These are the variograms.
On the left, the drill variogram, on the right, the blast one
We notice that the behaviors are similar and that they both contain a high percentage of nugget effect
10
Sampling 2015 - Bordeaux - France
S A Séguret
We do not detail here the calculations here, they are in the paper, we just show the charts to
be used.
They were done by hand forty-five years ago by a man called Jacky Laurent, who retired last year…
11
Sampling 2015 - Bordeaux - France
S A Séguret
3 structures were identified on the drill variograms, nugget effect, exponential and linear with a weak slope Then, an underlying point-support model was deduced
This model was theoretically regularized over 15 meters
___________________________________________________________________________________________ The bottom left-hand figure shows the vertical comparison. The dotted blue line represents the experimental vertical blast variogram, the dotted black line represents the present model and the red line the model we would obtain with a more realistic nugget effect.
One can see that apart from the problem of the nugget effect, the variation range is acceptable, even if the linear part of the theoretical structure does not appear in the vertical experimental blast variogram
The bottom right-hand figure shows the horizontal comparison. Again, apart from the nugget effect, the fitting is good. ________________________________________________________________________________________________ The first conclusion is that if we omit the problem of the nugget effect, we see that both blast and drill holes can be considered a regularization of the same phenomena in accordance with their respective supports.
But the approach followed up to now suffers from two uncertainties: •The analyses are done independently.
•The analyses refer to the drill-hole nugget which we assumed to be a “natural” micro structure; is this true? To answer these questions, cross variograms must be calculated but we do not have any location with both measurements, so a migration is necessary.
12
Sampling 2015 - Bordeaux - France
S A Séguret
In order to obtain a significant number of measurements at the same location, around 1,000 blast
samples were migrated to drill locations when the migration distance did not exceed 10 meters.
The right-hand figure presents the variograms.
Red points indicatethe migrated blast variogram, black triangles show the drill variogram and the stars represent their cross variogram which does not show a significant nugget effect, possibly a small negative one without anything like the effects encountered on the individual variograms.
The conclusion is that the drill-holes have their own errors, independent of the blast ones, and the
two measurements share only the structured parts of the variogram: the exponential and linear structures.
13
Sampling 2015 - Bordeaux - France
S A Séguret
Finally we are able to establish a formal link between blast and drill measurements.
14
Sampling 2015 - Bordeaux - France
S A Séguret
… and this link makes it possible to deduce linear systems like this one where the way to use blast and drill together in a single system is defined.
Thus, it becomes possible to improve the block model, based on drill holes, by integrating the blast holes as they are.
It also becomes possible to predict the production of the following days more accurately.
15
One can also use this link to remove the blast error. The filter can be applied to each blast measurement, using a local neighborhood of surrounding blast samples. The system to be used is presented symbolically with a matrix formalism.
Such systems have been tested on a realistic simulation where everything is known (true point value, true block values, blast with or without errors).
The results will be shown at a congress next July in Northern Chile, but I can show you here one of the result concerning the filtering of the blast error by kriging.
For comparison, estimation is made by kriging with no filtering.
16
ØHere are the results
ØOn these scatter diagrams, the horizontal axis represents the true blast without any sampling error ØOn the left scatter diagram, the vertical axis is a usual kriging. The correlation with the truth is 0.65 ØOn the right, when the filtering is activated, the correlation increases to 0.9. Why?
ØBecause with filtering, the kriging neighborhood can incorporate the target point where the filter is applied. This point takes a high kriging weight (more than 65%). Although noisy, this point is closer to the truth than any average based on surrounding points which explains why the filter estimate is closer to the truth
Ø So finally, the advantage of this linear system is to enable the kriging neighborhood to incorporate the target point information
17
In this deposit – and more generally, in this company, diamond drill hole grades and blast hole grades are consistent in the sense that, apart from the nugget effect, the structured part of their respective variograms follows the theoretical laws of regularization.
Concerning the nugget effects, we discover, by cross-analyses, that there is no natural micro-structure in the underlying point grade and the large nugget effects encountered on the variograms
are due to blast and drill measurement errors.
In conclusion, some linear systems are proposed for removing the nugget effects from the data, and, more importantly, using blasts and drills together for short-term planning in mining.
These systems, among many other potential ones, easy to demonstrate, result directly from the formal link established here between blast and drill holes.
Before these systems are applied, the link must be verified according to the methodology presented
here.
18
Sampling 2015 - Bordeaux - France
S A Séguret
Thank you for your attention
O yes I must apologize in advance: I have exactly 40 minutes left to reach the train station and I hope the taxi I ordered is waiting for me. Please, do not be surprised if I run out of the room when finished. I am not ill, I am not running away from the issues, I just have a train to catch….
Any question?
19
Sampling 2015 - Bordeaux - France
S A Séguret
Convenio 2015 – C - Diamond Drill hole, Blast Hole& Cokriging 35
Chapter C
The oral presentation with comments of
“Diamond Drill Holes, Blast Holes
& Cokriging”
(June 2016 version)
Serge A. Séguret (Mines ParisTech, France)
Sebastian de La Fuente (Codelco, Chile)
A presentation made by S. DE LA FUENTE at Mine-Planning 2015, 4
thInternational Seminar on Mine Planning, July 8-10, 2015, Antofagasta, Chile.
(No opportunity for written papers at this congress)
Abstract
This talk is a geostatistical study of diamond drill holes and blast holes and their potential use together in a cokriging system.
Both measurements of a real copper deposit are formally compared, leading to a model where a blast hole can be considered as a regularization of the drill information up to a nugget effect characteristic of the blasts.
This formal link makes it possible to build a cokriging system that accounts for the different supports and leads to a block model based on blast and drill holes.
The model is tested on a realistic simulation where the true block grades, which are known, are compared to their estimate obtained by:
- Kriging using only drill holes; - Kriging using only blast holes;
- Cokriging using drill and blast holes together.
The first conclusion is that the best estimate is obtained when only blasts or blast and drill holes are used together, there is no significant difference, there are too many blasts. This justifies the usual practice consisting in basing the short-term planning on blasts only. But another conclusion appears when kriging is compared to moving average (another common practice), both based on blasts: depending on the number of data used in the neighborhood, the moving average produces a strong conditional bias, a useful reminder of the reason why Kriging was created more than fifty years ago.
Good morning everyone
It is my pleasure to present the work entitled
“Diamond Drill-Holes, Blast-Holes and Cokriging”
… a work supported by Codelco and the Paris School of Mines
36
DIAMOND DRILL HOLES, BLAST HOLES & COKRIGING
Typically in open pit mines, geologists, mining engineers, metallurgists, have at their disposal two types of measurements for the grades:
A first type, from drill holes – “diamond drill holes” in our case. A second type, from the blast holes.
Because they are much more expensive, the diamond drill holes are less numerous than the blast holes, and it is usual to encounter sampling rates ranging from one over three to one over ten or worse.
Not only the sampling density is involved but also how samples are distributed in space too, as shown on the slide:
• The circles, representing the drill holes, are widely spaced, see the left horizontal cross-section • In the same figure, the green crosses, representing the blast holes, are more densely spaced • Vertically, on the right-hand figure, it is the reverse, with almost continuous drill hole information while the blasts are more widely spaced
These differences make it even more difficult to compare the statistical properties of the two types of measurements, including when calculating directional variograms because statistical inference conditions are not the same
Another difference concerns the way the measurements are used.
The long road that leads to the opening of the mine is marked by drilling campaigns, to achieve the block model that will condition the exploitation at large scale as well as for medium- and long-term planning. Typically, kriging and Geostatistics are used to build the model at this stage.
In addition, the blast holes are used for short term planning with no need of Geostatistics, a simple moving average is often used to estimate the block quantity of metal
These separate uses of two types of measurements that are supposed to represent the same thing raise questions about their relationship. In particular, would it not be possible to enrich the short-term estimate, now based only on blast holes, by adding the drill hole measurements?
Finally, we often hear, without real justification, that the diamond drill holes are much better than the blast ones.
We ask the questions: • Better how? • Better for what? • Is it true?
37
DIAMOND DRILL HOLES, BLAST HOLES & COKRIGING
To answer these questions, we propose the following steps:
Ø We begin by summarizing a formal study of blast and drill-holes which was
presented some months ago at a sampling congress in Bordeaux, France ØThis study makes possible some linear systems likes:
• Removing the blast error by kriging
• Estimating point-support values using blast measurements • Bock modelling using blast and drill measurements together We test the different systems on a simulation
38
DIAMOND DRILL HOLES, BLAST HOLES & COKRIGING
ØThe data are from an open-pit copper mine in Northern Chile where a sub domain
was chosen for analysis because it is almost homogeneously covered by around
3,000 drill-hole samples (3m long) and 13,000 blast-hole samples (15m long)
ØThe geostatistical comparison between the two measurement types is divided into two steps:
• Starting from the drill variogram, identifying the basic structures that model its behavior and deducing the underlying point-support variogram
• Making the theoretical convolution of the point variogram on 15-meter long
supports and comparing it to the blast variogram
Ø It is important to distinguish two situations: variogram calculation parallel or perpendicular to the regularization direction because the formulae are not the same
Ø Comparisons are completed by cross analyses based on migrated data.
39
DIAMOND DRILL HOLES, BLAST HOLES & COKRIGING
Ø3 structures were identified on the drill variograms, nugget effect, exponential and linear with a weak slope
Ø The upper left-hand figure shows the vertical comparison. The dotted blue line represents the experimental vertical blast variogram, the dotted black line represents the present model and the red line the model we would obtain with a more realistic nugget effect. One can see that apart from the problem of the nugget effect, the variation range is acceptable, even if the linear part of the theoretical structure does not appear in the vertical
experimental blast variogram
Ø The upper right-hand figure shows the horizontal comparison. Again, apart from the nugget effect, the fitting is good.
ØIf we omit the problem of the nugget effect, we see that both blast and drill holes can be considered a regularization of the same phenomenon in accordance with their respective supports.
ØIn order to obtain a significant number of measurements at the same location, around 1,000 blast samples were migrated to drill locations when the migration distance did not exceed 10 meters (see bottom left-hand figure).
ØThe bottom right-hand figure presents the variograms. Red points indicate the migrated blast variogram, black triangles show the drill variogram and the stars represent their cross variogram which does not show a significant nugget effect, possibly a small negative one without anything like the effects encountered on the individual variograms.
40
DIAMOND DRILL HOLES, BLAST HOLES & COKRIGING
ØThe conclusion is that the drill-holes have their own errors, independent of the
blast ones, and the two measurements share only the structured parts of the
variogram: the exponential and linear structures
Ø In this deposit – and more generally, in this company - diamond drill hole grades and blast hole grades are consistent in the sense that, apart from the nugget effect, the structured part of their respective variograms follows the theoretical laws of regularization. This result may surprise but one must admit that it is impossible to say that grade measurements from drill holes are better than those from blast one:
• Yes, there is a reduction of variance for the blast, but this is due to the support which is larger
• In both cases, the ratio of nugget effect to the variance is around 40 percent Ø This result justifies the present practices where selectivity is based only on blasts Ø This formal link establishes that the blasts (respectively the drills) are considered as a regularization over 15 meters (respectively 3 meters) of the point-support copper grade “Y of x, y, z” plus a residual “R” proper to each type of measurement and independent of each other.
41
DIAMOND DRILL HOLES, BLAST HOLES & COKRIGING
Ø A refined simulation of point-support grades was done every meter horizontally
and every 20 centimeters vertically
Ø Then, 100 vertical drill holes were created by averaging, every 50 meters
horizontally, all the values along 3 meters vertically. In this way we obtain more than 4000 drill samples
Ø In the same way, more than 8000 15 meter-long vertical blast holes were produced with a horizontal spacing of 12 meters
Ø The true 15 meter cubic block value is found by averaging the more than 150
million point-support values contained in the block
Ø The sampling ratio is approximately one drill to three blasts and the domain covered by the simulation is 400 by 400 meters squarred horizontally and 100 meters vertically
42
DIAMOND DRILL HOLES, BLAST HOLES & COKRIGING
Ø The grades have an exponential variogram with a practical range of around 30
meters
Ø For simplification, the drills have no errors
Ø We add to the blasts a random noise with a nugget effect of 0.2, representing the blast sampling error
Ø The grades are realistic with 0 as minimum, 3.5 as maximum, an average equal to 0.63 as in the real deposit and the distribution has a correct right queued
Ø We verify that the sills of drill, blast and block variograms obey the laws of regularization
43
DIAMOND DRILL HOLES, BLAST HOLES & COKRIGING
Ø As we are in a stationary case, matrices are presented using covariance C, it is simplier
ØThe first test that we propose is to remove the blast error. This filter can be applied to each blast measurement, using a local neighborhood of surrounding blast samples.
ØThe system is presented symbolically with a matrix formalism. In the system, “gamma R” disappears from the second member of the linear system. In this way we remove from the estimation, the part associated with the measurement error.
ØGenerally speaking, this does not mean that in the remaining part “gamma star P”, there is no nugget effect, it means that only the “natural” part remains i.e. the part due only to the sampling error. In our case, we recall that there is no natural nugget effect
ØThe neighborhood must contain the sample from which the noise has been removed; otherwise, the filtering is not efficient.
ØFor comparison, the estimation is made by kriging with no filtering, using the same neighborhood (but without the target sample this time, otherwise kriging will give back the value of the data point).
ØWe select, among all the simulated blasts, a subset of around 1000 samples on which estimations will be conducted, using the additional samples (in case of ordinary kriging) and all the samples in case of nugget filtering.
ØThe reference is the “truth” i.e. the blast without errors which we know because we work on a simulation where everything is known
44
DIAMOND DRILL HOLES, BLAST HOLES & COKRIGING
ØHere are the results
ØOn these scatter diagrams, the horizontal axis represents the true blast without any sampling error
ØOn the left scatter diagram, the vertical axis is a usual kriging. The correlation with the truth is 0.65
ØOn the right, when the filtering is activated, the correlation increases to 0.9. Why? ØBecause with filtering, the kriging neighborhood can incorporate the target point where the filter is applied. This point takes a high kriging weight (more than 65%). Although noisy, this point is closer to the truth than any average based on
surrounding points which explains why the filter estimate is closer to the truth
Ø So finally, the advantage of this linear system is to enable the kriging neighborhood to incorporate the target point information
45
DIAMOND DRILL HOLES, BLAST HOLES & COKRIGING
Ø Now we propose a second test
Ø It can be interesting to remove the effect of regularization on the blast with a kriging system that estimates, for each blast measurement, a “point” value, while simultaneously removing the part of the nugget effect associated with blast errors.
Ø The difference with the previous system is that in the second member of the system, the capital letter for “P” - a two-time convolution - is replaced by a small “p” – a one-time convolution
ØA comparison is made with the true point value, and with previous estimates
(estimating a blast with or without nugget effect).
46
DIAMOND DRILL HOLES, BLAST HOLES & COKRIGING
Ø In the three scatter diagrams, the horizontal axis represents the true
point-support value
Ø The upper left scatter figure presents the result when a deconvolution is made, together with error filtering. The correlation with the true value is good, it equals 0.85
Ø The upper right-hand figure presents the result of the error removal with no deconvolution. It corresponds to the previously presented system but this time as compared with the point support value, the reason why the correlation equals 0.8
and not 0.9 when compared to the blast values. In comparison with the left-hand
figure, the deconvolution increases significantly the accuracy of the estimation
Ø The bottom figure shows the results when no filtering and no deconvolution isdone. The correlation is very low, it equals 0.55. The reason is the same as in the previous case. Filtering and/or deconvolution can use the target points where the
filter is applied
47
DIAMOND DRILL HOLES, BLAST HOLES & COKRIGING
Ø The third test is made to locally renew the mine planning block model by using
blasts and drills together
Ø In the figure, red points represent the drill samples, green crosses the blast samples. The final estimation is a combination of the two measurements.
ØThis is a cokriging system with linked mean because drills and blasts have the same average, which is mandatory for carrying out all these calculations
ØThe objective is estimating the average grade at the block scale V Ø We compare with the other systems:
•Block grade estimate by kriging using only drill holes •Block grade estimate by kriging using only blast holes
48
DIAMOND DRILL HOLES, BLAST HOLES & COKRIGING
Ø Here are the results. For the three scatter diagrams, the horizontal axis is the true
block grade
Ø The upper left diagram is the result obtained by ordinary kriging using drills; upper right diagram the result when using blasts. The jump by the correlation coefficient from 0.4 (OK using drills) to 0.9 (OK using blasts) is impressive . Even if the blasts are regularized over 15m, the fact that they are more numerous and respect the
variogram (up to a nugget effect) justifies their use when possible, instead of the drills, and the use of the blasts in selection for mining operations
ØThe bottom diagram concerns cokriging using blast and drill together. The
performance is similar to Ordinary Kriging using only blasts. In our case cokriging is not useful because the blasts are so numerous and of such good quality that adding a drill contribution does not improve the results
ØNotice that the nugget effect of the blasts has no impact on the results because with a block estimate, the average of the variograms is obtained by a random sampling of the block which neutralizes the nugget effect.
49
DIAMOND DRILL HOLES, BLAST HOLES & COKRIGING
Actually, the short term planning is based on average using the blast included in the
block, so question is asked to see if kriging can give some improvement. We are
comparing three experiments:
- Ordinary Kriging using 24 surrounding blasts measures (previous work);
- Moving average using the same 24 surrounding blast measures; - Moving average using 4 blast measures of the same level.
Using the same data points, replacing Ordinary kriging by an average reduces the correlation with the truth from 0.884 to 0.741. This is a very important reduction
which should indicate the practitioners to use kriging.
Now, if practitioners want to keep their habits, one can see that when using only four points, the result is better that when using 24 points because the smoothing is less important: the correlation with the truth goes from 0.741 to 0.839, a
performance still under the performance when using kriging.
50
DIAMOND DRILL HOLES, BLAST HOLES & COKRIGING
But using so few points is risky for conditional bias reasons. To illustrate this concept,
let us consider again the previous scatter diagram, but this time with the truth for
the vertical axis and the curve of the mathematical expectation of the truth given different estimates. We focus on the most representative [0.3, 1] range of grades. The red curves represent the discrete calculation of the conditional expectation of the truth, given the different estimates.
When doing kriging using 24 points , the conditional expectation curve is close to the first diagonal and when we select the block according to their estimates, we get in average what we expect, with perhaps a tiny tendency to underestimate the high grades.
When we replace kriging by a moving average using 24 points, we are still close to the diagonal, with a tiny tendency to overestimate the low grades and
underestimate the high grades.
When we still do a moving average, but with only 4 points this time , the conditional bias appears clearly: in the range of the low grade, we systematically underestimate the average grade of the blocks and can decide to classify as waste blocks which are in practice richer than expected. Reversely, in the range of the high grades, this moving average with only 4 points systematically overestimates the average grade of the block so that we classify as rich blocks which must be considered as waste. This is for all these reasons that one must use enough points in the kriging
neighborhood (let us say at least 20), and reason why kriging and Geostatistics have
been created, more than 50 years ago. It is perhaps useful to recall it here.
51
DIAMOND DRILL HOLES, BLAST HOLES & COKRIGING
The study of a porphyry copper deposit showed a formal link between blast and drill
holes, leading to numerous linear systems able at least to:
- Filter the blast error - Blast deconvolution
- Block modelling using blasts & drills
Tested on a simulation, these systems has proven their interest, as well as the danger to replace kriging by a moving average, especially when using few points.
52
DIAMOND DRILL HOLES, BLAST HOLES & COKRIGING
53
DIAMOND DRILL HOLES, BLAST HOLES & COKRIGING
Convenio 2015 – D - Anisotropy of RQD... 55
Chapter D
The oral presentation with comments of
“Anisotropy of the Rock Quality Designation
(RQD) & its Geostatistical Evaluation
Serge A. Séguret (Mines ParisTech, France)
Cristian Guajardo (Codelco, Chile)
Claudio Rojas (Codelco, Chile)
A presentation made by C. Guajardo at Geomin 2015, 4
thInternational Seminar
on Geology for the Mining Industry, July 8-10, 2015, Antofagasta, Chile.
(No opportunity for written papers at this congress)
Abstract
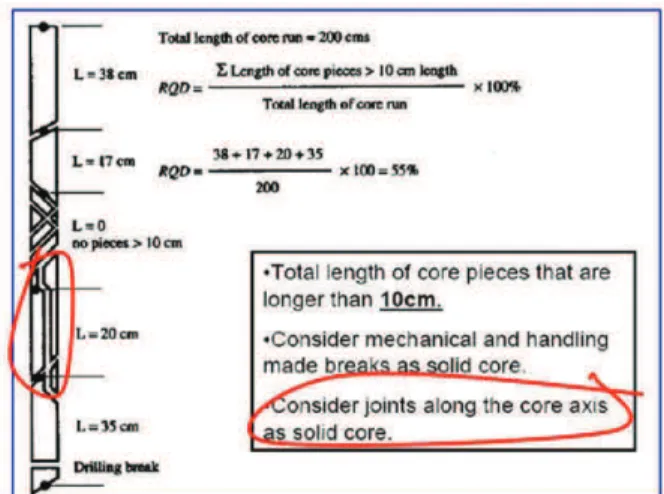
Rock Quality Designation (RQD) measures the borehole core recovery percentage incorporating only pieces of solid core that are longer than 100 mm measured along the centerline of the core. It is an important attribute used in geotechnics via Rock Mass Rating (RMR) for example.
This presentation concerns the behavior of this attribute in a Chilean porphyry copper deposit by analyzing more than 60,000 samples 1.5-meter long.
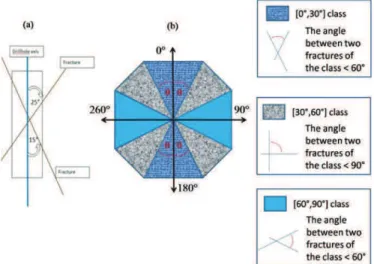
The drill holes have different directions and the nature of RQD requires accounting for the sample direction if the fracture network is anisotropic, a concept different from the geostatistical anisotropy which measures the variability along a direction set by two samples. A directional analysis is conducted and shows different variograms associated with different sample direction classes; this leads to different maps obtained by kriging, calling into question the usual practices that do not account for the sample direction. In fact, the directionality of the measurements makes RQD non additive (and not krigeable) if the samples used in the kriging neighborhood belong to different directional classes.
A discussion follows; pointing out that RQD is subject to the same directional bias as the Fracture Frequency (FF) and should be corrected in the same way by a sinus of the angle between the sample and the fracture (Terzaghi correction). But such a correction is difficult, if not impossible; tests are presented.
It is my pleasure to present the work done jointly by my collaborator Doctor Serge Séguret from France, and myself, on data provided by my team and by my colleague Claudio Rojas
The presentation is entitled
“ANISOTROPY OF THE ROCK QUALITY DESIGNATION & ITS GEOSTATISTICAL EVALUATION».
… a work supported by the Chilean company Codelco and the Paris School of Mines where Serge has worked for over thirty years in the Geostatistical laboratory
founded by Georges Matheron at Fontainebleau.
56 ANISOTROPY OF THE ROCK QUALITY DESIGNATION (RQD) & ITS
GEOSTATISTICAL EVALUATION
Here is the program that we propose to follow.
57 ANISOTROPY OF THE ROCK QUALITY DESIGNATION (RQD) & ITS
GEOSTATISTICAL EVALUATION
Geomin 2015 – Antofagasta - Chile
S A Séguret, C Guajardo, C Rojas
The aim of RQD is to measure the degree of jointing or fracturing in a rock mass. It is one of the main attributes incorporated in RMR which is a comprehensive index of rock-mass quality used for the design and construction of excavations in rock, such as tunnels, mines, slopes and foundations.
58 ANISOTROPY OF THE ROCK QUALITY DESIGNATION (RQD) & ITS
GEOSTATISTICAL EVALUATION
Geomin 2015 – Antofagasta - Chile
S A Séguret, C Guajardo, C Rojas
ØThe first question concerns the additivity of RQD i.e. the ability to estimate it at any location by a linear combination of measurements like kriging in geostatistics
ØSuppose that all the samples have been drilled along the same direction in space and take two values collected along two different supports L1 and L2, each with its own sum of core pieces longer than 10 cm, respectively equal to L1>10 and L2>10...
59 ANISOTROPY OF THE ROCK QUALITY DESIGNATION (RQD) & ITS
GEOSTATISTICAL EVALUATION
Geomin 2015 – Antofagasta - Chile
S A Séguret, C Guajardo, C Rojas
ØThe value of RQD over the support L1 and L2 is… Ø And when we develop, we obtain…
Ø This is by definition the way to combine additive quantities, equal to the average when L1=L2
Ø So kriging RQD is authorized, at punctual or block scale, using classical geostatistical tools when RQD is order-two stationary
Ø Although the calculation is easy, the interpretation is not: as RQD is a 1D
measurement, estimating it at block scale using 1D samples just gives the average behavior of 1D samples over a block, and this is not a 3D property
60 ANISOTROPY OF THE ROCK QUALITY DESIGNATION (RQD) & ITS
GEOSTATISTICAL EVALUATION