SDN/15/21
I M F S T A F F D I S C U S S I O N N O T E
The Fiscal Consequences of
Shrinking Populations
Benedict Clements, Kamil Dybczak, Vitor Gaspar,
Sanjeev Gupta, and Mauricio Soto
DISCLAIMER: Staff Discussion Notes (SDNs) showcase policy-related analysis and research being developed by IMF staff members and are published to elicit comments and to encourage debate. The views expressed in Staff Discussion Notes are those of the author(s) and do not necessarily represent the views of the IMF, its Executive Board, or IMF management.
The Fiscal Consequences of Shrinking Populations
Prepared by Benedict Clements, Kamil Dybczak, Vitor Gaspar, Sanjeev Gupta, and Mauricio Soto1
DISCLAIMER: Staff Discussion Notes (SDNs) showcase policy-related analysis and research being developed by IMF staff members and are published to elicit comments and to encourage debate. The views expressed in Staff Discussion Notes are those of the author(s) and do not necessarily represent the views of the IMF, its Executive Board, or IMF management.
JEL Classification Numbers: F22, H50, H68, J11, O40
Keywords:
Aging; Demographics; Public Debt; Pension Spending; Health Spending; Population Growth
Authors’ Email Address:
BClements@imf.org, KDybczak@imf.org,
VGaspar@imf.org, SGupta@imf.org, MSoto@imf.org
1 The authors would like to thank Bernardin Akitoby, Nathaniel Arnold, Helge Berger, Annalisa Fedelino, Davide Furceri, Thomas Helbling, Dora Iakova, Takuji Komatsuzaki, Jean-Marc Natal, Geremia Palomba, Joana Pereira, Nagwa Riad, Lucca Ricci, Christoph Rosenberg, Carlo Sdralevich, Ara Stepanyan, Junji Ueda, and Jerome Vandenbussche for their comments; and Nadia Malikyar, Jeffrey Pichocki, and Mileva Radisavljevic for their assistance.
CONTENTS
EXECUTIVE SUMMARY ________________________________________________________________________________ 4
INTRODUCTION _______________________________________________________________________________________ 5
LONG-TERM TRENDS: THE PROSPECT OF AGING, SHRINKING POPULATIONS, AND HIGHER AGE-RELATED EXPENDITURE ___________________________________________________________________ 6
THE IMPACT OF DEMOGRAPHIC UNCERTAINTY ON FISCAL SUSTAINABILITY ____________________ 9
A. Fertility ______________________________________________________________________________________________ 10 B. Mortality _____________________________________________________________________________________________ 12 C. Migration ____________________________________________________________________________________________ 13
POLICY OPTIONS TO ADDRESS THE FISCAL CHALLENGE OF SHRINKING POPULATIONS ______ 14
A. Policies that Affect Demographics and Labor Markets ______________________________________________ 14 B. Reforms to Age-Related Spending Programs _______________________________________________________ 20
CONCLUSIONS ______________________________________________________________________________________ 21 APPENDICES
1. The Impact of Population on Economic Growth _____________________________________________________ 23 2. The Impact of Growth on Fiscal Sustainability _______________________________________________________ 24 3. United Nation Population Projections—Main Assumptions _________________________________________ 26 4. Supplementary Figures and Tables __________________________________________________________________ 27
REFERENCES ___________________________________________________________________________________________ 29
BOXES
1. Impact of Demographic Changes on Pension and Health Care Expenditure _________________________ 8
2. The Economic Impact of Migration __________________________________________________________________ 19
FIGURES
1. Countries with Declining Population, 2015–2100 _____________________________________________________ 5 2. Old Age Dependency Ratio, 2015–2100 ______________________________________________________________ 5 3. Birth and Mortality Rates by Vintage of Projections, 1960–2015 ____________________________________ 10 4. Fertility Rate, 1955–2100 ____________________________________________________________________________ 11 5. Crude Mortality Rate, 1950–2100 ____________________________________________________________________ 13 6. Net Migration Rate, 1950–2100 _____________________________________________________________________ 14
TABLES
1. Global Public Expenditure on Age Related Programs, Baseline Scenario 2015–2100 _________________ 7
2. Impact of Demographic Uncertainty on Aging and Age-Related Programs for the More and Less Developed Economies, 2015–2100 ____________________________________________________________ 12
3. Impact of Selected Policy Options on Aging and Age Related Programs for the More Developed Economies, 2015–2100 ________________________________________________________________________ 16
4. Impact of Selected Policy Options on Aging and Age Related Programs for the Less Developed Economies, 2015–2100 ________________________________________________________________________ 17
EXECUTIVE SUMMARY
Shrinking populations pose a formidable fiscal challenge. Declining fertility and increasing longevity will lead to a slower-growing, older world population. In most countries, population is projected by the United Nations (UN) to peak sometime this century and decline thereafter. For the world, the share of the population older than age 65 could increase from 12 percent today to 38 percent by 2100. To some extent, this represents the culmination of a long-term demographic transition associated with technological progress as well as the rise in the demand for human capital which initially boosts populations (as observed for most of human history), but eventually leads to lower fertility. This, in turn, contributes to a more sustainable pattern of development and reduced pressures on the environment.
These developments would place public finances of countries under pressure, through two channels. First, spending on age-related programs (pensions and health) would rise. Without further reforms, these outlays would increase by 9 percentage points of GDP and 11 percentage points of GDP in more and less developed countries, respectively, between now and 2100. The fiscal
consequences are potentially dire: such spending increases could lead to unsustainable public debts, require sharp cuts in other spending, or necessitate large tax increases that could stymie economic growth. Second, declining populations can reduce economic growth and—if not accompanied by a commensurate reduction in interest rates—make it more difficult for countries to reduce their public debt as a share of GDP.
Projecting demographics is a risky business, and policymakers should be prepared to deal with an even faster transition to declining populations. Our fiscal projections rely on the UN’s medium demographic scenario and should be interpreted with caution, as in the past fertility and mortality have declined at a much faster pace than projected. The fiscal risks associated with this uncertainty are mammoth in the long term.
Given the magnitude of the needed policy response, a multi-pronged approach will be required:
Entitlement reform—starting now but at a gradual pace. Reforms should start now but be gradual in order to spread the burden across generations and to avoid policy reversals. Policies that affect demographics and labor markets. Boosting fertility rates could offset aging.
But, at the same time, the ability of public policies to control birth rates appears limited. Raising migration from the younger, less developed economies to the older, more developed
economies would ameliorate spending pressures and provide time to phase in reforms, but it remains a politically sensitive issue. Policies that increase labor force participation of women and the elderly hold promise.
Better tax systems and more efficient public expenditure. In many countries it will be impossible to fully offset the impact of demographics on age-related spending, thus necessitating broader public sector reforms to improve the public finances.
INTRODUCTION
1. With fertility rates falling across the globe, populations will start shrinking in many countries over the next few decades. According to the latest UN projections (2015 Revision of the UN World Population Prospects), the world’s population is projected to peak around 2100 and begin to shrink soon thereafter. Populations are already shrinking in several countries, and by the end of the century, populations would be shrinking in nearly 70 percent of the more developed countries
and in about 65 percent of the less developed countries (Figure 1).2 These developments would
gradually raise the ratio of old individuals to young. The global old-age dependency ratio (population ages 65 and older to population ages 15 to 64) would triple over the next 85 years, driven by a rapid aging in the less developed economies, which account for 83 percent of the world population today (Figure 2). In the more developed economies, the old-age dependency ratio would double over this period.
Figure 1. Countries with Declining Population, 2015–2100
Source: UN 2015.
Figure 2. Old-Age Dependency Ratio, 2015–2100
Source: UN 2015.
2. In many countries, population aging will pose a formidable fiscal challenge. Today, the more developed economies spend 9½ percent of GDP on public pensions and 6.8 percent of GDP on public health care, compared with 2½ and 3 percent of GDP, respectively, in the less developed countries. Going forward, potentially large increases in age-related expenditures, associated with the projected population aging, could place extreme pressure on public finances in both country
groups.
3. This note focuses on the long-term fiscal implications of these demographic
developments and explores potential policy options to address them. The contribution of this
2 Following the UN grouping (UN 2015), we use the “more developed economies” to refer to Australia, Canada, European countries, Japan, New Zealand, and the United States (altogether 17 percent of the world population in 2015), and the “less developed economies” to refer to the rest of the world (83 percent of the world population in 2015). The results (in terms of the spending projections) do not change when the IMF country classification is used for advanced economies instead of the UN classification of “more developed.” For example, pension spending increases by 4.2 percentage points of GDP during 2015 to 2100 in the more developed economies (Table 1), and by 4.1 percentage points of GDP in the advanced economies (IMF classification).
0 10 20 30 40 50 60 70 80 2015 2050 2100 2015 2050 2100 2015 2050 2100 World More developed Less developed
Pe rc e n t of c ountri es w ith nega tiv e popul ati on grow th 0 20 40 60 2015 2050 2100 2015 2050 2100 2015 2050 2100 World More developed Less developed
O
ld-age dependenc
y
ra
Staff Discussion Note is threefold. First, using demographic projections from the UN, it provides long-term projections of public pension and health care spending for all countries where data are
available, between 2015 and 2100.3 By focusing on projections to 2100, the paper presents the fiscal
implications of demographic trends that will be fully realized only over the longer term. Second, it highlights the risks to public finances from the large uncertainty surrounding demographic projections—long-term projections are subject to a high degree of uncertainty. Identifying these risks and devising mitigation strategies is a crucial element of prudent fiscal policy management
(Gaspar, Hughes, and Jaramillo, 2015).4 Third, it reviews potential options to address these fiscal
pressures. In this regard, the paper also examines the potential role of migration in providing breathing room to reform age-related spending. The remainder of the note is structured as follows. In Section II, we examine the likely development of demographics and age-related spending
between now and 2100. Section III reflects on how the “medium” demographic projections from the UN World Population Prospects compare with past trends, highlighting the potential downside risks to fiscal sustainability arising from uncertain demographic projections. Section IV discusses different policies to help address these risks, and Section V concludes.
LONG-TERM TRENDS: THE PROSPECT OF AGING,
SHRINKING POPULATIONS, AND HIGHER
AGE-RELATED EXPENDITURE
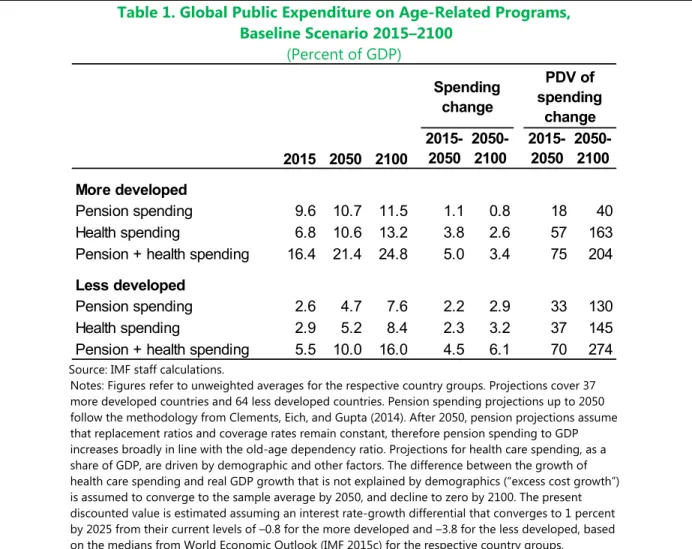
4. Population aging will have a large direct impact on public spending across the globe. Raising the number of elderly increases the costs of public programs, such as pensions and health care. Absent further reforms, age-related expenditures in more developed economies are projected
to increase by nearly 8½ percentage points of GDP over 2015–2100 (Table 1).5 These increases
would be driven mainly by health care, while pension spending would remain relatively contained owing to past pension reforms. Expenditure pressures are expected to continue beyond 2050, reflecting further population aging, particularly in the less developed economies. The implications are far-reaching. Take, for example, the case of health spending in the more developed countries where these spending increases could catapult public debt ratios over the next 85 years: in present value, the increase in public health spending over 2015–50 is equivalent to 57 percent of today’s
3 The long-term projections are based on individual projections for 37 more developed and 64 less developed countries. Currently, the European Commission (EC) and the Organization for Economic Co-operation and Development (OECD) provide projections of age-related spending for 29 and 24 countries to 2050 and 2060, respectively.
4 By fiscal risks we refer to the risks or chances that the actual outturns for budget balances, public debt ratios, and other fiscal variables could be different than those originally forecasted by the government.
5 The trends in health care spending, and the methodology used to quantify the impact of demographic and other factors on health spending, are discussed in Clements, Coady, and Gupta 2012 and in IMF 2013. The parameters of different pension schemes and trends in pension expenditure in advanced and developing countries are presented in Clements, Eich, and Gupta 2014.
GDP, and the present discounted value (PDV) of the increase between 2050 and 2100 would be a
staggering 163 percent of GDP.6
Table 1. Global Public Expenditure on Age-Related Programs, Baseline Scenario 2015–2100
(Percent of GDP)
Source: IMF staff calculations.
Notes: Figures refer to unweighted averages for the respective country groups. Projections cover 37 more developed countries and 64 less developed countries. Pension spending projections up to 2050 follow the methodology from Clements, Eich, and Gupta (2014). After 2050, pension projections assume that replacement ratios and coverage rates remain constant, therefore pension spending to GDP increases broadly in line with the old-age dependency ratio. Projections for health care spending, as a share of GDP, are driven by demographic and other factors. The difference between the growth of health care spending and real GDP growth that is not explained by demographics (“excess cost growth”) is assumed to converge to the sample average by 2050, and decline to zero by 2100. The present discounted value is estimated assuming an interest rate-growth differential that converges to 1 percent by 2025 from their current levels of –0.8 for the more developed and –3.8 for the less developed, based on the medians from World Economic Outlook (IMF 2015c) for the respective country groups.
5. Demographic changes also affect fiscal sustainability through their impact on growth.7
The projected slowdown in population growth can translate into lower economic growth
(Appendix 1).8 Empirical evidence suggests that changes in economic growth are typically matched
by changes in real interest rates (Appendix 2). However, there could be periods over which the
6 The PDV of spending increases provides a sense of how much these increases could add to public debt burdens, assuming no offsetting changes in fiscal policy or reforms. The baseline pension projections presented here are similar to those in the EC’s Aging Report (EC 2015). Our baseline health spending projections, however, are higher than those of the EC. The reason is that our projections take into account the impact of technological change in health care, which—as in the past—is expected to lead to better but more expensive health care (see also Clements, Coady, and Gupta 2012).
7 Fiscal policy affects growth through labor supply, human and physical capital formation, innovation, and productivity enhancements. For a discussion of these channels and evidence, see IMF 2015b.
8 Assuming unchanged labor force participation and productivity per worker, shrinking populations translate into lower economic growth. Moreover, population aging can further reduce employment (and output), since the propensity to participate in the labor force declines with age.
2015 2050 2100 2015-2050 2050-2100 2015-2050 2050-2100 More developed Pension spending 9.6 10.7 11.5 1.1 0.8 18 40 Health spending 6.8 10.6 13.2 3.8 2.6 57 163
Pension + health spending 16.4 21.4 24.8 5.0 3.4 75 204
Less developed
Pension spending 2.6 4.7 7.6 2.2 2.9 33 130
Health spending 2.9 5.2 8.4 2.3 3.2 37 145
Pension + health spending 5.5 10.0 16.0 4.5 6.1 70 274
Spending change
PDV of spending
interest rate-growth differential may not be constant, including because of demographic changes. Since small changes in the interest-growth differential have large effects on public debt dynamics, one concern is that slower growth could make it more difficult to reduce debt-to-GDP ratios over
time. 9 The relationship between interest rate (r) and growth (g) is complex and surrounded by
uncertainty, reflecting factors other than demographics, growth, or fiscal policy (Kogan and others 2015; Summers 2014; Escolano 2011). In this note we focus on long-term trends, and thus to estimate PDVs assume that the interest rate-growth differential converges from their current level (– 0.7 percent of the more developed and –3.6 for the less developed) to 1 percent by 2025—reaching the average observed in the advanced economies over the past 25 years (Escolano 2010; Turner and Spinelli 2012).
Box 1. Impact of Demographic Changes on Pension and Health Care Expenditure
Pension expenditure to GDP (PE/GDP) is the product of four main factors: benefit generosity (average pension to GDP per worker), coverage (number of pensioners to the population 65 and older), the inverse of the labor force participation rate (workers to population ages 15–64), and aging, represented by the old-age dependency ratio (population 65 and older to population 15–64).
65
15 64 65
15 64 1
This implies that pension spending grows in line with the old-age dependency ratio. Intuitively, changes in the old-age dependency ratio affect spending through exogenous changes in either the older population or the working-age population. For example, assuming constant benefit and coverage ratios, an increase in the population ages 65 and older due to an unexpected increase in longevity would translate into higher pension spending for the same level of GDP, thereby increasing PE/GDP. Alternatively, the old-age dependency rate can decrease if the population ages 15–64 turns out to be higher than expected (for example, through immigration). Assuming constant labor force participation and GDP per worker, this would increase the GDP, thereby decreasing PE/GDP. In practice, although not all factors would remain unchanged (for example, an increase in immigration might affect labor force participation rates; aging might affect GDP per worker), this simplified model is useful to illustrate the potential effects of aging on pension spending.
Health care expenditure to GDP (HE/GDP) can be expressed as the product of three factors: the generosity of the health package for the young (average health spending per population 0–64 to GDP per capita), the inverse of the labor force participation rate of the population 0–64, and a function that depends on the ratio of the per capita health spending for the older population to the per capita health spending for the young (α) and the old-age dependency ratio. Assuming α is equal to 3.2 (the average for OECD economies), health care spending to GDP would also grow with the old-age dependency ratio, although at a smaller pace than pensions because both the elderly and the young receive health care benefits.
0 64 0 64
1 0 6564 , 65
0 64
2 Similarly to pensions, an exogenous increase in the number of elderly increases health care spending (more people receive a relatively high per capita health benefit). In addition, assuming constant GDP per worker and labor force participation rates, an increase in the younger population—say from higher migration than projected—has two somewhat offsetting effects. It increases health spending (related to each additional person age 15–64, with a lower health care cost than the elderly), but GDP also increases, reflecting a larger workforce than expected. The GDP impact dominates (increasing with α), and the result is a decrease in health spending to GDP.
9 Lower growth can reinforce age-related spending pressures, but this effect is minor. For example, assuming a permanent decrease in growth of 0.5 percentage points per year starting in 2015, pension spending would increase by only 0.2 percentage points of GDP in 2030, since pensions depend on the evolution of past wages (which are related to past GDP growth). This impact is temporary—once growth stabilizes, the ratio of pensions to wages will eventually stabilize.
6. The links between demographics and growth are numerous and subject to
considerable uncertainty. For example, lower fertility could increase the labor force participation of women in more developed countries (Bloom and others 2007), but not necessarily in developing countries (Lim 2002). In addition, population aging could have an impact on labor productivity, although the evidence suggests that an older labor force is not necessarily more—or less— productive (Burtless 2013; Maestas, Mullen, and Powell 2014). Furthermore, shrinking populations might have positive consequences for welfare that are not captured in their effects on growth. In particular, a declining global population will, other things being equal, reduce energy consumption and pollution.
7. It is important to bear in mind the assumptions underlying demographic projections. Fiscal projections for age-related spending to GDP largely depend on the expected evolution of
old-age dependency ratios (Box 1).10 The UN periodically reports population data and updates its
long-term projections, which currently go up to 2100. The UN “medium variant” scenario—the baseline projections used in this note—relies on probabilistic models to produce the trajectories of fertility and mortality assumptions at a country level (Appendix 3). For migration, the UN assumes that net migration remains constant up to 2050, and then declines gradually to half of this level by 2100.
THE IMPACT OF DEMOGRAPHIC UNCERTAINTY ON
FISCAL SUSTAINABILITY
8. Demographic projections are surrounded by substantial uncertainty. The UN takes into account past demographic trends and country-specific information to inform projections, relying on state-of-the-art statistical techniques and expert judgment, taking into account all currently
available information. Nevertheless, these projections must be taken with caution—future
realizations of fertility, mortality, and migration might differ substantially from the predicted levels, and the views of experts differ. For example, Lutz and others (2001, 2008, 2014) suggest that the peak of the world population might be as early as 2070 and that, by the end of the century, the population might be a significantly lower than envisaged by the UN, reflecting steeper declines in fertility than envisaged by the UN, particularly in Africa.
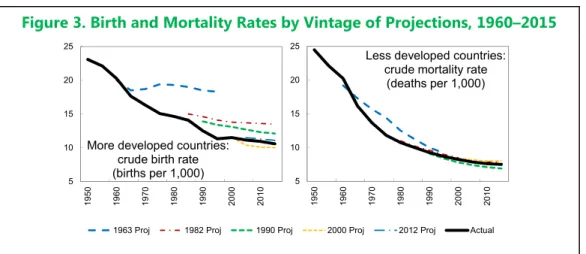
9. Past projections have been subject to large errors. For example, the projections from the 1960s to the 1990s assumed a more gradual decline in birth rates than was actually observed. In contrast, the 2000 projection overestimated the recent decline (Figure 3). Past medium variants of the UN projections have proved to be biased upward, mainly due to fertility rates declining faster than expected (Gros and others 2013). The decline in fertility was not completely unexpected—at
10 In this note, the focus is on changes in expenditure as a share of GDP. Changes to this ratio depend on factors that change the numerator (a higher number of elderly) as well as factors that affect the denominator (a reduction in the working-age population), both of which are affected by population dynamics. This framework implicitly takes into account changes in tax revenue, which, absent policy changes are assumed to remain stable as a share of GDP—as the labor force shrinks, taxes and GDP are expected to fall roughly by the same proportion.
low levels of income per capita, fertility can be expected to increase with economic activity. However, as income per capita increases, there is a demographic transition toward lower fertility, reflecting changes in the tradeoff between the desired number of children and the costs of raising
children (Becker and Barro 1988; Lucas 2001).11 But the demographic transition is due to factors
beyond GDP per capita—fertility declines have been observed in countries with similar sociocultural characteristics at different stages of development (Galor 2005). In particular, the decline in fertility is largely associated with the rise of importance of human capital, with its related increase in returns to education, and the narrowing of the male-female wage gap, which have tilted the choice from quantity to the nurturing of children. Hence, families have increasingly chosen to have fewer children (Galor 2005, 2011). However, some of decline might have been the result of developments that were difficult to foresee, including increasing access to contraception, delaying ages of
marriage, growing labor market opportunities for women, and declining child mortality rates. To some extent, the rapid decline in mortality rates was not foreseen either. For example, for the less developed economies, the 1963 projection failed to predict the rapid drop in crude mortality rates over 1960–80. Death rates are affected by diverse factors, such as innovations in agriculture, advances in medicine, and improvement in public health management.
Figure 3. Birth and Mortality Rates by Vintage of Projections, 1960–2015
Source: IMF staff calculations using UN (1966, 1985, 1991, 2001, 2012, and 2015).
A. Fertility
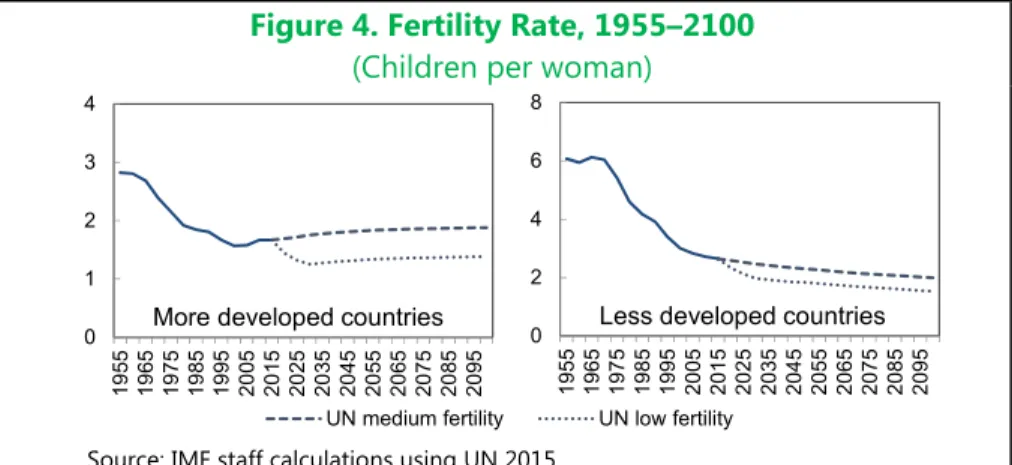
10. After declining for over 100 years, fertility rates are projected to increase slightly in the more developed economies over 2015–2100.12 Fertility rates in the more developed countries
declined from 2.8 children per woman in 1950 to 1.7 in 2015, a level under the rate needed to maintain a constant population, assuming no immigration, estimated at about 2.1 children per
woman (Figure 4, Appendix 4).13 Looking forward, the projections assume a modest increase in
11 The decline in fertility rates has been accompanied by increases in resources invested per child (Wahl 1992). 12 In several European economies, fertility rates declined steadily since the mid-1850s (Cummins 2009).
13 Many demographers are less bullish on fertility rates. For example, Basten, S., T. Sobotka, and K. Zeman 2014 find that the mean fertility rate estimate for 2050 by over 100 experts was below the UN projection in 27 out of 31 low-fertility countries. 5 10 15 20 25 19 50 19 60 19 70 19 80 19 90 20 00 20 10
More developed countries: crude birth rate (births per 1,000) 5 10 15 20 25 19 50 19 60 19 70 19 80 19 90 20 00 20 10
Less developed countries: crude mortality rate
(deaths per 1,000)
fertility rates to 1.8 by 2050 and 1.9 by 2100.14 This expected increase largely reflects recent country
experiences. For example, 29 out of 40 European economies experienced a slight increase in fertility rates over 2005–15. Nevertheless, over the entire forecasting period, fertility rates are projected to remain well below the replacement rate.
11. For the less developed economies, the projections assume a continued but gradual decline in fertility rates. Fertility rates in the less developed economies have declined from more than six children per woman in 1950 to 2.6 in 2015. This reflects the combination of a rapid decline in Asia and Latin America, and a more gradual decline in Africa. The UN medium projection assumes
a continuous decline to about 2.0 children per woman by 2100.These projections imply a more
gradual reduction in fertility rates in the less developed countries than what was experienced in the more developed countries over the past few decades.
Figure 4. Fertility Rate, 1955–2100
(Children per woman)
Source: IMF staff calculations using UN 2015.
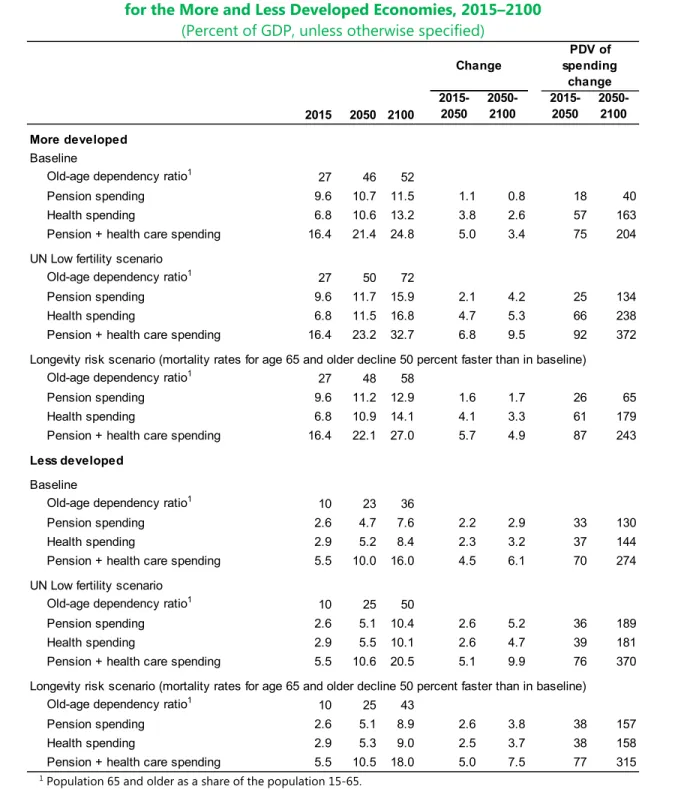
12. The impact of lower fertility rates on fiscal variables is significant. The secular decline in fertility represents an important transition toward declining populations in many countries, with the total world population stabilizing by 2100. But these projections might prove too high, and
populations might start declining earlier. The UN low fertility scenario assumes that fertility rates immediately drop by about 0.5 children per woman in the more and less developed countries. The impact on the size and structure of regions’ populations and age-related spending is large. This can be seen by comparing our projections for age-related spending in 2100 under the baseline and the low-fertility scenario. Age-related spending would be higher by about 8 percentage points of GDP in the more developed economies and 4½ percentage points of GDP in the less developed economies (Table 2). The results show that the public finance implications from demographic uncertainty are considerable.
14 For more developed countries, fertility rates reached a low point of 1.58 around 2000, and increased to 1.67 by 2015. In less developed countries, fertility rates are expected to decline steadily between now and the end of the century. 0 1 2 3 4 19 55 19 65 19 75 19 85 19 95 20 05 20 15 20 25 20 35 20 45 20 55 20 65 20 75 20 85 20 95
More developed countries
0 2 4 6 8 1955 1965 1975 1985 1995 2005 2015 2025 2035 2045 2055 2065 2075 2085 2095 Less developed countries
Table 2. Impact of Demographic Uncertainty on Aging and Age-Related Programs for the More and Less Developed Economies, 2015–2100
(Percent of GDP, unless otherwise specified)
1 Population 65 and older as a share of the population 15-65.
Source: IMF staff calculations using UN 2015.
B. Mortality
13. Longevity improvement is expected to slow down in the more developed economies. After a sharp decline in the 1950s and 1960s, child mortality rates reached 0.1 percent in 2015 in the more developed economies (Figure 5). Longevity also improved at older ages, albeit more gradually.
2015 2050 2100 2015-2050 2050-2100 2015-2050 2050-2100 More developed Baseline
Old-age dependency ratio1 27 46 52
Pension spending 9.6 10.7 11.5 1.1 0.8 18 40
Health spending 6.8 10.6 13.2 3.8 2.6 57 163
Pension + health care spending 16.4 21.4 24.8 5.0 3.4 75 204
UN Low fertility scenario
Old-age dependency ratio1 27 50 72
Pension spending 9.6 11.7 15.9 2.1 4.2 25 134
Health spending 6.8 11.5 16.8 4.7 5.3 66 238
Pension + health care spending 16.4 23.2 32.7 6.8 9.5 92 372
Longevity risk scenario (mortality rates for age 65 and older decline 50 percent faster than in baseline)
Old-age dependency ratio1 27 48 58
Pension spending 9.6 11.2 12.9 1.6 1.7 26 65
Health spending 6.8 10.9 14.1 4.1 3.3 61 179
Pension + health care spending 16.4 22.1 27.0 5.7 4.9 87 243
Less developed
Baseline
Old-age dependency ratio1 10 23 36
Pension spending 2.6 4.7 7.6 2.2 2.9 33 130
Health spending 2.9 5.2 8.4 2.3 3.2 37 144
Pension + health care spending 5.5 10.0 16.0 4.5 6.1 70 274
UN Low fertility scenario
Old-age dependency ratio1 10 25 50
Pension spending 2.6 5.1 10.4 2.6 5.2 36 189
Health spending 2.9 5.5 10.1 2.6 4.7 39 181
Pension + health care spending 5.5 10.6 20.5 5.1 9.9 76 370
Longevity risk scenario (mortality rates for age 65 and older decline 50 percent faster than in baseline)
Old-age dependency ratio1 10 25 43
Pension spending 2.6 5.1 8.9 2.6 3.8 38 157
Health spending 2.9 5.3 9.0 2.5 3.7 38 158
Pension + health care spending 5.5 10.5 18.0 5.0 7.5 77 315
Change
PDV of spending
Looking forward, however, the projections imply a slowdown in the decline in mortality for those ages 65 and older, partly reflecting the experiences of countries that seem to have hit a plateau in longevity improvements. For example, in Japan the mortality rate of the population 65 and older improved by 1.5 percent per year over 1950–2000, but only by 0.2 percent per year over 2000–15. 14. For the less developed economies, the projections suggest continued improvements in longevity. In the less developed economies, child mortality rates are expected to decline to 0.1 by 2060—the level reached in the more developed countries in 1980. Mortality rates for older age groups also decline, but they would remain above those projected for the more developed economies. These projections assume increasing health care coverage of the population in these countries.
15. Improvements in longevity can also have an important fiscal impact. For example, assuming that the annual percentage decline is 1.5 times as large as the annual decline in the baseline similar to the U.S. Social Security Administration “High Cost” scenario for mortality (Office of the Chief Actuary 2014), age-related spending in 2100 could increase by some 2 percentage points of GDP in both the more and less developed economies.
Figure 5. Crude Mortality Rate, 1950–2100
(In percent of population)
Source: IMF staff calculations using UN 2015.
C. Migration
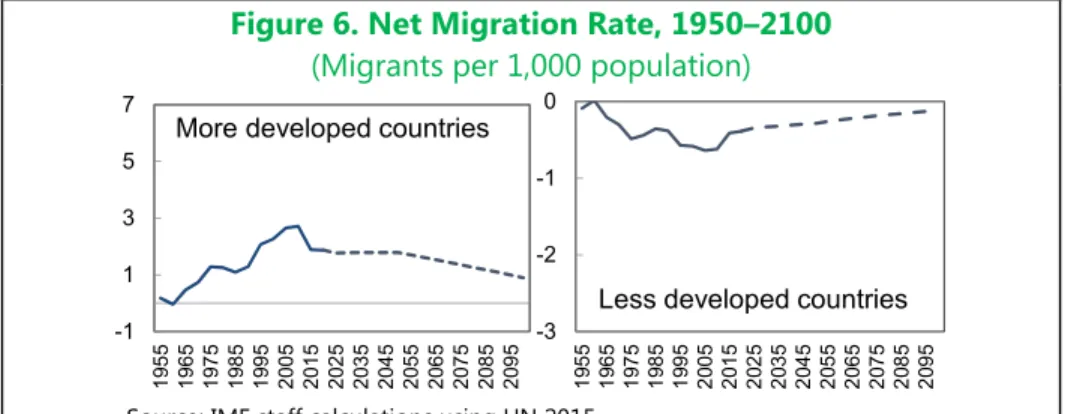
16. The UN medium projection assumes that net international migration rates will gradually decline over the remainder of the century. The main assumption is that net migration flows from less developed countries to more developed countries (in number of migrants) remain constant over 2015–2050, followed by a steady decline to half of the 2050 level by 2100. This contrasts with historic trends—as a share of the population in the more developed countries, migration from the less to the more developed increased from less than 0.5 to more than 2.5 per thousand (or from 0 to about –0.5 per thousand population in the less developed) (Figure 6). Furthermore, migration rates vary substantially across countries. In the more developed economies, net migration rates in 2015 range from about 0.5 per thousand in Japan to over 5 per thousand in Australia and Canada. In the less developed economies, the rate of migration varies from –0.5 per thousand in Africa to –1 per thousand in Latin America.
0 10 20 30 40 50 60 70 80 0 1 2 3 4 5 6 7 8 19 55 19 65 19 75 19 85 19 95 20 05 20 15 20 25 20 35 20 45 20 55 20 65 20 75 20 85 20 95
More developed countries
0 20 40 60 80 100 120 0 5 10 15 20 25 30 35 40 19 55 19 70 19 85 20 00 20 15 20 30 20 45 20 60 20 75 20 90
Less developed countries
Figure 6. Net Migration Rate, 1950–2100
(Migrants per 1,000 population)
Source: IMF staff calculations using UN 2015.
POLICY OPTIONS TO ADDRESS THE FISCAL
CHALLENGE OF SHRINKING POPULATIONS
17. There are two categories of potential policy responses to the fiscal challenges posed by population trends. The first involves policies that attempt to change underlying demographics. This entails introducing incentives to increase fertility, allowing greater net migration, and raising labor force participation. The second involves policies that contain growth in age-related spending, mostly by affecting health care and pensions systems.
A. Policies that Affect Demographics and Labor Markets
Boosting fertility rates
18. Some governments have attempted to use public policies to raise fertility. In a sample of over 150 countries, the proportion of governments that consider fertility in their countries as too low increased from 11 percent in 1976 to 26 percent in 2011 (UN 2011). These concerns have often resulted in policy action—in Europe, for example, the share of governments implementing policies aimed at raising the rate of population growth increased from 26 percent in 1996 to 52 percent in 2011. Measures typically aim to offset the direct costs (through baby bonuses, family allowances, tax incentives) and opportunity costs (through parental leave, subsidized child care, flexible work
schedules) of childbearing (Walker 1995). In contrast, among the least developed economies, containing the fall in fertility rates has been less of a priority, with one exception being China where the one-child policy was partly relaxed in 2013 to allow couples to have a second child as long as
one of the parents is an only child (NHFPC 2013).15
15 Many less developed countries are on the road to improve health care and provide more education and labor force options to women, which largely explains the projected decline in fertility rates. These include integrating family planning into primary health care systems, providing access to reproductive health services, raising the minimum legal age for marriage, improving female education and employment opportunities, and providing low-cost, safe, and effective contraception.
-1 1 3 5 7 19 5 5 19 6 5 19 7 5 19 8 5 19 9 5 20 0 5 20 1 5 20 2 5 20 3 5 20 4 5 20 5 5 20 6 5 20 7 5 20 8 5 20 9 5
More developed countries
-3 -2 -1 0 19 55 19 65 19 75 19 85 19 95 20 05 20 15 20 25 20 35 20 45 20 55 20 65 20 75 20 85 20 95
19. Boosting birth rates could slow down population aging and gradually reduce fiscal pressures. Assuming an annual increase in fertility of about 0.7 percent—the average increase observed in Europe in the past two decades—starting in 2015, would reduce age-related spending by only 0.7 percentage points of GDP in 2050 in the more developed countries (Table 3). The impact is larger in the outer years; by 2100, the reduction is near 4 percentage points of GDP. This reflects the assumed continued increase in fertility rates—which by 2050 would reach levels not observed since the 1980s—and the time it takes for fertility rates to affect the working-age population. In the less developed countries, the effects of changes in fertility on spending are less dramatic (Figure 4). For many less developed countries, one priority is to manage the transition to a lower fertility rate. This initially helps to boost the share of working-age individuals in the population and provides a
temporary “demographic dividend” for growth.16 Taking full advantage of this opportunity requires
efforts to enhance infrastructure, open trade, and improve education and health care (IMF 2015b). 20. However, a “birth rate” solution to aging is unlikely to work for most countries. The pronatalist policies seem to have only modest effects on the number of births, although they might affect the timing of births, and to have a positive impact on the labor supply decisions of mothers (Gauthier and Hatzius 1997; Ronsen 2004; d’Addio and d’Ercole 2005; Piketty 2005; Thevenon and
Gauthier 2011; Kluve and Schmitz 2014; and Brainerd 2014).17 For example, in Spain, part of the
temporary increases in fertility seems associated with higher birth rates among immigrants, many of whom might not be eligible for benefits (Haub 2008). In Germany, policies to encourage births in the 1970s and 1980s had only short-lived effects, and the introduction of the parental allowance in 2007 did not have a noticeable impact on fertility rates, which remained at about 1.35 over the past decade, among the lowest in Europe (Kluve and Schmitz 2014). In China, a slight demographic impact could be expected from the relaxation of the one-child policy, but related long-term effects remain highly uncertain (Basten and Jiang 2015). Altogether, even if with a minimum impact on fertility, the evidence points to the need to ensure policies that encourage labor force participation (for example, through tax credits or access to child care) and to avoid policies that support
untargeted and costly child allowances.
16 In theory, population aging could slightly reduce expenditure on some items such as education, particularly in the less developed countries: assuming unchanged spending per pupil, fewer children per working-age population reduces education spending to GDP. However, the impact of this is likely to be offset by increases in school
enrollment and per pupil expenditure, which remain relatively low in many less developed countries (IMF, 2014). This expansion in the quality and coverage of education would also be consistent with efforts to increase investment in children that accompany the decline in fertility and the greater returns to human capital.
Table 3. Impact of Selected Policy Options on Aging and Age-Related Programs for the More Developed Economies, 2015–2100
(Percent of GDP, unless otherwise specified)
1 Population 65 and older as a share of the population 15 to 65.
Source: IMF staff calculations using UN (2015).
2015 2050 2100 2015-2050 2050-2100 2015-2050 2050-2100 More developed Baseline
Old-age dependency ratio1 27 46 52
Pension spending 9.6 10.7 11.5 1.1 0.8 18 40
Health spending 6.8 10.6 13.2 3.8 2.6 57 163
Pension + health care spending 16.4 21.4 24.8 5.0 3.4 75 204
Increase fertility rates
Old-age dependency ratio1 27 44 43
Pension spending 9.6 10.4 9.5 0.8 -0.8 15 8
Health spending 6.8 10.3 11.5 3.5 1.2 53 134
Pension + health care spending 16.4 20.6 21.0 4.2 0.4 69 142
Allow higher migration
Old-age dependency ratio1 27 45 47
Pension spending 9.6 10.5 10.3 0.9 -0.1 15 21
Health spending 6.8 10.5 12.5 3.7 2.0 56 152
Pension + health care spending 16.4 21.0 22.9 4.6 1.9 71 173
Increase labor force participation of women
Old-age dependency ratio1 27 46 52
Pension spending 9.6 10.1 10.9 0.5 0.8 9 21
Health spending 6.8 10.0 12.5 3.2 2.5 49 142
Pension + health care spending 16.4 20.1 23.3 3.7 3.2 57 164
Increase labor force participation of elderly
Old-age dependency ratio1 27 46 52
Pension spending 9.6 10.3 11.1 0.7 0.8 11 27
Health spending 6.8 10.2 12.7 3.4 2.5 51 148
Pension + health care spending 16.4 20.4 23.7 4.0 3.3 62 175
Increase retirement age by five years over 2015-2100
Old-age dependency ratio1 27 46 52
Pension spending 9.6 9.7 9.4 0.1 -0.4 -4 -6
Health spending 6.8 10.6 13.2 3.8 2.6 57 163
Pension + health care spending 16.4 20.3 22.6 3.9 2.3 53 157
Lower excess cost growth
Old-age dependency ratio1 27 46 52
Pension spending 9.6 10.7 11.5 1.1 0.8 18 40
Health spending 6.8 8.3 8.9 1.5 0.6 25 57
Pension + health care spending 16.4 19.0 20.5 2.6 1.4 44 97
Change
PDV of spending
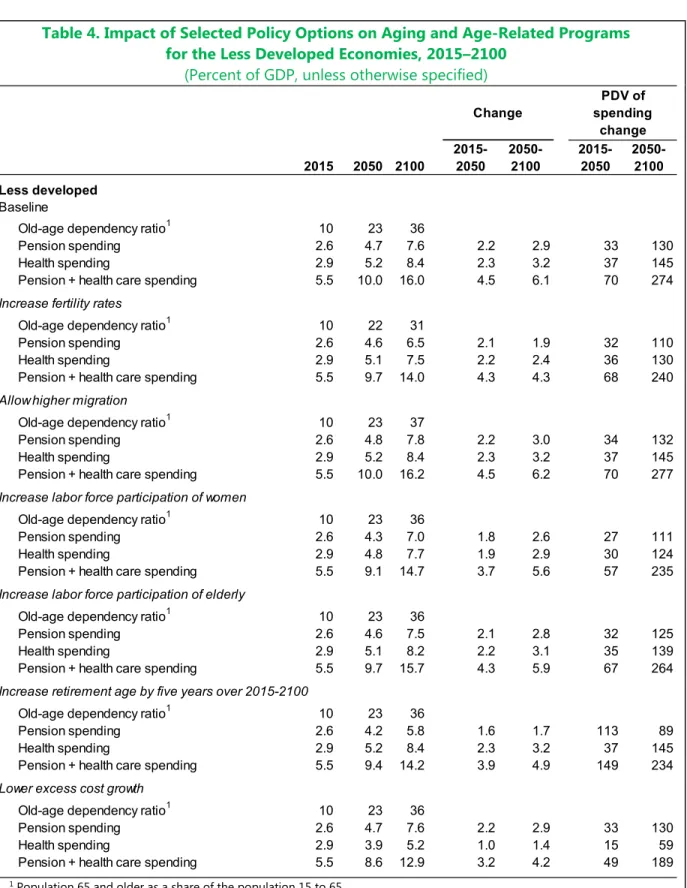
Table 4. Impact of Selected Policy Options on Aging and Age-Related Programs for the Less Developed Economies, 2015–2100
(Percent of GDP, unless otherwise specified)
1 Population 65 and older as a share of the population 15 to 65.
Source: IMF staff calculations using UN (2015).
2015 2050 2100 2015-2050 2050-2100 2015-2050 2050-2100 Less developed Baseline
Old-age dependency ratio1 10 23 36
Pension spending 2.6 4.7 7.6 2.2 2.9 33 130
Health spending 2.9 5.2 8.4 2.3 3.2 37 145
Pension + health care spending 5.5 10.0 16.0 4.5 6.1 70 274
Increase fertility rates
Old-age dependency ratio1 10 22 31
Pension spending 2.6 4.6 6.5 2.1 1.9 32 110
Health spending 2.9 5.1 7.5 2.2 2.4 36 130
Pension + health care spending 5.5 9.7 14.0 4.3 4.3 68 240
Allow higher migration
Old-age dependency ratio1 10 23 37
Pension spending 2.6 4.8 7.8 2.2 3.0 34 132
Health spending 2.9 5.2 8.4 2.3 3.2 37 145
Pension + health care spending 5.5 10.0 16.2 4.5 6.2 70 277
Increase labor force participation of women
Old-age dependency ratio1 10 23 36
Pension spending 2.6 4.3 7.0 1.8 2.6 27 111
Health spending 2.9 4.8 7.7 1.9 2.9 30 124
Pension + health care spending 5.5 9.1 14.7 3.7 5.6 57 235
Increase labor force participation of elderly
Old-age dependency ratio1 10 23 36
Pension spending 2.6 4.6 7.5 2.1 2.8 32 125
Health spending 2.9 5.1 8.2 2.2 3.1 35 139
Pension + health care spending 5.5 9.7 15.7 4.3 5.9 67 264
Increase retirement age by five years over 2015-2100
Old-age dependency ratio1 10 23 36
Pension spending 2.6 4.2 5.8 1.6 1.7 113 89
Health spending 2.9 5.2 8.4 2.3 3.2 37 145
Pension + health care spending 5.5 9.4 14.2 3.9 4.9 149 234
Lower excess cost growth
Old-age dependency ratio1 10 23 36
Pension spending 2.6 4.7 7.6 2.2 2.9 33 130
Health spending 2.9 3.9 5.2 1.0 1.4 15 59
Pension + health care spending 5.5 8.6 12.9 3.2 4.2 49 189
Change
PDV of spending
Allowing greater migration
21. Immigration can have an impact on long-term expenditure trends. Assuming a continuation of trends in migration into the more developed countries over time (similarly to the migration risk scenario illustrated above) would reduce age-related expenditure by 0.4 percentage point of GDP by 2050 and by 2 percentage points of GDP by 2100, without affecting age-related expenditure by much in the less developed countries (Table 3). Under this scenario, by the end of the century, average migration rates would still be below the current levels of net migration into Australia or Canada. Nevertheless, migration cannot fully eliminate the impact of population aging in more developed countries. For example, keeping the old-age dependency ratio constant over the next 85 years in the more developed economies would require an immediate eightfold increase in net migration (from 2.5 million to eventually over 21 million per year net migrants from the less developed to the more developed countries). These levels of migration would eventually deplete the working-age population in the less developed economies. Furthermore, migration alone does not alter the balance between public benefits received and taxes paid by individuals over their lifetime. That is, migration provides a temporary boost to the work force and can increase growth and fiscal revenue, but eventually these new workers will also retire and exert pressure on spending.
Nevertheless, migration can provide more time for countries to implement needed age-related reforms.
22. The impact from migration goes beyond age-related programs. Migration can boost human capital and lifetime income for migrants, and facilitate trade, investment, and knowledge transfers across countries. In addition, remittances from migrants stimulate long-term growth, reduce poverty, and promote financial deepening in countries receiving remittances (Gupta, Pattillo, and Wagh 2009). However, there are concerns that greater migration could increase public
expenditure in the migrant-receiving countries (particularly those with extensive social safety nets), erode human capital and tax bases in migrant-exiting countries (especially if migrants are high skilled), and reduce job opportunities for domestic workers. The literature suggests that, on balance, the benefits from migration outweigh its potential costs (Gibson and McKenzie 2012), and that the overall effect of immigrants on current public budgets tends to be very small (Box 2).
23. Migration remains a politically sensitive issue. Migration is an important factor in shaping the social, political, and economic fabrics in many countries—in the OECD countries there are about 115 million immigrants (OECD 2014). Survey data suggest that, although the desired degree of openness to migration varies substantially across OECD countries, a large proportion of respondents remain in favor of controlled or reduced migration (OECD 2010).
Box 2. The Economic Impact of Migration
Migration can affect the finances of public pension and health care systems, depending on the characteristics of the migrants, progressivity of the tax system, and the structure of the social safety net. For example, young migrants can augment the size of the labor force, thereby increasing the tax base
used to finance traditional pay-as-you-go systems. This impact depends on the effect of migration on domestic wages for the native population, the skills and productivity of the migrants (which determine the income earned by immigrants), and the ability to collect taxes from this additional labor force. In the expenditure side, immigrants are likely to increase the demand for public services (for example, health care). Immigrants would also eventually be eligible for pensions, which they could receive at old age.
The overall effect of immigrant workers on the domestic economy is likely to be positive. It is
commonly believed that immigrants take over jobs of domestic workers, depress their wages, and negatively affect domestic economy. This view is based on the analysis of the labor market where immigrants and native workers have identical characteristics and skills (that is, they are perfect substitutes and that the rest of the economy does not adjust to the inflow of immigrants). The most recent theoretical and empirical evidence provides the opposite perspective. First, immigration does not mean just the inflow of cheap homogeneous labor. It does not have to be the case that immigrants always compete with native workers; they can actually complement and benefit each other (Ottaviano and Peri 2012). Second, the recent
literature supports the view that companies do not lay off domestic workers due to higher supply of cheaper labor from abroad. On the contrary, as companies are faced with larger availability of workers, they realize higher returns to capital and are motivated to invest more in order to realize larger profits. As a
consequence, existing companies expand and new ones emerge. Besides, as documented by Hanson (2012), immigrants are often paid less when compared to domestic workers of similar characteristics and skills, and they allow companies to save costs and increase their productivity and competitiveness. Hence, in the end, immigrants increase the size of the domestic economy. As the domestic economy expands, the number of jobs increases as well. Some of the newly created jobs are taken by immigrants, some by native workers. In addition, immigrants can also add dynamism to entrepreneurship. For example, in the United States about a quarter of the technology company startups over 2008–12 included one foreign-born founder (Wadhwa, Saxenian, and Siciliano 2012). All in all, the overall effect of immigrant workers on the domestic economy is likely to be positive.
In general, immigrants have different characteristics than domestic workers and their labor market outcomes are often less favorable. In addition, the immigrants might not spend their whole lives in the
host country, which may affect the amount of taxes paid and public benefits received. In general, whether the impact is positive or negative depends on a number of different circumstances, and the evidence to date suggest that the overall effect of immigrants on current public budgets is likely to be small (OECD 2013).
Raising labor force participation
24. Raising labor force participation rates—especially for women and older workers— could help mitigate the impact of aging. Assuming constant productivity per worker, increasing labor force participation rates can increase GDP by increasing the number of workers, which would offset or delay some of the projected impact from aging. For ages 25–49, female labor force participation rates are below those of men by about 10 percentage points in Europe and North America, and by 25–30 percentage points in Asia, Latin America, and Africa. Cutting the gap between men and women by half over 2015–50 would reduce age-related spending by about 1 percentage point of GDP in 2050 and by 1.5 percentage points by 2100 in both the more and less developed economies. This means that it would be beneficial to remove obstacles in the way of women becoming economically active, if they so choose. These include addressing gender
differences in property rights, inheritance claims, and property titling; the ability to pursue a profession, obtain a job, or open a bank account; and rights to initiate legal proceedings, sign a contract, and to head a household (Gonzales and others 2015). In addition, it is crucial to review fiscal disincentives that might deter women from participating in the labor market, including the taxation of households that can raise marginal rates for second earners (Pereira 2015). Older individuals also have lower participation rates—those ages 55–64 have lower rates of labor force participation than do those ages 25–49 (with the exception of Africa). Cutting in half the gap in participation between individuals 55–64 and 25–64 would reduce age-related spending by almost 1 percentage point of GDP in both 2050 and 2100 in the more developed countries. The effect is only about a third of this in the less developed countries, where labor force participation does not decrease as sharply with age as in the more developed countries.
B. Reforms to Age-Related Spending Programs
Addressing the growth of age-related costs
25. Reforming public pension systems can help offset the effects of aging. Raising retirement ages is an especially attractive option and would help complement efforts to boost the labor force participation of older workers. It would also help to better align retirement ages with the sharp improvements in life expectancy realized in recent decades (Clements, Eich, and Gupta 2014). For example, raising retirement ages over 2015–2100 by an additional five years (about 7 months per decade) beyond what is already legislated would reduce pension spending by about 2 percentage points of GDP by 2100 (relative to the baseline) in both the more and less developed countries. This could be achieved by linking additional increases in retirement age to longevity gains, with adequate provisions for the poor, whose life expectancy could be shorter than that of the average population (Chetty and others 2015; Clements, Mooij, Gupta, and Keen 2015). In this
context, enhancing antipoverty programs for the elderly and increasing the role of private
retirement saving schemes could be helpful in offsetting the potential decline in lifetime retirement income. Starting reforms early can allow for a more gradual adjustment—for example, if the
adjustments were to start in 2050 instead of 2015, retirement age increases would have to be one year per decade to achieve the same savings. Other policy options to put pension systems on more sustainable footing include reducing pensions relative to wages, increasing taxation of pensions for upper income groups, and increasing pension contributions. The latter is the least preferred option because of the likely impact on labor demand.
26. In a similar vein, health care reform can be effective in containing the growth of public health spending. Market failures in health care imply an important public role for the provision and financing of health care, and in regulating the sector. Policies can help to ensure that new
technologies reduce, rather than raise, health care costs, without adversely affecting health
outcomes (Clements, Coady, and Gupta 2012). There is past success in improving health outcomes without raising costs through promoting some degree of competition among insurers and service providers. Governments can also support primary and preventive care—which helps improve health and reduce the need for more costly treatments at a later stage—and improve provider payment systems to control costs. In addition, the use of health information technology (for example, to
collect, store, and share patient data) has the potential to reduce costs while protecting outcomes. In this regard, there are many lessons that less developed countries can learn from the experience of more developed ones.
27. Containing the growing costs of health care would help reduce long-term fiscal risks. On average, health care costs are projected to increase faster than economic growth. This is due not only to population aging but to technological improvements in health care that result in better but more costly services (see footnote 6). Assuming policies are able to keep the growth of health care costs per capita in line with GDP per capita, health care spending will increase at a slower rate, reflecting only demographics. Under this scenario, public health care spending pressures would be greatly subdued: by 2100, health spending would be reduced by 4½ percentage points of GDP in the more developed countries and 3 percentage points in the less developed.
CONCLUSIONS
28. The fall in fertility and the slowdown and eventual decline in world population are part of the transition to a sustainable growth path. Population growth that implies the population doubling every 35 years or so is unsustainable. Easing population pressure helps to contain the use of energy and fossils fuels, which benefiting the environment. Investment in people promises inclusive growth and raised standards of living.
29. Nevertheless, shrinking populations pose a grave fiscal threat. Absent further reforms, age-related spending is expected to rise because of higher longevity and lower fertility in both more and less developed countries. Without the implementation of further reforms of public pension and health care systems, age-related outlays are expected to increase over 2015–2100 from 16½ to 25 percent of GDP in the more developed economies, and from 5½ to 16 percent of GDP in the less developed economies. The fiscal consequences of this outcome are dire: spending increases of such a magnitude could lead to unsustainable increases in public debt and, sharp declines in other spending, or it could necessitate large increases in tax rates that could stymie economic growth. 30. The projected size and age composition of the population—and our projections for age-related spending—are surrounded by substantial uncertainty. Long-term projections are inherently uncertain: relatively small changes in fertility, mortality, or migration rates can have a substantial impact on the course of age-related spending over the remainder of the century. Risks are especially acute with respect to fertility, which has declined much faster than expected. In this light, spending pressures could be even greater than typically assumed on the basis of the UN’s medium demographic scenario.
31. There is no escape from reforming entitlements. In the more developed economies, one priority remains to limit the excessive growth of health care costs. Further reforms would also be needed to contain the growth in pension spending, which seems relatively mild reflecting past reforms. Increasing retirement ages in line with longevity gains seems a promising option. In the less developed economies, the challenge is to strengthen public pension and health care schemes, while ensuring the expenditure increases are fiscally sustainable. Tax and spending policies encouraging
higher labor participation rates for women and for young and old workers will also be necessary in both more and less developed countries (IMF 2013b, 2015b).
32. Migration and labor market policies can ameliorate the impact of aging in the more developed economies. To fully address the effect of population aging, the expected size of
migration flows from less to more developed countries would need to be unrealistically large. While recognizing that this is a politically sensitive issue, increases in migration, in combination with other labor market policies, can reduce age-related spending and provide more time for countries to implement entitlement reform.
33. Given the magnitude of the fiscal challenge, reforms should start now but be gradual. A gradual pace of reform to pension and health systems would help to spread the burden across generations. There is greater urgency to move on health care as countries have been slow in implementing reforms in this area. In this regard, policy reversals should be avoided to circumvent disruptive adjustments in the future. In many countries, a multipronged approach will be needed, as it will be impossible for reforms to fully offset the impact of demographics on age-related spending. In this context, many countries will need to strengthen their tax systems and improve the efficiency of public spending programs outside of pensions and health (IMF 2013a, 2014, 2015b).
Appendix 1. The Impact of Population on Economic Growth
The size of the labor force is one of the main determinants of economic output. For example, in the basic Solow Growth Model, output depends on the evolution of the capital stock (K), labor (L), and technological progress (E). The steady-state, long-run growth rate of output is directly proportional to the growth rate of the labor force (Box).
Box. Solow Growth Model
(1) (2) (3)
(4)
Assuming: → Labor force grows at n
→ Technological progress increases labor efficiency by g
→ Exogenous and constant savings rate (s) → Exogenous and constant depreciation rate (δ) → All output is saved or consumed
Steady state:
(5) (6)
Implied growth rates in steady state:
→ Labor force ( =n
→ Labor efficiency ( =g
→ Output ( =n+g
→ Output per worker ( =g
→ Output per effective worker ( =0
In practice, the relationship between employment and output might not be one-to-one. Countries might not be in the steady state (capital per worker might vary over time). Furthermore, this relationship might be affected by other factors, such as the intensity of labor (average number of hours worked), which can vary over the economic cycle. Nevertheless, over the long term, the data suggest a high correlation between employment and GDP growth over 1990–2015 (Figure).
Demographic developments can affect the size of the labor force, thereby having an effect on output. Employment (L) is a function of the working-age population (POP15-64), labor participation rate (LFPR), and the unemployment
rate (UR) (L POP LFPR 1 UR .
Assuming constant LFPR and UR, employment moves in direct proportion to the working-age population. This also suggests that increases in labor force participation—for example, of women or the elderly—can partially offset the impact of lower population growth.
Output and Employment Growth in the Advanced Economies, 1990–2015
(Annual growth rate)
Source: IMF staff calculations.
AUS AUT BEL
CAN DNK
FIN DEUFRA GRC ISL IRL ISR ITA JPN NLD NZL NOR PRT ESP SWE CHE GBR USA R² = 0.8089 0 1 2 3 4 5 -1 0 1 2 3 4 R ea l G D P gr ow th Employment growth
Appendix 2. The Impact of Growth on Fiscal Sustainability
How will the projected slowdown in the growth of the working-age population affect fiscal sustainability? One channel is through its effects on age-related spending, such as pensions and health care. Another is through its potential effects on economic growth, which we explore in this appendix.
A common concern is that slower growth could make it more difficult to reduce debt-to-GDP ratios over time. This is typically illustrated using public debt dynamics, as the change in public debt to
GDP (dt dt1) can be approximated as the interest rate-growth differential (r – g) multiplied by the
debt-to-GDP ratio in the previous period, minus the primary balance (pbt) in the current period
(Escolano 2010; Turner and Spinelli 2012):
t t
t
t d r g d pb
d 1 ( ) 1 .
The crucial question is whether the decline in economic growth (g), will be also lead to changes in the interest rate (r). Even small increases in the difference between r and g can have large effects on public debt dynamics (Turner and Spinelli 2012; Kogan and others 2015). For example, at the current levels of gross debt in the advanced economies, a permanent increase in r – g of 0.5 percentage points would raise the ratio of debt to GDP by nearly 40 percentage points of GDP by 2100. Overall, data on the advanced economies over the past 25 years suggest a very low correlation between r – g and output growth over 1990–2014 in the advanced economies (Figure). Assuming this continues in the future, the decline in economic growth would be accompanied by lower real interest rates, and there would be no adverse effects on debt dynamics.
Figure. Output Growth and the Interest Rate-Growth Differential in the Advanced
Economies, 1990–2015
Source: IMF staff calculations.
Note: The trend line and R2 are estimated excluding the Israel and Ireland.
Table. Output Growth and the Interest Rate-Growth Differential in the Advanced
Economies, 1990–2015
Source: IMF staff calculations. AUS AUT BEL CAN DNKFIN FRA DEU GRC ISL ITA JPN NLD NZL NOR PRT ESP SWE CHE GBRUSA IRL ISR R² = 0.0036 -5 -4 -3 -2 -1 0 1 2 3 4 5 0.0 1.0 2.0 3.0 4.0 5.0 r-g GDP growth Real GDP growth r-g 1990-1995 2.0 3.0 1995-2000 3.7 0.8 2000-2005 2.3 0.7 2005-2010 1.2 1.2 2010-2015 1.0 1.1 1990-2015 2.0 0.8
Nevertheless, there could be periods of time over which r – g may not be constant (Table). The relationship between r and g is complex and surrounded by uncertainty, reflecting factors other than demographics, economic growth, or fiscal policy. The literature typically attributes the variation of r – g to financial repression, inflation prospects, the balance between global savings and desired investments, and monetary policy (Escolano 2011; Turner and Spinelli 2012). This complexity is evident when examining longer horizons or wider groups of countries. For example, Turner and Spinelli (2012) document the median r – g in OECD countries fluctuating between –4 percentage points in the 1970s to +4 percentage points in the 1980s, and then declining in the 1990s and 2000s. Focusing only on the United States, Kogan and others (2015) find that, excluding periods of major wars and the great depression, the average r – g has been negative (an average of –0.2 percentage points since 1792), although r – g remained in positive territory for most of the 1980s to 2000s. Using a wider group of countries, Escolano and others (2011) find that in emerging and low income economies, r – g tends to exhibit more within country volatility and lower persistence relative to advanced economies. They find that the r – g was about –4 percentage points in the emerging economies over 1999–2008.