HAL Id: tel-00914365
https://tel.archives-ouvertes.fr/tel-00914365
Submitted on 5 Dec 2013
HAL is a multi-disciplinary open access archive for the deposit and dissemination of sci-entific research documents, whether they are pub-lished or not. The documents may come from teaching and research institutions in France or abroad, or from public or private research centers.
L’archive ouverte pluridisciplinaire HAL, est destinée au dépôt et à la diffusion de documents scientifiques de niveau recherche, publiés ou non, émanant des établissements d’enseignement et de recherche français ou étrangers, des laboratoires publics ou privés.
Sandra de Jong
To cite this version:
Sandra de Jong. Accretion processes of radio galaxies at high energies. High Energy Astrophysical Phenomena [astro-ph.HE]. Observatoire de Paris, 2013. English. �tel-00914365�
Observatoire de Paris
Ecole Doctorale
Astronomie et Astrophysique d’ Ile-de-France
Doctorat
Astronomie et Astrophysique
Auteur: Sandra de Jong
Accretion processes of radio galaxies at high energies
Directeur de th`
ese: Volker Beckmann
Soutenue le 29 octobre 2013 devant le jury compos´
e de:
Fran¸coise Combes Jelle S. Kaastra Gilles Henri Thierry J.-L. Courvoisier Sylvain Chaty Volker Beckmann Pr´esidente Rapporteur Rapporteur Examinateur Examinateur Examinateur
Contents
1 Abstract 7
2 R´esum´e 9
2.1 Introduction . . . 9
2.2 R´esultats . . . 10
2.2.1 La radiogalaxie de type FR-II 3C 111 . . . 10
2.2.2 La radiogalaxie de type FR-I M87 . . . 11
2.2.3 D´etection de deux nouvelles sources sur rayons X . . . 13
2.2.4 Halo de mati`ere noire proche de M87 . . . 13
2.3 Conclusion . . . 13
3 Introduction 15 4 Active Galactic Nuclei 19 4.1 Introduction . . . 19 4.2 Components . . . 20 4.2.1 Core . . . 20 4.2.2 Jets . . . 22 4.2.3 Extended emission . . . 24 4.3 Unified scheme . . . 25
4.3.1 The blazar sequence . . . 28
5 Radiative processes 33 5.1 Thomson and Compton scattering . . . 33
5.1.1 Inverse Compton scattering . . . 33
5.2 Synchrotron radiation . . . 35
5.2.1 Synchrotron self-absorption . . . 37
5.2.2 Synchrotron self-Compton . . . 37
6 The High-Energy Domain 39 6.1 History . . . 39 6.2 Instruments . . . 41 6.2.1 INTEGRAL . . . 41 6.2.2 Suzaku . . . 44 6.2.3 Swift . . . 45 6.2.4 Chandra . . . 46 6.2.5 Fermi . . . 47
7 3C 111: An FR-II source with a hybrid BL Lac core 49 7.1 Introduction . . . 49
7.2 About the source . . . 50
7.2.1 X-ray features . . . 50
7.2.2 Gamma-ray detections . . . 52
7.3 Gamma-ray detection: Fermi analysis . . . 53
7.3.1 First analysis . . . 55
7.3.2 Second run: reprocessed data . . . 55
7.3.3 Pass 7 data . . . 57 7.4 X-ray Analysis . . . 58 7.4.1 Suzaku analysis . . . 58 7.4.2 INTEGRAL analysis . . . 60 7.4.3 Swift/BAT . . . 61 7.5 X-ray spectrum . . . 62 7.5.1 Iron line . . . 65 7.6 SED modelling . . . 66 7.6.1 Synchrotron self-Compton . . . 66 7.6.2 Data preparation . . . 67 7.6.3 The SSC code . . . 68 7.6.4 Results . . . 68 7.7 Discussion . . . 72
7.7.1 X-ray spectral features . . . 72
7.7.2 Gamma-ray emission from 3C 111 . . . 75
7.7.3 SED . . . 75
7.8 Conclusion . . . 77
8 M87: a weak BL Lac core in a nearby radio galaxy 87 8.1 Introduction . . . 87
8.2 Introduction to the source . . . 88
8.3 M87 in hard X-rays . . . 89
8.4 Data analysis . . . 90
8.4.1 INTEGRAL/ISGRI data analysis . . . 90
8.4.2 INTEGRAL/JEM-X . . . 106
8.4.3 Fermi/LAT . . . 110
8.4.4 Suzaku . . . 113
8.5 SED modelling . . . 116
8.5.1 Building the SED . . . 117
8.5.2 SSC codes used . . . 117
8.5.3 SED for the average state . . . 119
8.5.4 2006 SED . . . 121
8.6 Discussion . . . 123
8.6.1 Hard X-ray . . . 123
8.6.2 Spectral energy distribution . . . 124
8.7 Conclusion . . . 125
9 Detection of two new X-ray sources using Swift 135 9.1 Introduction . . . 135
Contents 9.3 Swiftanalysis . . . 136 9.3.1 XRT analysis . . . 136 9.3.2 UVOT analysis . . . 138 9.4 IR follow up . . . 140 9.5 Conclusion . . . 140
10 Search for possible dark matter annihilation around M87 143 10.1 Introduction . . . 143
10.2 Fermi analysis . . . 144
10.2.1 Extended emission results . . . 145
10.2.2 Morphology results . . . 146
10.2.3 Point source identification . . . 146
10.3 Conclusion . . . 148
11 Discussion 157 11.1 Origin of the gamma-ray emission . . . 157
11.2 Proximity . . . 160
11.3 Physical properties . . . 161
11.4 Unified scheme . . . 163
11.5 Gamma-ray emission site . . . 165
11.6 Future . . . 166
12 Conclusions 173 13 Appendix 177 13.1 Parabola calculation . . . 177
13.2 Spearman rank test . . . 177
14 Publications 179 15 Accepted proposals 181 16 Conference presentations 183 List of Figures 184 List of Tables 191 Bibliography 193
1 Abstract
Keywords: Active Galaxies, Individual Galaxies: 3C 111, M87, Jets, Accretion disks/Accretion, X-rays and gamma-rays, Supermassive Black Holes
Mots cl´es: Galaxies Actifs, Galaxies Individuelles: 3C 111, M87, Jets, Disque d’accr´etion/Accr´etion, Rayons X, Rayons Gamma, Trous noirs Supermassifs
AGN are the luminous (L & 1042erg s−1) cores of active galaxies, powered by accretion
onto the central super massive black hole, either via an accretion disk or via a radiatively inefficient accretion flow. There are still several open questions, for example on the launching of jets, which are present in about 10% of the AGN. Another question appeared with the Fermi/LAT gamma-ray survey, which detected many blazars but also a small group of radio galaxies. Radio galaxies are postulated to be blazars where the observer sees the jet at an angle θ > 10◦ allowing a view of both jet and core, rather than only the jet as is the case with
blazars. Radio galaxies are divided into two classes, depending on the radio luminosity of the jets. The Fanaroff-Riley I (FR-I) sources have jets that are bright near the core, where the FR-IIs display extended edge-brightened jets. The FR-I sources are connected to the BL Lacs, which are low-luminosity blazars. FR-II types are thought to be the parent population of the luminous FSRQ, which are also blazars.
This thesis presents a study of gamma-ray bright radio galaxies. By analysing X-ray and gamma-ray data in addition to creating broad-band spectral energy distributions (SEDs), we studied two examples of this new class of sources. For the FR-II source 3C 111 we analysed Suzaku/XIS and PIN and INTEGRAL IBIS/ISGRI observations to create a X-ray spectrum. We also used a Swift/BAT spectrum from the 58-month survey. The 0.4–200 keV spectrum of the source shows both thermal, Seyfert-like signatures such as an iron K-α line, and non-thermal jet features. We also analysed gamma-ray data from Fermi/LAT. The gamma-ray and X-ray data are combined with historical radio, infra red and optical to build the SED, which can be well represented with a non-thermal jet model. The bolometric luminosity of 3C 111 is rather low, and the SED model shows rather a BL Lac type than the expected FSRQ.
The next source we studied is the nearby FR-I M87. This source has been detected in gamma-rays and in the TeV band, but so far not in the hard X-gamma-rays (> 10 keV). The first part of our analysis was focussed on setting an upper limit to the hard X-ray emission of this source, using INTEGRAL IBIS/ISGRI observations. In addition to the standard method we ap-plied several techniques in the analysis process, such as pointing selection and shadowgram treatment, in order to decrease the noise level of the result. Using 5.1 Ms of ISGRI data we determined a 3σ upper limit to the average 20–60 keV flux of f < 3 × 10⁻¹²erg cm−2s−1. We have also analysed Suzaku/PIN observations, where we detected M87 for the first time in the hard X-ray band, with a flux of f = 1.3+0.1−0.2× 10⁻¹¹erg cm−2s−1 between 20 and 60
keV. This detection indicates a flare, since the flux is significantly higher than the derived average upper limit. We also analysed Fermi/LAT data and combined this with the X-ray
upper limits and historical radio, infrared and optical observations to build a SED. The SED can be modelled as a BL Lac source, which is expected since M87 is a FR-I type.
We then also examined the general aspects of gamma-ray bright radio galaxies. Most of these objects are of the FR-I type, and the core of at least one FR-II, 3C 111, is rather BL Lac-like than the expected FSRQ. For the other FR-II sources this might also be the case. The gamma-ray emission originates from the jet, similar as in the case of blazars. Due to the large jet angle, the emission is not observed to be boosted. However, since the gamma-ray emission originates near the black hole, either reflection or a large opening angle can explain the observations.
In addition, I contributed to the study of a possible dark matter halo observed with Fermi/LAT in the vicinity of the Virgo cluster. Our work has shown that a population of point sources contributes to this emission. In this thesis, the result of an extended emission analysis and the search for possible counter parts of new sources are presented.
Finally, the detection of two new X-ray sources using Swift is reported here for the first time. These sources, the BL Lac object BZB J1552+0850 and the Seyfert galaxy LSBC F727–V01, are both located within the 95% error circle of the Fermi/LAT source 2FGL J1551.9+0855. We analysed the X-ray data from the XRT and data from the UVOT. The likely counterpart of the Fermi source is rather the blazer BZB J1552+0850, since Seyfert galaxies are rarely gamma-ray emitters.
To understand the gamma-ray bright radio galaxies, X-ray observations can be used to can characterise these sources. Using for example the new generation of instruments, such as NuS-TAR and ASTRO-H, will help with their superior resolution to distinguish between thermal and non-thermal emission in the X-ray spectrum. Additionally, by building SEDs from simul-taneous multi-wavelength observations will help constrain the broad-band emission. This will also help to pinpoint the counter part of Fermi/LAT detected sources, which is not trivial due to the large uncertainty in position.
2 R´
esum´
e
Cette th`ese pr´esente le travail que j’ai effectu´e dans le domaine des noyaux actifs de galaxie (NAGs), en particulier sur les radiogalaxies.
2.1 Introduction
En 1943, Carl Seyfert d´ecouvre le premier NAG. Six galaxies sont observ´ees dans la bande optique sur de large bandes d’´emission (Seyfert 1943). Durant la fin des ann´ees 1950, plusieurs grandes campagne de surveillance radio ont ´et´e effectu´ees, comme le ”Third Cambridge Sur-vey” `a 178 MHz (Edge et al. 1959). La plupart des objets d´etect´es furent associ´es `a des galaxies sur la bande visible. Quelques-uns d’entre eux furent identifi´es comme des ´etoiles affichant des raies d’´emission inconnues. Ces objets ont ´et´e surnomm´es ”Presqu’´etoiles” ou ”Quasi-Stellar Objects” (QSO). 3C 273 est un QSO et Schmidt (1963), en utilisant un spec-tre sur l’optique, d´ecouvrit que ces raies correspondaient en fait `a la s´erie de Balmer du Magn´esium II d´ecal´ee vers le rouge avec z=0.158. Le d´ecalage des raies vers le rouge ne pouvait pas avoir une origine gravitationnelle ´etant donn´e la largeur des raies et la pr´esence de raies de transition interdites. L’´eloignement de 3C 273 impliquait alors que l’objet ´etait encore plus lumineux qu’on le pensait et les QSO ne pouvait plus ˆetre consid´er´e comme des ´etoiles. Depuis cette d´ecouverte, les objets comme 3C 273 sont appel´es Quasars.
Un NAG est caract´eris´ee par la grande luminosit´e de son noyau, avec L & 1042erg s−1, provenant d’une r´egion compacte. On pense que les NAGs sont aliment´es par accr´etion via un disque d’accr´etion autour d’un trou noir central. Les sources moins lumineuses semblent g´en´eralement accompagn´ees d’un disque d’accr´etion domin´e par l’advection (ADAF). La lu-minosit´e maximale pouvant ˆetre obtenue par accr´etion est la lulu-minosit´e d’Eddington LEdd,
o`u la pression de radiation est ´equilibr´ee par la gravit´e. Elle est d´efinie par: LEdd= 4πGM mpc σT ≃ 1.3 × 10 38 M M⊙ erg s−1 (2.1)
Ici mp est la masse de proton, M la masse de l’objet centrale, G la constante gravitationelle
et σT la section efficace de Thomson. Les NAGs peuvent ˆetre divis´es en deux classes: les
sources radio-silencieuses ou radio-quiet, comme les galaxies de Seyfert et les Low-Ionisation Narrow Emission-Line Region(LINERS), et les sources radio-bruyantes ou radio-loud, comme les blazars et les radiogalaxies. Cette derni`ere cat´egorie pr´esente des jets pour approxima-tivement 10% des NAGs. La distinction est bas´ee sur la radio-bruyance R, d´efinie comme R = F5 GHz/FB, ici F5 GHz est le flux radio `a 5 GHz et FB est le flux optique `a pour la bande
B. Un NAG est radio-bruyant quand R ≥ 10. Les m´ecanismes de formation du jet ne sont toujours pas compl`etement compris. La raison pour la quelle certains NAGs montrent des jets et d’autres non reste ´egalement `a ce jour incertaine.
Des mod`eles d’unification (e.g. Antonucci 1993; Urry & Padovani 1995) ont ´et´e propos´es, o`u il est suppos´e que tous les NAGs sont des objets intrins`equement similaires, observ´es sous
diff´erentes conditions, par exemple, d’orientation. Ce mod`ele de base suppose un trou noir supermassif entour´e d’un disque d’accr´etion. Les raies spectrales observ´ees dans les bandes optiques et ultraviolettes proviennent des r´egions de gaz. Le Broad Line Region (BLR) est plus proche du trou noir et les larges raies spectrales proviennent de l`a. Le Narrow Line Region(NLR) est, quant `a lui, plus loin du centre et sont `a l’origine des raies spectrales fines. Un tore de mati`ere opaque entoure le trou noir, le disque d’accretion et le BLR. Les objets radio-bruyants montrent aussi deux jets perpendiculaires au disque d’accr´etion.
Quand un objet est observ´e face-on, cela signifie que la ligne de vis´ee est perpendiculaire au disque d’accretion. L’observateur peut voir le disque d’accretion, le BLR et le NLR (en cas d’un objet radio-silencieux). Donc, les raies spectrales larges et fines sont visibles. Dans ce cas, le NAG est dit de Type 1. Pour un objet vu edge-on, la ligne de vis´ee est parall`ele au disque, le tore obscurcissant l’emission du disque et du BLR et permettant uniquement la visibilit´e des raies spectrales fines provenant de NLR. Ces NAGs entrent dans la classe Type 2. Le Type 2 contient un Type 1 core qui est obscurci. Des observations radio polaris´ees ont confirm´ees cette th´eorie (Antonucci & Miller 1985). Pour les sources radio-bruyantes, l’angle du jet θ avec la ligne de vis´ee est important. Pour les radiogalaxies ayant un angle de jet tel que θ > 10◦, l’´emission du jet et le noyau sont visibles. Deux types de radiogalaxies ont ´et´e distingu´es par Fanaroff & Riley (1974), en se basant sur la morphologie du jet, et la luminosit´e radio `a 178 MHz (rest-frame). Les types FR-I sont moins lumineux, avec une luminosit´e `a 178 MHz de LFR−I< LFR∼ 2 × 1025W Hz−1sr−1. Les jets sont moins focalis´es,
et l’´emission maximale est proche du noyau. Les jets de type FR-II sont plus lumineux, avec un luminosit´e `a 178 MHz de LFR−II > LFR. Les jets sont tr`es focalis´es, plus long et sont le
plus brillant sur les bords du jet. Si l’angle du jet est tel que θ < 10◦, l’´emission est domin´ee par le jet relativiste et l’objet est identifi´e comme ´etant un blazar.
`
A cause du jet relativiste, l’´emission des blazars est ”Doppler boost´e”, et les photons peuvent atteindre de tr`es hautes energies jusqu’au r´egime du TeV qui sont vus gr`ace au petit angle de jet. Par ailleurs, un plus grand angle de jet des radio galaxies empˆeche l’observateur de voir le jet int´erieur et donc l’´emission observ´ee n’est plus ”Doppler boost´e”. `A cause de cela, les radiogalaxies n’ont pas ´et´e consid´er´ees comme sources de gamma et TeV. Cette id´ee a chang´e avec le premier catalogue de Fermi/LAT (Abdo et al. 2010a) qui permet d’observer les rayons gamma compris entre 20 MeV et 300 GeV (Atwood et al. 2009). La plupart des NAGs dans le catalogue sont des blazars, mais quelques radiogalaxies sont aussi incluses. Cela indique que notre compr´ehension des radiogalaxies et des NAGs n’est pas compl`ete. Pour commencer `
a comprendre cette nouvelle classe de source et pour examiner l’origine des rayons gamma ´emis par les radiogalaxies, deux des radiogalaxies d´etect´ees par Fermi/LAT sont ´etudi´ees plus en d´etail sur la bandes X et gamma et par l’´etude des distributions spectrale d’´energie ou Spectral Energy Distributions(SEDs).
2.2 R´
esultats
2.2.1 La radiogalaxie de type FR-II 3C 111
Dans la premi`ere partie de cette ´etude, on se concentre sur la radiogalaxie de type FR-II 3C 111. 3C 111 (z=0.049 Sargent 1977) est d´etect´ee par Fermi/LAT, et incluse dans le pre-mier catalogue des sources (Abdo et al. 2010a). Le jet a une taille projet´ee de 78 kpc (Bridle & Perley 1984) et l’angle du jet est θ = 18◦ (Jorstad et al. 2005). Sur le spectre optique et
2.2 R´esultats
X, 3C 111 montre des signatures thermiques comme une galaxie de Seyfert. La recherche a d´ebut´ee par une analyse des rayons X et gamma. L’analyse des donn´ees de Fermi/LAT, sen-sible entre 20 MeV–>300 GeV montre que 3C 111 est detect´e entre 0.1–100 GeV, avec un sig-nificativit´e de ∼ 3σ, un indice spectral de Γγ= 2.4±0.2 et un flux f = 1.2×10⁻⁸ph cm−2s−1.
Ensuite, les donn´ees de Suzaku XIS et PIN, de IBIS/ISGRI, un imageur sensible entre 15 keV et 10 MeV sur le observatoire spatial INTEGRAL sont analys´es, et finalement, un spectre de Swift/BAT est ajout´e pour cr´eer le spectre de rayons X entre 0.4–200 keV.
Le meilleur ajustement (χ2
ν=1.10, 1676 degr´es de libert´e) est obtenu avec une loi de
puis-sance absorb´ee pr´esentant une coupure exponentielle, une r´eflexion d’un mat´eriau neutre (pexrav, Magdziarz & Zdziarski 1995) et un profile Gaussien pour la raie du Fer K-α sur 6.4 keV. La densit´e ´equivalente de la colonne d’hydrog`ene est NH= (9.0 ± 0.2) × 1021cm−2,
l’indice spectral est Γ = 1.68 ± 0.03, la coupure d’´energie est Ecut= 227+143−67 keV et le facteur
d’´echelle de r´eflexion est R = 0.7 ± 0.3. Les valeurs de la coupure d’´energie et du facteur d’´echelle de r´eflexion sont dans la gamme pr´evue pour les galaxies de Seyfert. Pour la raie du Fer K-α, une largeur ´equivalente EW = 85 ± 11 eV est trouv´ee. La raie du Fer K-α est aussi une signature thermique, mais en utilisant des observations historiques, on trouve que le continuum ´emission est variable. En conclusion, l’´emission dans la bande X de 3C 111 montre des signatures thermiques provenant du centre, proche du trou noir, et des signatures non-thermiques, provenant du jet.
En utilisant les r´esultats de cette analyse, un SED est construit. Pour repr´esenter les basses ´energies, les observations historiques sur les bandes radio, optique et ultraviolet sont utilis´ees. Le SED est sur le format νf (ν) pour pouvoir comparer un grand domain d’´energie. Pour un blazar, un SED a une forme caract´eristique, qui s’explique par l’´emission synchrotron et dif-fusion par effect Compton inverse. Ce mod`ele suppose une population d’´electrons relativistes, sur une r´egion sph´erique avec rayon et champ magn´etique, qui se d´eplacent dans le jet avec un facteur Doppler δ. Les ´electrons ´emettent un rayonnement synchrotron et les photons ainsi ´emis sont diffus´es par effet Compton inverse (Synchrotron self-Compton, SSC). L’´emission de 3C 111 est bien repr´esent´ee par le SSC mod`ele, ce qui indique qu’une large bande de l’´emission est domin´ee par le jet. Les param`etres utilis´es pour la repr´esentation indique que 3C 111 est plus proche d’un BL Lac (le type de blazar le moins lumineux). Ce qui n’est pas pr´evu dans le mod`ele d’unification qui connecte les FR-II radio galaxies avec les FSRQ.
2.2.2 La radiogalaxie de type FR-I M87
Tandis que la plupart des radiogalaxies detect´ees sur le bande gamma sont de types FR-I, la seconde source ´etudi´ee est la radiogalaxie de type FR-I M87. Cet objet est d´etect´e du regime radio jusqu’`a celui du TeV, mais pas sur les rayons X de > 10 keV. Notre recherche de M87 a deux objectifs: d´etecter ou d´eterminer une limite sup´erieure d’´emission > 10 keV grˆace aux r´esultats des observations de INTEGRAL IBIS/ISGRI publiques et priv´ees, puis ´etudier avec un SED l’´emission en bande large. M87 est un objet proche, situ´e `a un distance de 16 Mpc. Cela offre l’avantage de pouvoir observer les composantes individuelles de la source, comme les ”hotspots” du jet, par exemple pour les rayons X avec Chandra. L’angle du jet de M87 est θ = 30◦ (Bicknell & Begelman 1996).
INTEGRALIBIS/ISGRI utilise la technique du masque cod´e, qui permet de faire converger les rayons X et gamma. Cette technique a l’avantage de permettre un large champ de vue et une imagerie des photons de haute ´energie, `a la diff´erence de l’usage des miroirs. Cependant, la r´esolution angulaire est moins bonne et la d´econvolution des images est complexe. Les donn´ees de INTEGRAL sont organis´ees sur une revolution (une orbite compl`ete, environ 3 jours) et les science windows (scw, pointages individuels). Nous commen¸cons avec un anal-yse standard utilisant les logiciels Offline Scientific Analysis (OSA) 9 sur toutes les donn´ees ISGRI sur M87 (duration on-time total 4.7 Ms). Parce que le flux sur la bande X est prob-ablement faible, l’information du flux est extraite seulement dans la bande en ´energie 20–60 keV. Pour chaque scw une image est cr´ee, et ces images sont combin´ees en une mosa¨ıque. Un significativit´e de 3.8σ est trouv´ee ainsi qu’un flux f = 3.0 × 10⁻¹²erg cm−2s−1 entre 20 et
60 keV. Pourtant, la mosa¨ıque montre de fortes structures de base, ce qui implique que la d´etection n’est pas fiable. Pour quantifier la qualit´e de la mosa¨ıque, la moyenne quadratique des significativit´es de l’ensemble de l’image (significance map) est calcul´ee. Id´ealement, la moyenne quadratique pour cette significance map est srms= 1. L’analyse standard avec OSA
9 rapporte une moyenne quadratique de srms = 1.85. Pour ´etudier ces structures de base,
deux nouvelles mosa¨ıques sont cr´ees, une premi`ere avec tous les scw situ´es avant d´ecembre 2010 et une seconde avec tous les scw situ´e apr`es. Toutes les deux mosa¨ıques montrent des structures de base, elles ne sont donc pas d´ependantes du temps. Apr`es le calcul de la moyenne quadratique des significativit´es des scw individuelles, celles avec un moyenne quadratique de srms,scw > 1.2 sont omises. Une nouvelle mosa¨ıque est cr´e´ee avec cette selection et le on-time
totale a diminu´e jusqu’`a 4.5Ms. La moyenne quadratique s’am´eliore avec srms = 1.35, mais
M87 n’est pas significativement d´etect´e.
Aussi, l’analyse des donn´ees selectionn´ees incluant de nouvelles observations en total on-time 5.2 Ms effectu´ee `a l’aide des nouveaux logiciels OSA 10 montre des structures de base sur la mosa¨ıque, avec une moyenne quadratique de srms = 1.38. M87 n’est pas
significa-tivement d´etect´ee, avec une 3σ limite sup´erieure de flux f < 3.3 × 10⁻¹²erg cm−2s−1 entre 20–60 keV. Quelques autres techniques sont utilis´ees, comme la s´election des donn´ees ou des changements sur les logiciels d’analyse, pour trouver l’origine des structures de base et pour am´eliorer l’image. Les structures ne trouvent pas leur origine dans le source cleaning out de soustraction de fond. Enfin, le meilleur r´esultat affiche une moyenne quadratique de signi-ficativit´e de srms = 1.08, et un 3σ limite sup´erieure de flux de f < 3.3 × 10⁻¹²erg cm−2s−1
entre 20 et 60 keV.
L’analyse de donn´ees des moniteurs de rayons X JEM-X sur INTEGRAL ne montrent aussi aucune ´emission significative > 10 keV, avec un 3σ limite sup´erieure de flux f < 1.2 × 10⁻¹¹erg cm−2s−1 entre 10.2 et 25 keV. L’´emission `a plus basse ´energie 3–10.2 keV est d´etect´ee avec 15.1σ, avec f = (1.6 ± 0.2) × 10−11erg cm−2s−1.
M87 est lumineux sur la bande d’´energie de Fermi/LAT, contrairement `a 3C 111. L’analyse des donn´ees entre 100 MeV et 100 GeV montrent une significativit´e de 19σ, et un flux de f = 2.2 × 10⁻⁸ph cm−2s−1.
Suzaku a observ´e M87 fin 2006. Les donn´ees du d´etecteur `a rayons X durs PIN sont analys´ees pour comparaison avec la limite sup´erieure de flux trouv´ee avec ISGRI. Un spectre peut ˆetre extrait, et un 20–60 keV flux de f = 1.3+0.1−0.2× 10⁻¹¹erg cm−2s−1 est trouv´e. C’est la premi`ere fois que M87 est observ´e dans les energies > 10 keV. Le spectre est represent´e
2.3 Conclusion
avec une loi de puissance absorb´ee dont l’indice spectral est Γ = 2.8+0.5−0.4.
En utilsant les observations historiques sur les bandes radio et optiques, deux SED sont construits; un pour l’´etat moyen (utilisant la limite sup´erieure de ISGRI) et un pour l’´etat ´eruptif 2006 (en utilisant la d’´etection PIN). Les deux SEDs sont bien represent´es avec un mod`ele SSC. Les param`etres utilis´es pour l’ajustement indiquent que M87 est comme un BL Lac avec un ADAF, prevu dans le mod`ele d’Unification. Pour l’´etat eruptif 2006, le SED est mal ´echantillonn´e ce qui rend difficile de trouver un bonne repr´esentation.
2.2.3 D´etection de deux nouvelles sources sur rayons X
Pour l’´etude des radio galaxies d´etect´ees avec Fermi/LAT, nous avons demand´e les droits des donn´ees INTEGRAL IBIS/ISGRI de trois sources d´etect´ees avec LAT. Pour une de ces sources, 2FGL J1551.9+0855, les observations de Swift sont demand´ees simultan´ement avec les observations d’ISGRI. Sur le catalogue de Fermi/LAT 2FGL J1551.9+0855 est associ´e avec une BL Lac `a z = 1.015, CRATES J1552+0850 (Nolan et al. 2012). L’analyse des donn´ees de ISGRI met un 3σ limite sup´erieure de 20–60 keV flux, f . 4 × 10⁻¹¹erg cm−2s−1 et f . 3 × 10⁻¹⁰erg cm−2s−1 pour les deux observations, en raison de la faible exposition de
89 ks et 7 ks, respectivement.L’analyse des donn´ees de Swift/XRT (le t´elescope des rayons X sensible entre 0.2–10 keV) montrent deux sources possibles. Les positions de ces sources sont compatibles avec un BL Lac BZB J1552+0850 (z > 1.015) et une galaxie de Seyfert LSBC F727-V01 (z = 0.071). Ces deux sources sont plac´ees sur le cercle d’erreur `a 95% de 2FGL J1551.9+0855. Ensuite, les donn´ees de Swift/UVOT (t´elescope UV/Optique de 170 `a 650 nm) sont analys´ees. Les magnitudes deriv´ees ne sont pas compatibles avec les r´esultats obtenus pr´ec´edemment par SDSS. Les differences peuvent ˆetre introduites par la variabilit´e des sources ou `a cause d’une difference sur le rayon d’extraction. Il est plus probable que le BL Lac BZB J1552+0850 soit le vrai assocation de 2FGL J1551.9+0855. Les BL Lacs sont connus pour ˆetre des ´emetteurs de rayons gamma, tandis que les galaxies de Seyfert ne le sont pas. Cette conclusion est support´ee par un suivi en infrarouge (Massaro et al. 2012).
2.2.4 Halo de mati`ere noire proche de M87
J’ai contribu´e `a l’´etude d’un possible halo de mati`ere noire (dark matter, DM) observ´e avec Fermi/LAT `a proximit´e de l’amas de la Vierge. Cette halo a montr´e un signal compatible avec une annihilation de DM avec un significativit´e de 4.4σ en utilisant 3 ans de donn´ees de Fermi/LAT (Han et al. 2012). 3.8 ans d’observations de LAT sont analys´ees et une analyse morphologique avec diff´erents mod`eles spatiaux et spectraux a ´et´e effectu´ee. Le meilleur ajustement est une loi de puissance exponentielle de coupure. Le meilleur mod`ele spatial est asym´etrique. Plusieurs nouvelles sources ponctuelles ont ´et´e trouv´ees (Mac´ıas-Ram´ırez et al. 2012), positionn´ees sur la structure du potentiel de DM. L’inclusion de ces sources dans l’analyse montrent une diminution de significativit´e jusqu’`a ∼ 3σ. Le signal attribu´e `a DM est probable grˆace aux nouvelles sources et aux incertitudes dans l’´emission diffuse de la galaxie.
2.3 Conclusion
Dans cette th`ese, l’origine de l’´emission des rayons gamma pour deux sources, le FR-II 3C 111 et le FR-I M87 est ´etudi´ee par analyse spectrale dans les rayons X et gamma, et SEDs. Dans le
cas de 3C 111 des processus thermiques du noyau sont visibles sur la bande X, tandis que pour M87 sur les rayons X l’´emission non-thermique du jet est visible. Sur le SE, les deux sources montrent un spectre de type BL Lac. Au total, l’´echantillon de radiogalaxies d´etect´ees avec Fermi/LAT se compose de 15 sources. La plupart de ces objets sont de type FR-I, le noyau de FR-II 3C 111 est comme le type BL Lac et n’est pas la FSRQ pr´evue de l’Unification. Aussi les autres radio galaxies d´etect´ees par rayonnement gamma de type FR-II peuvent montrer un noyau BL Lac. L’´emission de rayons gamma provient du jet, `a l’image des blazars. Parce que l’angle du jet est grand sur les radio galaxies, l’´emission n’est pas observ´ee ”boost´ee”. Quand l’´emission de rayons gamma trouve sa source proche du trou noir, une r´eflexion ou un grand angle d’ouverture du jet peut expliquer les observations. Pour continuer cette ´etude afin de comprendre le rayonnement gamma provenant des radio galaxies, des observations sur les rayons X peuvent ˆetre utilis´ees pour caract´eriser ces objets. Par exemple de nouveaux instruments comme ASTRO-H et NuSTAR vont aider, grˆace `a leur r´esolution sup´erieure, `a distinguer l’´emission thermique de l’´emission non thermique dans le spectre des rayons X. Construire SED `a partir d’observations multi-longueur d’onde simultan´ees aidera `a limiter l’´emission `a bande large.
3 Introduction
The first Active Galactic Nuclei (AGN) were observed in the optical band, as extragalactic nebulae with particularly broad emission lines, in 1943 (Seyfert 1943). The first large radio surveys performed in the late 1950s showed more peculiar objects, the Quasi-stellar objects (QSOs), which appeared to be bright and point-like sources. The QSOs showed emission lines at unknown wavelengths, which was interpreted by Schmidt (1963) as caused by red-shift, which placed the QSOs at large distances. Though the luminosities of the QSOs were initially thought to be due to starlight, the extragalactic nature of the sources ruled out this theory, and soon after it was established that accretion by a super massive black hole could produce the observed luminosities (e.g. Salpeter 1964). In Chapter 4 the history and anatomy of AGN is more extensively described.
Nowadays, our knowledge on AGN has improved (e.g. Beckmann & Shrader 2012). Both by theories, like the unification model (e.g. Urry & Padovani 1995) and by observations, such as performed by the INTEGRAL mission, which has observed hundreds of AGN in the hard X-ray band, increasing our understanding of the physics and the Unification model (e.g. Courvoisier 2013a).
Open questions remain. For example, it is thought that all galaxies harbour a super massive black hole in their centre, though not all galaxies are AGN. The exact accretion processes, which are the origin of the observed luminosity, are still a matter of debate. Also the launch-ing of jets, present in about 10% of the AGN and in many other accretlaunch-ing objects such as microquasars (e.g. Chaty 2005), is not fully understood.
In this thesis the focus lies on a specific type of AGN: the radio galaxies. These sources have a prominent jet which is observed with an angle of > 10◦ to the line of sight. The radio
galaxies show emission from thermal processes from the core, near the central black hole, and non-thermal synchrotron and inverse Compton emission from the jet. Radio galaxies are assumed to be the parent population of blazars, the type of radio-loud AGN where the observer looks directly into the jet. The relativistic jet swamps any thermal core emission and high energy photons up to TeV are expected due to Doppler boosting. Due to the relatively large angle of the jet with respect to the line of sight, gamma-ray emission was not expected from radio galaxies. This picture changed with the Fermi satellite, which operates between 30 MeV to 300 GeV. Many blazar sources were detected, but also a small group of gamma-ray bright radio galaxies.
Therefore, it seems that our understanding of radio galaxies is not complete. To understand the origin of the gamma-ray emission, we studied two gamma-ray detected radio galaxies in great detail, using X-ray spectra and performing broad band analysis (see Chapter 6 for the X-ray and gamma-ray instruments used). In the X-ray band we can observe both thermal, Seyfert-like and non-thermal, jet-like, signatures. Since AGN are observed in all wavelengths, from radio to TeV, and potentially even emit cosmic rays (Henri et al. 1999), it is important to observe, and model the emission processes in the full energy band.
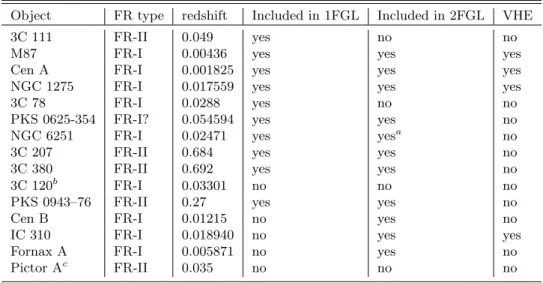
Table 3.1: Sample of Fermi/LAT radio galaxies (Abdo et al. 2010e). 3C 120 was not included in the first catalogue but is detected using 15-months of Fermi/LAT data. Pictor A was detected using three years of Fermi/LAT observations (Brown & Adams 2012), but has not been included in either of the Fermi/LAT catalogues.
Object FR type redshift Included in 1FGL Included in 2FGL VHE
3C 111 FR-II 0.049 yes no no
M87 FR-I 0.00436 yes yes yes
Cen A FR-I 0.001825 yes yes yes
NGC 1275 FR-I 0.017559 yes yes yes
3C 78 FR-I 0.0288 yes no no
PKS 0625-354 FR-I? 0.054594 yes yes no NGC 6251 FR-I 0.02471 yes yesa
no
3C 207 FR-II 0.684 yes yes no
3C 380 FR-II 0.692 yes yes no
3C 120b
FR-I 0.03301 no no no
PKS 0943–76 FR-II 0.27 yes yes no
Cen B FR-I 0.01215 no yes no
IC 310 FR-I 0.018940 no yes yes
Fornax A FR-I 0.005871 no yes no
Pictor Ac
FR-II 0.035 no no no
a
Associated position changed.
b
Included in Abdo et al. (2010e)
c
Brown & Adams (2012)
The first radio galaxy to be detected in gamma-rays was the nearby Fanaroff-Riley (FR, see Section 4.2.2) 1 object Centaurus A. This nearby source, z = 0.001825, was observed by the early gamma-ray observatory CGRO/EGRET (Hartman et al. 1999). Also 3C 111 and NGC 6251 were shown to have a potential CGRO/EGRET counter part. The first Fermi/LAT catalogue, using 11 months of observations, has detected a total of 1451 sources, among which 569 blazars and 10 non-blazar AGN (Abdo et al. 2010a). In a Fermi/LAT paper dedicated to misaligned blazars, the source 3C 120 has been detected using 15 months of observations (Abdo et al. 2010e). In total the sample consists now of 11 radio galaxies, 7 FR-I galaxies and 4 FR-II sources. In the second Fermi/LAT catalogue, the LAT-detected sources 3C 111, 3C 120 and 3C 78 sources are no longer significantly detected. but there were several new sources found: IC 310, Centaurus B and Fornax A. Centaurus A, included in the first catalogue, was split into two gamma-ray sources for the second catalogue, as signifi-cant gamma-ray emission from the core and from the radio lobes was observed (Nolan et al. 2012). In Table 3.1 all gamma-ray bright radio galaxies detected so far can be found. The majority of the sources are of the FR-I type, and all observed sources are at redshifts z < 0.69. In addition to gamma-ray emission, four gamma-ray bright radio galaxies have also been detected in the TeV band. While in the gamma-ray band we observe a majority of FR-I sources, in the TeV band only FR-I sources are observed.
we have chosen to take a closer look at both an FR-I source (M87, see Chapter 8) and an FR-II object (3C 111, see Chapter 7). In Chapter 11 we tie our results into a larger sam-ple, and compare with blazars and other radio galaxies to understand these enigmatic sources. In addition to this work on gamma-ray bright radio galaxies as a group, a potential dark matter halo around M87 was studied using Fermi/LAT observations, described in Chapter 10. Finally, observations from Swift/XRT near the Fermi/LAT detected source
2FGL J1551.9+0855 led to the discovery of X-ray emission from two AGN, the blazar BZB J1552+0850 and the Seyfert 1 galaxy LSBC F727-V01, see Chapter 9.
4 Active Galactic Nuclei
4.1 Introduction
An Active Galactic Nucleus (AGN) is the core of an active galaxy, and the term is used for a broad variety of objects. The first class of AGN that was discovered are the Seyfert galaxies. Seyfert (1943) used optical observations of 6 galaxies which showed redshifted broad emission lines in their spectrum. Taking into account the large distance of the galaxies which can be deduced from the redshift, these objects had to be very luminous. While the common understanding at that time was that the emission results from a large number of stars, later observations indicated that the nucleus, where the emission arises, has a diameter less than 100 pc. However, concentrating individual stars with a total mass of a few times 108M
⊙,
within a volume ≪ 0.0005 kpc3seemed not feasible, as Woltjer (1959) pointed out. Soon after it was established that only accretion onto a super massive black hole could produce this kind of energy output within such a small volume (Salpeter 1964; Lynden-Bell 1969).
The first radio surveys were performed in the late 1950s, for example the third Cambridge survey, at 178 MHz (Edge et al. 1959) and the Parkes survey of the southern sky at 408 MHz, 1410 MHz and 2650 MHz (Ekers 1969). Most of the radio sources could be identified with re-solved galaxies, but the position of several radio sources coincided with optical point sources, and these sources were thus called QSOs or Quasi-Stellar Objects. The QSOs showed strong emission lines, but at unidentified wavelengths. For example, using radio observations, the position of the QSO 3C 273 was determined with an accuracy of 1 arcsecond using the lunar occultation method (Hazard et al. 1963). The radio position coincides with a star-like opti-cal counter part, which showed unidentified emission lines. Schmidt (1963) showed that the unidentified lines observed were the hydrogen Balmer series and the magnesium II line, red-shifted with z = 0.158. This redshift could be of gravitational origin, or of cosmological origin (Greenstein & Schmidt 1964). The gravitational explanation is excluded, assuming a galactic object yields a density which can not be reconciled with the width of the emission lines and the presence of forbidden lines. Similarly, assuming an extra-galactic object also could not reconcile the densities with the lines present. Assuming a cosmological redshift, caused by the expansion of the Universe, places 3C 273 at a distance of D = 649 Mpc via D = cz/H0, with
z the redshift and H0 the Hubble constant1. The large distance indicates that these QSO are
not stars, but rather star-like, and were renamed quasi-stellar radio sources or quasars. In addition, the distance also implies that the luminosity of these objects is much larger than previously assumed, and also about 100 times as luminous as known spiral galaxies.
In the years following this discovery several more quasars were observed, with a redshift up to about z ∼ 2. The objects were characterised by broad emission lines, a large redshift,
1A recent study using Hii regions yielded a Hubble parameter of
H0= 74.3 ± 3.1 (statistical) ± 2.9 (systematic) km s−1Mpc−1, a measurement which is in agreement
Figure 4.1: Optical spectrum for the BL Lac RX J1517.7+6525(Beckmann et al. 1999).
a variable continuum flux, and a UV excess, when compared to stars in a colour-colour di-agram (Matthews & Sandage 1963). This latter property was used to identify new quasars candidates (Ryle & Sandage 1964). This lead to the discovery of the radio-quiet quasar-like objects, that showed a similar UV excess as the quasars but were not detected in the radio band (Sandage 1964).
Nowadays a different terminology is used. The whole class of active galaxies is called AGN. The radio-loud sources are divided into blazars and radio galaxies, where the blazars are more luminous and highly variable. The blazar class is subdivided into BL Lac-type objects, after the prototype BL Lacertae, and into the bright FSRQ and SSRQ (flat and steep spectrum radio quasars, respectively). The difference between these groups is the equivalent width (EW) of the emission lines, where BL Lacs do not display lines with EW≥ 5˚A. An example of the optical spectrum of a BL Lac source, RX J1517.7+6525, can be found in Figure 4.1. Figure 4.2 shows a spectrum for a FSRQ source, 3C 273.
The radio-quiet group consists of Seyfert galaxies and LINERs (Low-Ionisation Narrow Emission-line Regions), where the Seyfert class is more luminous. The Seyfert galaxies can be divided into different groups, depending on the presence of broad and narrow emission lines, where type 1 Seyferts show both narrow and broad emission lines and type 2 Seyferts show only narrow emission lines. There are also intermediate types of Seyferts, which are classified based on the broadness of the Balmer lines (see for example Winkler 1992).
4.2 Components
4.2.1 Core
It is thought that AGN are fuelled by a super massive black hole (SMBH) in their centre (Salpeter 1964; Lynden-Bell 1969). This explains the high luminosity output, L & 1042erg s−1,
by accretion of matter onto the SMBH, and the variability in the emission on short time scales of ∆t ∼ minutes in the X-rays and in the TeV band, which indicates that the emission arises in a compact region. The central black hole can be fuelled by gas from nearby dense stellar clusters via tidal distortions and stellar collisions, providing sufficient fuel for low-luminosity AGN (Combes 2001). For high-luminosity AGN, a high accretion rate is needed. Large-scale
4.2 Components
Figure 4.2: Optical spectrum for the FSRQ 3C 273, the spectrum shows several strong emis-sion lines (Yates & Garden 1989).
gravitational instabilities can drive gas towards the accreting object.
The maximum luminosity that can be achieved by spherical accretion onto a mass M is the Eddington luminosity LEdd, where the radiation pressure balances the gravitational force.
The Eddington luminosity is expressed as: LEdd= 4πGM mpc σT ≃ 1.3 × 10 38 M M⊙ erg s−1 (4.1)
Here, mp is the mass of a proton, M the mass of the central object and σT the Thomson
cross-section, see equation (5.2).
Since the central SMBH does not emit radiation, it can not be directly observed. There are several techniques which allow us to determine the mass of the central BH indirectly, for example the MBH− σ relation. This connects the black hole mass MBH with the stellar
velocity distribution σ in the bulge of the host galaxy (Magorrian et al. 1998). It is now assumed that all galaxies harbour a central SMBH, however these are generally not active, such as the SMBH in our own galaxy, Sagittarius A* (Sgr A*, Balick & Brown 1974). This compact and bright radio source lies at the centre of the Milky Way, and the stars within 0.01 pc of Sgr A* were observed to move very fast, v > 1000 km s−1 (Eckart & Genzel 1997; Ghez et al. 1998). These stellar motions indicated the mass of the radio source to be large. Later work by Ghez et al. (2008) and Gillessen et al. (2009) confirmed this by tracking the stars near Sgr A* for 12 years, showing that they indeed orbit around a central BH with a mass estimate of MBH ⋍4.3 × 10⁶M⊙. Due to the angular resolution necessary to track the
stars near the centre this technique can not be applied to other galaxies to infer the mass of their central SMBH. To measure the black hole mass in other galaxies, reverberation map-ping can be used, or tracking water masers in the accretion disk near the central object to create rotation curves (see for example Moran et al. 1999). Reverberation mapping measures the structure near the central BH by monitoring the continuum emission and the emission of the broad-line region (see Section 4.2.3). The broad-line region clouds are assumed to follow Keplerian orbits, and the clouds are illuminated by the central engine. Doppler effects cause the emission line profiles arising in the broad-line region to broaden, which gives the
root-mean-square velocity of these clouds. The variations in the continuum influence the line emission, with a certain time delay which depends on the distance of the emission region. From the velocity variations and the radius of the emission region the mass of the compact object can be calculated. Masses between MBH ≈ 106− 1010M⊙ have been derived.
In the process of accretion, the infalling gas rotates around the SMBH in tightening Ke-plerian orbits, forming a geometrically thin but optically thick accretion disk. The material gradually loses its angular momentum, due to viscous processes produced by turbulent effects and magnetic instabilities (Shakura & Sunyaev 1973). The heat created in the disk is radiated away via black body emission, which depends on the radius R. The effective temperature is:
T (R) = T∗(R/RBH)−3/4 (4.2)
where RBH is the radius of the SMBH, R the radius where the radiation is emitted, and T∗
is defined as: T∗ = GMBHM˙ 4σπR3 BH !1/4 (4.3) where MBH is the mass of the SMBH, and ˙M the accretion rate. The overall disk spectrum is
approximately the sum of the black body emission at each radius R. Here losses due to disk Compton scattering are not taken into account. The thin disk scenario breaks down if the accretion rate exceeds significantly the Eddington value or cooling becomes inefficient, such that the disk cannot be vertically confined.
For some low-luminous sources the thin accretion disk approximation does not properly explain the luminosity based on the measured black hole mass. In these cases an accretion flow emerges which is cooled by advection rather than radiation. In these models, which are called advection dominated accretion flow (ADAF, Ichimaru 1977) or radiatively inefficient accretion flow (RIAF, Ptak et al. 2004), the accreting matter is heated viscously, and since the radiative cooling is inefficient, heat is stored as entropy (Narayan & Yi 1994). One of the results of this type of flows is that the accreting matter forms a corona rather than a disk. Due to the low efficiency, sources with an ADAF will be less luminous than sources that have a radiatively efficient accretion flow.
There exist other alternative models for the accretion onto the central black hole. For example, an inhomogeneous accretion flow where collisions between the clumpy matter creates shocks could give rise to the observed optical to X-ray emission (Courvoisier & T¨urler 2005; Ishibashi & Courvoisier 2009). However, such a model is not able to explain the observed jets in AGN.
4.2.2 Jets
Radio lobes have first been reported by Jennison & Das Gupta (1953), who analysed radio observations of the nearby radio galaxy Cygnus A. Initially it was thought that the jets were ejected and not attached to the host galaxy. Later it was shown that the radio lobes could be powered by the jets originating from the centre of the galaxy (Rees 1966). With radio interferometry techniques, many more jetted sources have been discovered, and it is even possible to resolve the inner parts of the jet. For the nearby galaxy M87 for example, Hada
4.2 Components
et al. (2011) have used observations between 2.3 and 43.2 GHz to image the jet base down to ∼ 0.01 pc (see also Section 8.2). Nowadays it is possible to resolve jets also in other bands, such as in the optical and soft X-rays.
Jets can extend from parsec scale out to hundreds of kiloparsecs in luminous sources. For radio galaxies, the Fanaroff-Riley classification is used (Fanaroff & Riley 1974). The FR-I types are less luminous, often show two symmetric jets, and most of the jet emission originates close to the core (see Figure 4.3 for example). The FR-II sources are more luminous, do not always show an equally bright counter jet and show edge-brightened extended jets (see Figure 4.4). In this case the difference in luminosity in both jets, or the absence of the counter jet, is connected to the Doppler boosting and viewing angle, such that the jet pointed towards the observer appears brighter. This also explains the apparent super luminal motion of jet knots (parts of the jet which display higher luminosity, possibly due to shocks) which have been observed in several sources (e.g. Wehrle et al. 2001).
FR-I and FR-II sources can be discriminated based on their radio luminosity. Sources with a luminosity higher than a monochromatic luminosity of LFR ∼ 2 × 1025W Hz−1sr−1 at a
rest-frame frequency of 178 MHz are classified as FR-II, and sources with luminosities below the luminosity LFR are classified as FR-I (Fanaroff & Riley 1974). In the optical band there
is no distinction between both types of radio sources (Owen & Ledlow 1994). At low redshift (z < 0.5) FR-I galaxies tend to be in galaxy clusters, while FR-II sources are more often hosted by isolated galaxies. At higher redshifts both FR types are found in rich environments (Hill & Lilly 1991).
The mechanism responsible for launching the jet is still under discussion. For example, the driver can be disk accretion energy and angular momentum (Blandford & Payne 1982) or the black hole spin (Blandford & Znajek 1977). The latter, also known as the Blandford-Znajek mechanism, is often used to explain the powering of the jet. In this model, an accretion disk with a strong magnetic field can extract spin energy from the rotating central black hole. As accreted matter from the disk falls into the SMBH, the magnetic field lines are carried along with the matter. The spin of the SMBH then drags the field lines, twisting the lines and generating a toroidal component. This induces a poloidal electric current, which follows the field lines into the poles of the SMBH. The energy transported via the currents into the poles is expelled and forms a jet.
Another theory shows that it is possible to extract energy from the rotating SMBH via frame dragging (Penrose process, Penrose 1969). It is assumed that the rotational energy of the SMBH is not located inside the event horizon, where the escape velocity exceeds the speed of light, but rather outside of it in the ergosphere. Within the ergosphere spacetime is dragged along with the SMBH rotation (frame-dragging, or Lense-Thiring effect, Lense & Thirring 1918). Then, an infalling piece of matter which enters the ergosphere can be split into two pieces, such that one falls into the event horizon and the other can escape to infinity. Due to the conditions in the ergosphere, the particles can have a negative energy as long as conservation of energy holds. This way, the escaping matter can have a larger energy than the original infalling matter.
AGN jet observations suggest the jets might precess either due to the Lense-Thirring effect or the accretion disk viscosity. The jet can interact with the intra-cluster medium
surround-Figure 4.3: An example of a FR-I galaxy, M84, at 5GHz (Laing & Bridle 1987). Both the jets are visible, and most jet luminosity is emitted near the core.
ing the galaxy and form cavities or inflate bubbles. For example near the elliptical galaxy NGC 1275, multiple cavities mis-aligned with a jet have been observed, which might indicate a strong precession of the jet (Falceta-Gon¸calves et al. 2010). However, later work by Nixon & King (2013) showed that the Lense-Thirring effect alone can not be responsible for repeated jet precession, since the angular momentum of the accretion disk is small compared to that of the SMBH, which restricts the motion of the jet. In AGN the angular momentum of the disk is constrained. The angular momentum of the disk Jd is related to the disk radius Rd
via Jd ∝ R1/2d . The radius of the disk is limited, the disk will fragment into stars due to
self-gravity if the radius is too large. It is possible for the jet direction to change slightly on time scales of & 107yr due to random accretion events.
4.2.3 Extended emission
The optical and UV spectra of AGN show the presence of both broad and narrow lines. These lines are thought to arise in different regions, the broad and narrow line region (BLR and NLR, respectively), since the properties of the gas which causes the emission lines appear to be different. The broad lines are Doppler-broadened, showing a typical full-width half-maximum velocity of ∆vFWHM ≈ 5000 km s−1. The temperature of the gas as derived from
the emission lines is T ≃ 104K with a density of n > 109cm−3. The overall mass of the BLR can be calculated from the C iv emission line, and is found to be low even for luminous sources, MBLR∼ 1 − 10M⊙. Reverberation mapping (see Section 4.2.1) is used to probe the
BLR (e.g. Clavel et al. 1991), and it has been shown that the BLR is close to the central engine, at a radius of ∼0.01–1 pc.
4.3 Unified scheme
Figure 4.4: The FR-II radio galaxy 3C 175 at 5GHz (Bridle et al. 1994). The jet which is pointed towards the observer is visible, and, while the radio lobes of the counter jet can be observed, the jet itself is not visible due to Doppler boosting away from the observer.
the presence of forbidden lines indicates that the gas density is low. An average density of the emitting gas can be derived with about ¯n ≃ 2000 cm−3 (Koski 1978). The NLR extends
be-yond the BLR, out to a distance from the central black hole of about 100–10,000 pc. Smaller distances have been reported, for example for the Seyfert 2 galaxy NGC 5548 a much smaller distance of 1–15 pc from the central source was deduced (Detmers et al. 2009). The total mass of the NLR is larger than that of the BLR, of the order of MNLR∼ 106M⊙. In both cases the
gas is thought to be contained in optically thin clouds, photoionised by UV radiation, which causes the observed lines.
Surrounding the accretion disk and the BLR is thought to be a dusty torus. This was proposed initially to explain the polarized emission lines in the optical spectrum observed in the nearby (distance 14.4 Mpc) Seyfert 2 galaxy NGC 1068 (Antonucci & Miller 1985), but now forms a key element to the Unified scheme (see Section 4.3). Infrared observations of the torus show that the structure should be geometrically thick, obscuring and of parsec size. Interferometry observations of the torus of NGC 1068 with the VLTI at 8µm showed warm (T ≃ 320 K) dust in a 2.1 pc thick structure which is 3.4 pc in diameter, surrounding a smaller, hotter (T > 800 K) structure, confirming earlier constraints (Jaffe et al. 2004). It is likely that the dust and gas in the torus are not smoothly distributed but rather located in clumpy clouds (e.g. Elitzur & Shlosman 2006). This can explain the velocity dispersion observed in the centres of galaxies, which overestimates the temperature if the distribution would be of thermal origin, the different critical densities indicated by different emission lines and the long-term variability of the column density of certain AGN (Krolik & Begelman 1988, 1986).
4.3 Unified scheme
in-trinsically similar objects. In this model, AGN are divided into two basic types: a radio-quiet and radio-loud group. Sources in both groups can have a range of intrinsic luminosities, but all other properties, such as the observed spectral lines, result solely from orientation effects. The basic model for the radio-quiet sources assumes a broad-line region (BLR) and an optical featureless continuum which originates from the central source. This is surrounded by an obscuring torus and a narrow-line region (NLR), and a weak jet is present, perpendicular to the torus. If the source is observed face-on, emission lines from both the NLR and the BLR can be observed, and the source is classified as a Type 1. Objects which are observed edge-on will show only emission from the NLR since the BLR is obscured. These AGN are classified as Type 2 objects. In the case of a Type 2 source, reflected light can reveal the emission from the BLR near the nucleus. This has been shown for example using radio polarization observations, where the Type 2 source NGC 1068 showed a Type 1 core with broad emission lines in polarized light (Antonucci & Miller 1985). In case of radio-loud sources there are additional twin jets emitting relativistically boosted synchrotron radiation.
Urry & Padovani (1995) expanded on this model to unify the radio-loud sources, again assuming that the appearance of a source is strongly dependent on the orientation, which is based on the strong anisotropic radiation caused by beaming and obscuration by the dust torus. Figure 4.5 shows a diagram of this model. In this model, the radio galaxies are the parent population of the blazars, which have beamed emission with respect to the observer. FR-II radio galaxies appear as luminous quasars when the jet is close to the line of sight, and FRI type radio galaxies would be seen as BL Lac objects. This distinction is based on observational characteristics, such as radio and IR properties, host galaxies, and statistical properties from X-ray and radio surveys.
In a spectral energy distribution (SED), the frequency times flux (νf (ν)) or the frequency times luminosity (νL(ν)) is plotted versus the frequency ν (or wavelength λ or energy E), both on a logarithmic scale, enabling a broad view over decades in frequency and flux. The SED of a source is influenced by its beaming factor and jet presence. For example, Figure 4.6 shows the SED of the blazar Markarian 421, which has a redshift of z = 0.031 (Abdo et al. 2011). The emission from this source is dominated by non-thermal, Doppler-boosted jet emis-sion, resulting in a typical double-humped shape. In Figure 4.7 the SED of a radio-quiet, non-beamed source is shown, of the Seyfert Type 1 galaxy Markarian 509 at z = 0.034 (Kaas-tra et al. 2011). Since the emission is not dominated by a relativistic jet, features from the central engine can be observed, such as the infrared emission from dust heated by the central engine and the thermal emission of the accretion disk.
About 10% of AGN show jets and it is not clear why some sources do exhibit significant jets and some do not. In order to distinguish between sources with significant jet emission, the term of radio loudness has been introduced. Radio loudness is commonly defined as the ratio between the radio flux at 5 GHz F5GHz and the optical flux in the B-band FB, where an object
with F5GHz/FB≥ 10 is considered radio-loud (Kellermann et al. 1989). A connection to the
SMBH spin was postulated as an explanation for jet presence, where fast rotating SMBH could drive a jet (see for example Wilson & Colbert 1995). Radio-loud sources are commonly found in elliptical host galaxies which show merger activity, whereas radio-quiet sources are found in less luminous spiral hosts (Smith et al. 1986). This might link recent (t ≤ 109yr) merger activity to radio-loudness. Here it is expected that after the two galaxies collide,
4.3 Unified scheme
Figure 4.5: Schematic depiction of the AGN unified model (Urry & Padovani 1995, adapted). The upper half of the diagram shows the loud case, the lower half the radio-quiet version. The small dots represent the broad-line region, the larger dots the narrow-line region. The torus, surrounding the central super-massive black hole and accretion disk, is shown in orange.
both the central SMBHs will coalesce on a time scale less than the Hubble time. Wilson & Colbert (1995) have shown that in the event of a merger, if both SMBH are of equal mass a high-spin SMBH can result. But King et al. (2013) showed by modeling the X-ray spectra of a sample of 37 Seyfert sources that a majority of these radio-quiet sources show a high spin. A correlation was found by Laor (2000) between the mass of the SMBH and the radio-loudness. In a sample of 87 quasars, all sources with a SMBH mass of MBH > 109M⊙ are
radio-loud, whereas all sources with a SMBH mass of MBH < 3 × 10⁸ are radio-quiet. This
lead to the idea that the unification of AGN could be summed up in 3 parameters: inclination angle, SMBH mass, and Eddington ratio Lbol/LEdd, which is a tracer of the mass accretion
rate. Using a sample of 80 sources with known SMBH mass, Ho (2002) showed that the radio loudness-SMBH mass division as deduced by Laor (2000) did not hold, as radio-loud sources with SMBH masses in the range ∼ 106− 109M
⊙ were found. In addition, the sample yielded
an inverse correlation between the radio luminosity at 5 GHz and the Eddington ratio, which would indicate that the radio luminosity increases as the mass accretion rate decreases.
Other theories on why some sources are radio loud and can therefore be considered to host a strong jet include other characteristics of the AGN. For example, Sikora & Begelman (2013) argued that the magnetic flux threading the SMBH is most important to launch a jet, rather than the SMBH spin or the Eddington ratio. According to this theory a jet can be produced if enough flux can be accumulated to form a magnetically chocked accretion flow (see Narayan et al. 2003). This can be achieved by a hot accretion flow, followed by a massive cold accretion event, which can be caused by a merger event for example. Here, the hot accretion flow drags the magnetic flux in, which is compressed by the cold accretion flow, invoking a magnetically
Figure 4.6: SED of Markarian 421, a high-synchrotron peaked BL Lac object (Abdo et al. 2011). This SED has been modelled with three different one-zone synchrotron self-Compton models (see also Section 7.6.1 for these types of models).
choked flow necessary to launch a jet. 4.3.1 The blazar sequence
The spectral energy distribution (SED) of blazars tends to have a typical shape, which can be seen for example in Figure 4.6. This particular double-hump structure is often explained using synchrotron self-Compton (SSC) of a population of electrons in the jet, where synchrotron emission forms the low-energy branch and inverse Compton (IC) emission accounts for the second feature (see Section 7.6.1 for a more extensive description of this mechanism). Blazars can be subdivided into two groups, depending on the equivalent width (EW) of the emission lines in the optical band. Flat Spectrum Radio Quasars (FSRQ) have emission lines with an equivalent width EW> 5˚A, and BL Lac show emission lines that have EW< 5˚A. The BL Lac objects are then subdivided into three classes, based on the peak frequency of the synchrotron branch in the SED (Padovani & Giommi 1995a). The low-frequency peaked BL Lac objects (LBL) show a synchrotron peak frequency in infrared, the intermediate-frequency peaked (IBL) have a synchrotron peak in optical or UV, and the high-frequency peaked ob-jects (HBL) display a synchrotron peak frequency in UV or soft X-rays (Padovani & Giommi 1995b; Bondi et al. 2001). This distinction was initially based on sources being either radio or X-ray selected, with the radio selected BL Lacs belonging to the LBL class and the X-ray selected ones to the HBL class. With advancing observational techniques and using surveys with different sensitivity, the distinction based on the peak frequency, and thus on the overall spectral energy distribution, appeared more physical, though. Apart from the difference in peak frequency, HBL and LBL tend to have different physical parameters, for example the HBL are on average less powerful, show a lower degree of polarisation and variability.
When studying the X-ray spectra of 114 FSRQ sources, Padovani et al. (1997) found a mean spectral energy index of αx∼ 1 in the 0.4–2.0 keV band. This spectral index is similar
4.3 Unified scheme
Figure 4.7: The SED of Seyfert 1 object Markarian 509, based on simultaneous data from the infrared up to the hard X-ray domain (Kaastra et al. 2011). The data has been corrected for both Galactic and intrinsic absorption. A radio measurement at 30 GHz gives a flux level of only νfν = 4.6 × 10⁻¹⁸erg cm−2s−1Hz−1, and is
therefore not included in the SED.
energy index closer to αx ∼ 1.5. The FSRQ also show a concave shape of the
optical-to-X-ray continuum, implying that inverse Compton processes dominate the emission in the X-optical-to-X-ray band. Similar results were found for LBL sources, whereas for HBL sources the X-ray band is part of the synchrotron branch.
Fossati et al. (1998) showed that a correlation exists between the luminosity of a source and the peak frequency of the synchrotron branch, using a sample of 126 blazars from different surveys. This blazar sequence can be seen in Figure 4.8 which shows average SEDs for FSRQ and the three BL Lac types. A correlation between the peak frequencies of both synchrotron and inverse Compton component was found as well, suggesting a similar origin of the emission for the different blazar classes. The ratio between the luminosities in the inverse Compton branch and the synchrotron branch (the Compton dominance), increases for more luminous sources, indicating the broad-band emission of these sources is more dominated by inverse Compton emission. An explanation for this behaviour is possibly the cooling of radiating electrons in the jet. The cooling depends on the jet power and the strength of the diffuse radiating field, such as the BLR, surrounding the jet (Ghisellini et al. 1998). A powerful jet will have a larger electron density compared to a weak jet, allowing efficient cooling of the electrons. The strong external radiation field is also contributes to the cooling of electrons. In BL Lac sources the emission lines originating from the BLR are either weak or absent, supporting the theory of a weaker external photon field in less luminous sources. Later work has shown that this theory does not hold for all individual sources but rather for large sam-ples. For example, Padovani et al. (2002) showed a FSRQ where the emission in the X-ray band was due to synchrotron processes, rather than caused by the expected inverse Compton emission.
Figure 4.8: Average SEDs for different blazar types (Fossati et al. 1998). The most powerful sources are the Flat Spectrum Radio Quasars (FSRQ), which show a synchrotron peak at radio to infrared, and the peak of the inverse Compton branch in the X-ray to soft gamma-X-ray branch. The high-frequency peaked BL Lac objects (HBL) are the least powerful in this sequence and show a synchrotron peak in the X-ray band and a peak of the inverse Compton emission in the VHE domain.
More recent theories to explain the blazar sequence connect the behaviour of different source classes to accretion rate, which is linked to the jet power, and the black hole mass, as it is proportional to the dissipation region of the jet (Ghisellini & Tavecchio 2008). In this scenario BL Lac objects tend to have central black holes of lower mass, and a lower accretion rate than FSRQ. Meyer et al. (2011) proposed a scenario which divides the blazar population into two categories based on jet power. Using a sample of 216 blazars and 41 radio galaxies, the peak frequency of the synchrotron branch and luminosity at the peak frequency were calculated. The resulting synchrotron peak luminosity versus peak frequency diagram can be found in Figure 4.9, which shows two different branches. The tracks A and B demonstrate the path of a source in progressive misalignment, for a powerful source (track A) and a weak source (track B). Weak sources, which includes most BL Lac objects and the FR-I radio galaxies, show a decelerating, low power jet which can be connected to radiatively inefficient accretion. The sources which display a strong jet, most FSRQ and FR-II radio galaxies, show radiatively efficient accretion.
Using Compton dominance, a quantity not altered by redshift, Finke (2013) found a cor-relation between Compton dominance and the synchrotron peak frequency for a sample with 886 blazars from the 2LAC catalogue. This sample does not show the two branches found by Meyer et al. (2011) in the plot of the synchrotron peak luminosity versus the peak frequency, as can be seen in the right panel of Figure 4.9. A simple model is constructed where the differences between blazar classes are introduced by the magnetic field of the emitting region,
4.3 Unified scheme
Figure 4.9: Plot of synchrotron peak luminosities versus the peak frequencies showing results from different samples.
(a) Results found by Meyer et al. (2011) using 257 blazars.
(b) Results found by Finke (2013), using a sample of 886 blazars.
the external radiation field density and the jet angle. The HBL with a low magnetic field and a weak external radiation field will show a synchrotron peak at a high frequency due to the lack of cooling either by synchrotron emission or Thomson scattering. If the magnetic field and external radiation field increase, cooling will play a more important role, decreasing the synchrotron peak frequency, and if the cooling increases to a certain level it will enter a fast- cooling regime for the FSRQ. In this scenario an external Compton component, using seed photons from a source outside the jet, is used, in addition to the SSC process. When only the SSC process is assumed, the Compton dominance is not dependent on the jet angle. However, if external Compton scattering is assumed, the Compton dominance becomes angle-dependent. This is particularly important for FSRQ, since a correlation between angle and Compton dominance was found, implying a necessity for an external Compton component in the SED. For BL Lac objects, the SSC process alone provides a good fit for the SED.
Zhang et al. (2013) postulated the jet launching mechanism to be different in the different blazar classes, based on SED fits. No statistical difference was found in the Doppler factors of the jet emission for either BL Lacs or FSRQ. It was found that the jet emission from FSRQ is dominated by the Poynting flux2 and the jets have a high radiative efficiency. For FSRQ the jet power is proportional to the SMBH mass, and FSRQ jets are highly magnetized, which would indicate the jets are produced by the Blandford-Znajek mechanism, which relies on the black hole spin (see Blandford & Znajek 1977). The jets from BL Lac objects are rather dominated by particles and have lower radiation efficiency. For BL Lac objects there is an anti-correlation between the jet power and the SMBH mass, indicating a different launching mechanism, such as for example the Blandford-Payne mechanism (see Blandford & Payne 1982), where angular momentum is extracted from the accretion disk.
2It is assumed the jet power is carried by the bulk motion power of particles (relativistic electrons and cold