UNIVERSITÉ DE MONTRÉAL
DYNAMIC MODELING AND INTERMITTENT OPERATION OF A FLOW-THROUGH MICROBIAL ELECTROLYSIS CELL
SYED AZFAR HUSSAIN
DÉPARTEMENT DE GÉNIE CHIMIQUE ÉCOLE POLYTECHNIQUE DE MONTRÉAL
THÈSE PRÉSENTÉE EN VUE DE L’OBTENTION DU DIPLÔME DE PHILOSOPHIAE DOCTOR
(GÉNIE CHIMIQUE) JUIN 2018
ÉCOLE POLYTECHNIQUE DE MONTRÉAL
Cette thèse intitulée :
DYNAMIC MODELING AND INTERMITTENT OPERATION OF A FLOW-THROUGH MICROBIAL ELECTROLYSIS CELL
présentée par : HUSSAIN Syed Azfar
en vue de l’obtention du diplôme de : Philosophiae Doctor a été dûment acceptée par le jury d’examen constitué de :
M. HENRY Olivier, Ph. D., président
M. PERRIER Michel, Ph. D., membre et directeur de recherche
M. TARTAKOVSKY Boris, Ph. D., membre et codirecteur de recherche M. SRINIVASAN Bala, Ph. D., membre
DEDICATION
This thesis is dedicated to
ACKNOWLEDGEMENTS
I am extremely grateful to my Ph.D supervisors, Dr. Michel Perrier and Dr. Boris Tartakovsky. I have learnt a lot during my Ph.D studies. I am thankful to Michel for his able guidance
throughout my studies. I also want to express my deep gratitude to Boris, for always being there to answer my questions and to motivate me.
I would also like to thank my colleagues at National Research Council, Didac, Jerome, Javier, Michelle, Fred and Fréderique for always being there to help me in the laboratory work and in computer programing.
It has been a beautiful journey and I have a lot of good memories to cherish throughout my life. Thank you.
RÉSUMÉ
La pile microbienne électrolytique (MEC) représente une nouvelle technologie qui peut être appliquée pour le traitement des eaux usées combiné avec la production d'hydrogène ou de biogaz. La MEC est un dispositif bioélectrochimique, qui contient une anode et une cathode connectées à une alimentation externe. La modélisation dynamique et l'optimisation de réacteurs basés sur une MEC représentent plusieurs défis.
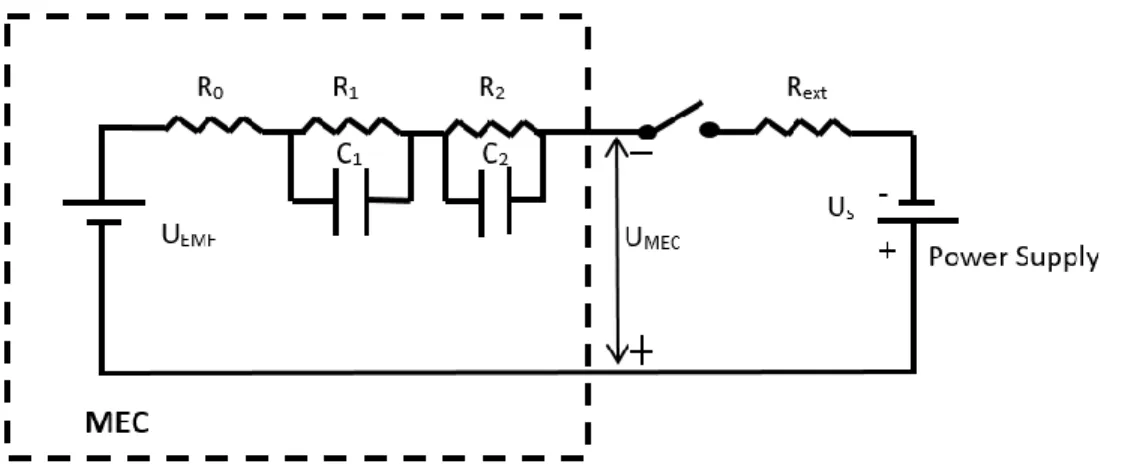
Cette thèse commence par la présentation de la MEC de type « circuit équivalent électrique » (EEC), qui fournit un outil pour la surveillance en temps réel et permet l'estimation des paramètres de la MEC. Lors du traitement des eaux usées, une surveillance en continue des MEC est essentielle pour assurer des performances adéquates, et à cet égard, le modèle EEC le permet. Le modèle EEC de base implique deux résistances (R0 décrivant les pertes ohmiques et R1 les pertes d'activation) connectées en série avec la force électromotrice interne (FEI). De plus, la croissance du biofilm est représentée par la capacitance (C) connectée en parallèle avec R1. Ses paramètres électriques internes peuvent être estimés numériquement en minimisant la différence entre le courant théorique et mesuré de la MEC. De plus, les mêmes paramètres peuvent être estimés en utilisant une solution analytique du modèle EEC. Dans ce cas, la MEC doit être utilisée pendant une courte période (par exemple 1 à 2 minutes) avec une connexion intermittente de l'alimentation électrique. Une telle connexion est effectuée à des fréquences hautes et basses pour estimer R0 (à haute fréquence) et R1 et C (à basse fréquence). De plus, la FEI est estimée par la MEC dans des conditions de circuit ouvert. Pour démontrer l'approche proposée, des expériences ont été effectuées avec plusieurs concentrations de sources de carbone entrantes. Les paramètres électriques internes de la MEC ont été estimés à des intervalles de 6h. Le modèle EEC a permis de décrire avec succès la dynamique électrique de la MEC et de suivre les changements des paramètres électriques. Grâce à la simplicité du modèle, il peut être utilisé pour développer un système de surveillance et de diagnostic des MEC en temps réel. Un tel système de suivi en continu pourrait être essentiel au bon fonctionnement des systèmes de traitement des eaux usées à grande échelle basés sur les MEC. Les paramètres du modèle EEC fournissent un aperçu des performances des MEC soumises à diverses perturbations en temps réel. Cette thèse présente des résultats pour la surveillance en temps réel de MEC avec différentes concentrations influentes.
Avec l'augmentation de la concentration de l'influent, il y a une diminution subséquente de la résistance interne de la MEC et une augmentation de la C interne.
La thèse explique également en détail les performances à long terme de MEC sous connexion intermittente de l'alimentation électrique (mode marche/arrêt). Cette étude décrit une nouvelle approche pour atteindre une performance stable à long terme et maximiser l'élimination de la demande chimique en oxygène (DCO) dans une MEC. Dans l'approche proposée, la tension appliquée sur la MEC est périodiquement déconnectée, par exemple à une fréquence de 0,1 à 0,5 Hz et un rapport cyclique de 90 à 95%. Pour évaluer l'impact d'une telle intermittence de tension sur les performances de la MEC, des expériences ont été réalisées avec deux MEC à écoulement continu avec des électrodes de charbon activé granulaire. La stratégie d'exploitation d’une connexion intermittente a été appliquée à une MEC, tandis que l'autre a fonctionné à une tension fixe (MEC de contrôle). Un fonctionnement intermittent à long terme a entraîné une augmentation progressive de l'efficacité d'élimination de la DCO et du courant de la MEC avec le temps, tandis que la MEC de contrôle a montré des performances inférieures. De plus, en changeant la stratégie d'exploitation et en appliquant une connexion intermittente à la MEC de contrôle, ses performances ont été considérablement améliorées. L'amélioration des performances pendant la phase intermittente a été confirmée par la surveillance en continu de la résistance interne et de la C des MEC. Le mode de fonctionnement intermittent proposé peut être utilisé pour développer un système de traitement des eaux usées à haut débit basé sur les MEC.
Un modèle bioélectrochimique dynamique d’une MEC, dont les compartiments anodiques et cathodiques sont connectés en série, est également présenté dans cette thèse. Le modèle peut être utilisé pour estimer le courant circulant dans la MEC et la concentration du substrat de l'effluent. Les paramètres du modèle sont obtenus par une procédure d'estimation des paramètres numériques. Les résultats de la simulation correspondent assez bien aux données expérimentales. La thèse comprend également un modèle de biofilm une dimension (1D), qui décrit les changements de distribution de la source de carbone dans le biofilm électrochimiquement actif à l'anode. Le modèle est capable de prédire le courant obtenu dans une MEC ayant une tension intermittente.
ABSTRACT
Microbial electrolysis cell (MEC) represents a novel technology that can be applied for wastewater treatment combined with hydrogen or biogas production. MEC is a bioelectrochemical device, which houses anode and cathode connected to an external power supply. Dynamic modeling and optimization of a MEC-based reactor faces several challenges. This thesis starts from presenting an equivalent electrical circuit (EEC) model of MEC, which provides a tool for online monitoring and parameter estimation of MEC. When treating wastewaters, continuous MEC monitoring is essential to ensure adequate performance, with this regard, the electrical equivalent circuit (EEC) model enables on-line parameter estimation and monitoring of a continuous flow MEC. Such simple EEC model involves two resistances (describing ohmic losses, R0, and activation losses, R1) connected in series with internal electromotive force (EMF). Also, biofilm growth is represented by capacitance (C) connected in parallel with R1. These internal electrical parameters can be estimated numerically by minimizing the difference between the measured and predicted MEC current. Also, the same parameters can be estimated using an analytical solution of the EEC model. In this case, the MEC needs to be operated for a short time (e.g. 1-2 min) with intermittent connection to the power supply. Such intermittent connection is performed at high and low frequencies to estimate R0 (at high frequency) and R1 and C (at low frequency). Also, EMF is estimated by MEC under open circuit conditions. To demonstrate the proposed approach, experiments were carried out at several influent carbon source concentrations. MEC internal electrical parameters were estimated at 6h intervals. The EEC model successfully described electrical dynamics of the MEC and tracked changes in electrical parameters. Owing to the model simplicity, it can be used to develop a real-time MEC monitoring and diagnostics system. Such an on-line tracking system might be essential for successful operation of large scale MEC-based wastewater treatment systems. EEC model parameters provide an insight of MEC performance subjected to various perturbations in real time. This thesis presents results for online monitoring of MEC with different strength of influent concentrations. With the increase in influent concentration there is a subsequent decrease in internal resistance of MEC and increase in internal capacitance.
Furthermore, the thesis also explains in detail long term performance of MEC under intermittent connection/disconnection of power supply. This study describes a new approach for achieving stable long-term performance and maximizing removal of chemical oxygen demand (COD) in a Microbial Electrolysis Cell (MEC). In the proposed approach, the MEC applied voltage is periodically disconnected, e.g. at a frequency of 0.1 – 0.5 Hz and a duty cycle of 90-95%. To evaluate the impact of such periodic voltage disconnection (on/off mode) on MEC performance, experiments were carried out in two flow-through MECs with activated granular carbon electrodes. The on/off operating strategy was applied to one MEC, while the other one was operated at a fixed voltage (control MEC). Long-term on/off operation resulted in progressive increase in COD removal efficiency and MEC current over time, while the control MEC showed inferior performance. Furthermore, by changing the operating strategies and applying the on/off strategy to the control MEC, its performance was significantly improved. Performance improvement during on/off operation was confirmed by on-line monitoring of MFC internal resistance and capacitance. The proposed on/off mode of operation can be used to develop a high-rate MEC-based wastewater treatment system.
Dynamic bioelectrochemical model of MEC, which considers anodic and cathodic compartments connected in series, is also presented in this thesis. The model can be used to estimate current flowing through the MEC and effluent substrate concentration. Model parameters are estimated by numerical parameter estimation procedure. The simulation results provide a fairly good fit with the experimental data. Thesis also includes 1D biofilm model, which describes changes in carbon source distribution in the electrochemically active biofilm at anode under on/off operation of power supply. The model is able to predict current flowing through the MEC with periodic applied voltage.
TABLE OF CONTENTS
DEDICATION ... III ACKNOWLEDGEMENTS ... IV RÉSUMÉ ... V ABSTRACT ... VII TABLE OF CONTENTS ... IX LIST OF TABLES ... XII LIST OF FIGURES ... XIII LIST OF SYMBOLS AND ABBREVIATIONS ... XV LIST OF APPENDICES ... XVICHAPTER 1 INTRODUCTION ... 1
CHAPTER 2 LITERATURE REVIEW ... 5
2.1 Characterization and optimization ... 6
Approaches for Performance Optimization ... 6
2.1.1 Real time Optimization ... 6
2.1.2 Arrangements of electrodes ... 8
2.1.3 Biocathode ... 9
2.1.4 Optimum Applied Voltage ... 10
2.1.5 Effect of Current on MEC Performance ... 12
2.1.6 Effect of external resistance on MFC performance ... 13
2.1.7 Intermittent connection of external electrical load during MFC ... 14
2.1.9 Performance of Membraneless MEC ... 17
2.2 Dynamic Modeling ... 17
2.2.1 Biofilm Modeling ... 18
2.2.2 Multi-population models ... 20
2.2.3 Electrical Equivalent Circuit Model ... 22
2.2.4 Long term dynamics of bioelectrochemical models ... 23
CHAPTER 3 REAL-TIME MONITORING OF A MICROBIAL ELECTROLYSIS CELL USING AN ELECTRICAL EQUIVALENT CIRCUIT MODEL ... 27
3.1 Analytical methods and media composition ... 27
3.2 MEC design, operation, and performance evaluation ... 28
3.3 Electrical measurements and numerical methods ... 30
3.4 Results and discussion ... 31
3.4.1 COD removal in flow – through MEC ... 31
3.4.2 EEC model development ... 34
3.4.3 Comparison of EEC models ... 36
3.4.4 Parameter estimation by analytical method ... 38
3.4.5 Real-time MEC monitoring ... 40
3.5 Conclusion ... 44
CHAPTER 4 LONG-TERM PERFORMANCE OF A MICROBIAL ELECTROLYSIS CELL OPERATED WITH PERIODIC DISCONNECTION OF APPLIED VOLTAGE ... 45
4.1 Media solutions and Analytical Methods ... 46
4.2 MEC design and operation ... 47
4.3 Electrical measurements and numerical methods ... 48
4.5 Results and discussion ... 49
4.5.1 Duty cycle optimization and the impact of on/off operation on MEC performance ... 49
4.5.2 Online MEC monitoring and electrochemical characterization ... 54
4.5.3 Conceptual biofilm model ... 60
4.6 Conclusion ... 62
CHAPTER 5 DYNAMIC MODELING OF A MICROBIAL ELECTROLYSIS CELL ... 64
5.1 MEC design and operation ... 64
5.2 Electrical measurements and numerical methods ... 64
5.3 RESULTS AND DISCUSSION ... 66
5.3.1 Dynamic Model of a Continuous Flow Microbial Electrolysis Cell ... 66
5.3.2 1-Dimensional anodophilic biofilm model ... 73
5.4 Conclusion ... 81
CHAPTER 6 CONCLUSION, SCIENTIFIC CONTRIBUTION AND PERSPECTIVES .... .83
BIBLIOGRAPHY ... 88
APPENDICES ... 99
LIST OF TABLES
Table 2.1: Parameter estimation results ... 36
Table 3.1:Internal resistance and capacitance of MECs based on electrochemical techniques ... 57
Table 4.1: Model parameters for global bioelectrochemical model of MEC ... 69
LIST OF FIGURES
Figure 1.1: Schematic diagram of MECs with different electrode arrangements ... 8
Figure 1.2: Electrical equivalent circuit of MEC for impedance data analysis ... 9
Figure 1.3: sCOD removal and gas volume in MEC at different applied voltage ... 10
Figure 1.4: Methane production in MEC at different applied voltage ... 11
Figure 1.5: Rate of sulfate ions removal in MEC at different applied current ... 12
Figure 1.6: Experimental setup for online monitoring of MFC ... 15
Figure 1.7: Performance of MEC for SM and WW ... 16
Figure 1.8: Electrical equivalent circuit of MFC ... 23
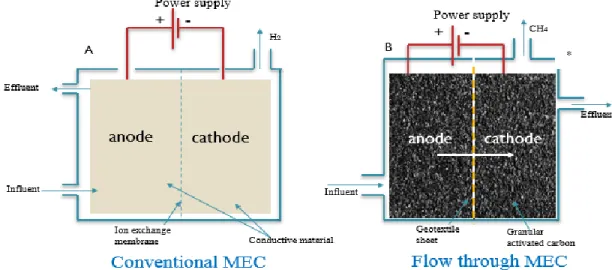
Figure 2.1:Conventional and flow-through MEC ... 27
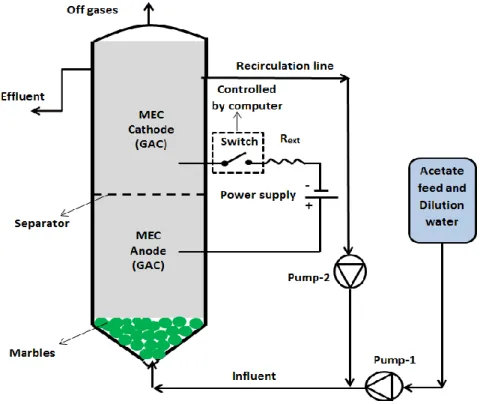
Figure 2.2: Experimental setup for online monitoring of MEC ... 28
Figure 2.3: COD removal, methane production and current gerenation in MEC ... 32
Figure 2.4: Open circuit voltage test for MEC ... 32
Figure 2.5: Electrical equivalent circuit of MEC for online monitoring ... 33
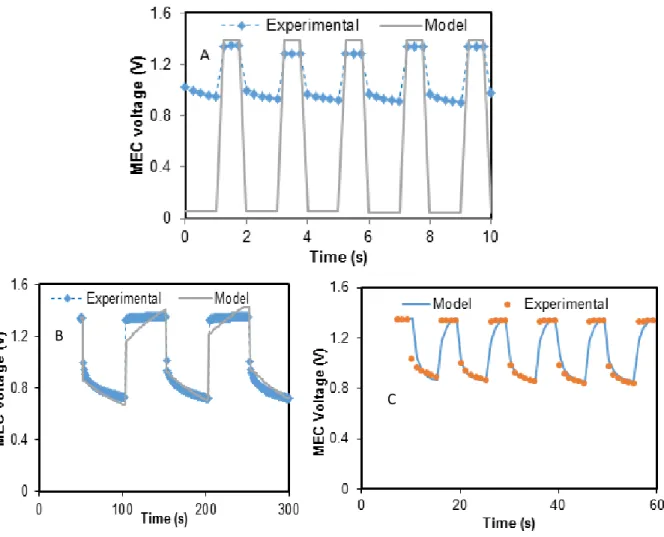
Figure 2.6: Comparison of experimental & simulated MEC voltage for different EEC models ... 36
Figure 2.7: Online monitoring of MEC ... 40
Figure 2.8: Comparison of numerical and analytical parameter estimation ... 42
Figure 3.1: Experimental setup for MEC on/off opeartion ... 45
Figure 3.2: Average current of MEC with different duty cycles and cycle lengths ... 49
Figure 3.3: Effect of long term on/off operation on current ... 50
Figure 3.4: Effect of on/off operation on effluent concentration & methane production ... 52
Figure 3.5: Online monitoring of MECs for acetate and WW feed ... 53
Figure 3.6: MEC average current & effluent concentration with real WW feed ... 54
Figure 3.8: Cyclic voltammetry ... 57
Figure 3.9: Carbon source distribution in a two layer electroactive biofilm ... 59
Figure 4.1: Schematic diagram of MEC ... 63
Figure 4.2: Sensitivity analysis ... 66
Figure 4.3: Simulation results for bioelectrochemical model of MEC ... 67
Figure 4.4: Simulation results of MEC model to estimate current & efflunet concentration ... 68
Figure 4.5: Schematic diagram of 1D biofilm model of MEC ... 71
Figure 4.6: Substrate consumption across the biolfilm (50% duty cycle) ... 72
Figure 4.7: Change in concentration across the biofilm (constant applied voltage) ... 73
Figure 4.8: Result for 1D biofilm MEC simulation ... 74
Figure 4.9:Effect of Ks on current ... 75
Figure 4.10:Effect of Kr on current ... 76
Figure 4.11:Effect of Ro on current ... 77
Figure 4.12:Effect of Rint on current ... 78
Figure A.1:Influent carbon concentartion ... 106
Figure A.2:Online monitoring of MEC ... 107
Figure A.3:On/off operation of MEC with different influent carbon sources ... 108
Figure A.4:Cyclic voltammetry with influent concentration 500 mg/L ... 109
Figure A.5:Voltage scan tests with different influent concentration ... 110
LIST OF SYMBOLS AND ABBREVIATIONS
The list of symbols and abbreviations used in this thesis are presented below. AD Anaerobic digestionADM1 Anaerobic digester model 1 CCe Cathodic columbic efficiency COD Chemical oxygen demand D Duty cycle
ECE Electrical conversion efficiency ECF Electro counter force
EEC Equivalent electrical circuit EMF Electromotive force
HRT Hydraulic retention time IWA International water association MFC Microbial fuel cell
MEC Microbial electrolysis cell MPPT Maximum power point tracking MRT Minimum resistance tracking OCV Open circuit voltage
OLR Organic load rate
PEM-FC Proton exchange membrane fuel cell P/O Perturbation Observation
sCOD Soluble oxygen demand SM Synthetic medium WW Wastewater
LIST OF APPENDICES
Appendix A – Electrical equivalent circuit ... 99
Appendix B – Analytical solution of of single R/C circuit model #2 ... 101
Appendix C – Symbols and notations ... 103
CHAPTER 1 INTRODUCTION
Microbial Electrochemical Cell (MEC) represents a novel technology, which can be used for wastewater treatment and hydrogen or biogas (mostly methane) production. External electrical energy is provided to MEC in order to facilitate the electron transfer from anode to a cathode lacking oxygen.
MEC is a bioelectrochemical device, which oxidizes organic materials by utilizing an anode as a terminal electron acceptor and combines electrons and protons at the cathode to produce hydrogen or methane. Wastewater treatment in a MEC results in a net energy production as opposed to an energy consumption, which is the case in conventional aerobic (activated sludge) treatment systems. Unlike conventional anaerobic reactors, MEC can be used for treating wastewaters with low organic content, e.g. domestic wastewater.
Motivation
MECs can be seen as an extension of the anaerobic digestion (AD) technology. As mentioned above, a MEC degrades organic materials at one electrode (anode) with the production of hydrogen or methane at another electrode (cathode) if external electrical supply is provided to overcome thermodynamic limitations of this bioelectrochemical process. MEC can be used to treat wastewater as well as to produce biofuel (H2 or CH4) or even valuable chemical products. Unlike conventional anaerobic reactors, the flow-through MEC can be used for treating wastewaters with low organic content, e.g. domestic wastewater. Methanogenic microorganisms have low affinity to a carbon source. accordingly, anaerobic reactors require a wastewater concentration of at least 2 g/L for successful operation. electroactive (anodophilic) bacteria were shown to exhibit higher affinity to the carbon source as compared to the methanogens (Pinto et al. 2010). Anaerobic treatment needs an additional aerobic reactor to further reduce the effluent concentration to satisfy discharge norms (aerobic polishing), while MEC – based systems were shown to achieve low effluent chemical oxygen demand (COD) concentrations (Clauwaert et al. 2009). Since aerobic treatment requires significant amounts of electricity, anaerobic treatment followed by aerobic polishing is much less energy efficient than the MEC treatment, which combines both treatment steps and produces biogas. In addition, methane percentage in an
anaerbic digester off-gas is around 50-60% whereas in MEC it is 80-85% (Amro et al. 2017). While several existing studies demonstrated MECs application for wastewater treatment, there are very few attempts to model or control MEC-based systems .
Problem definition
The research related to modeling dynamics of MECs is still at the very beginning. Currently published works focus on the reactor sizing and the design of electrodes with different shapes, size and material of construction. MEC performance was studied by minimizing the ohmic resistance by different arrangements of anode in the cell (Liang et al. 2011). External voltage is applied in MEC to overcome the thermodynamic barrier for the transfer of electrons from anode to cathode. Performance of MEC in terms of biogas production and soluble chemical oxygen demand removal was studied under different applied voltages (Linji et al. 2013). In a similar study, optimum methane production was analyzed by operating MEC under different applied voltage conditions (Ding et al. 2016). In a different approach, sulfate removal efficiency in a MEC was studied with variable current applied to the reactor (Kia et al. 2017). Hydrogen production in MEC was studied at different concentrations of influent carbon source (Tartakovsky et al. 2012). Recently it has been demonstrated that the volumetric production of hydrogen has increased and expensive Pt-based cathode material in Proton Exchange Membrane (PEM) designs can be replaced with membraneless MECs with non-noble Me catalysts such as Ni, stainless steel, or tungsten carbide (Chae et al. 2008). These improvements have made the scale-up of MECs more realistic and pragmatic.
However, in order to maximize the MECs performance the behaviour of different electrical variables should be studied. In particular, intermittent connection/disconnection of the power supply to MEC has not been studied yet. The electrical equivalent circuit (EEC) model could help in understanding of different electrical variables. Also, it offers some insight on the fast dynamics linked to the electrical properties of MEC.
It is very important to study the fast dynamics of the system. By operating MEC under high power supply switching frequency, it might be possible to unveil internal parameters. It is also possible to expect that the efficiency of MEC could be improved. Such MEC tests were never performed. Recently, microbial fuel cells (MFCs) have been operated with pulse width
modulation of the external resistance connection. Significant positive effect on MFC power output was observed. By applying this approach to MEC, it might be possible to achieve similar improvements to the MEC performance.
Equivalent circuit model lacks the predictive capacity of bio-electrochemical models such as recently developed two-population electrochemical MEC model. At the same time the bio-electrochemical models have the ability to predict the influence of various process inputs such as organic loading rate on MEC performance. Several recent studies demonstrated significant charge storage in electrochemical biofilms (Coronado et al 2012). Aiming to evaluate the impact of charge storage on MEC performance, the goal of this study is to couple the bio-electrochemical and electrical models and to develop a model suitable for practical applications, which require description of both fast and slow dynamics of MECs. The understanding of MEC dynamics is at its initial stages. In particular, fast electrical dynamics is not well understood and an electrical equivalent circuit has not been developed for MECs. There is no understanding about the effect of fast dynamics on MEC performance. And last but not the least, the dynamic model of MEC for reactor configuration in which the anodic and cathodic compartments connected in series has not been developed yet.
Objectives
The general objective of this thesis is to study the dynamic behavior and long term performance of MEC under intermittent connection/disconnection of the power supply.
Furthermore, dynamic modeling and online monitoring strategies of MEC are developed. The specific objectives are as indicated below:
1. Develop an Electrical equivalent circuit (EEC) model of a MEC and a procedure for online estimation of the model parameters.
2. Develop online monitoring strategies to monitor internal parameters of MEC under the influence of external disturbances.
3. Qualitatively study the long term effect of on/off operation of the power supply on MEC performance in terms of current, and chemical oxidation demand (COD) removal efficiency.
4. Develop one dimensional biofilm model of MEC, capable of describing the effect of on/off operation (variable duty cycles and cycle lengths) on MEC performance (in terms of current). 5. Present a global bioelectrochemical model of MEC with the anodic and cathodic compartments connected in series to estimate the current flowing through the MEC and effluent COD concentration.
Thesis structure
This document is divided into four main chapters. Chapter 1 presents thorough literature review related to the characterization and optimization of MEC, monitoring and optimal control of MEC biofilm modeling and dynamic models of bioelectrochemical system. Chapter 2 describes the EEC model development of MEC and procedure to estimate the model parameters. This chapter also explains the online monitoring procedure of MEC under different influent acetate feed perturbations. Chapter 3 presents the long term performance of MEC under intermittent connection of power supply. The performance of MEC is analyzed in terms of current flowing through the MEC and chemical oxidation demand (COD) removal from the influent carbon source. Chapter 4 consists of two parts, (i) presents global bioelectrochemical model of MEC. The model can be used to estimate the current flowing through the MEC and effluent concentration. The model is developed by assuming anodic and cathodic compartments of MEC connected in series. Model parameter are also estimated by comparing the model outputs and experimental results, and (ii) 1-D biofilm model of MEC. The model describes the effect of on/off operation of power supply on different model parameters across the biofilm depth.
Experimental setup, MEC design and operation, material and methods, and numerical calculations are presented separately in the chapters 2, 3 and 4.
CHAPTER 2 LITERATURE REVIEW
This chapter covers the two main aspects of the study. Firstly, approaches to performance characterization as well as optimization of MFC and MECs are reviewed. Secondly, a critical review concerning the existing models of MFCs, MECs, and biofilm systems is presented. The review includes bioectrochemial models as well as electrical equivalent circuit model recently developed for MFC monitoring. The similarities between MFCs and MECs are highlighted to justify the development of a similar MEC model for enhanced real-time process monitoring. As far as reactor architecture is concerned, a typical MEC consists of two electrodes. The anodic compartment houses an electrode covered in a biofilm colonized by electricigenic bacteria able to release electrons and protons from the oxidation of organic matter. Because of the presence of electrical potential difference, the resulting electrons are transferred to the anode surface and then to the cathode. Simultaneously, protons migrate to the cathode in the liquid phase and are combined with the electrons at the surface of cathode A typical reaction occurring at the cathode of MEC is the production of hydrogen. However, carbon dioxide, which is also released at the anode, can be transported to the cathode. This leads to a bioreaction in which methane is formed. In fact, there are two pathways, by which methane can be produced in a MEC. In one pathway, acetate produced by the decomposition of organic wastes is converted into carbon dioxide, protons and electrons at the anode as represented by following equation (Logan et al. 2006).
CH3COOH + 2H2O→2CO2+8H+ + 8e- (1.1)
At the cathode, hydrogen is produced by the direct electron transfer as follows (Logan et al. 2006).
2H+ + 2e- → H2 (1.2) The hydrogenophilic methanogens combine hydrogen with carbon dioxide to release methane as
described by the following reaction.
In the second pathway, protons and electrons are also produced at the anode according to the first equation, then methane is generated at the cathode by direct extracellular microbially catalyzed transfer of electrons where carbon dioxide reacts with electrons and protons to form methane. This reaction is not feasible without the catalyst because it requires energy to overcome the thermodynamic barrier, but presence of microorganisms can catalyze the reaction as given below.
CO2 + 8e- +8H+ → CH4 + 2H2O (1.4)
Recent advancements of MEC systems also demonstrated production of hydrogen peroxide and iso-butanol at the cathode (Rabaey et al. 2010).
2.1 Characterization and optimization
MECs present a technical challenge since their dynamics and internal mechanisms are poorly understood. Hence, dynamic modeling is a useful tool in order to better understand the system. The models of MECs have been prepared by using bio electrochemical tools that benefit from the knowledge of physics, biology and electrochemistry to represent the behavior at long term.
This approach is helpful in understanding the dynamics of the system at long term, but it lacks information on relationship between the electrochemical and electrical variables. Firstly, a critical review of existing biofilm models is presented followed by electrical equivalent circuit model of MFC and finally bio-electrochemical models of microbial cells are explained.
Approaches for Performance Optimization
A suitable technique to increase the efficiency of MEC is to increase the electron transfer from anode to cathode. MFC studies serve as a good example. Several studies have been done to increase the current generation in MFCs by operating with a pulse-width modulation at high frequency (Grondin, et al. 2012). The same principle can be applied to MECs.
2.1.1 Real time Optimization
Recent advancement in MEC research has resolved several limitations that are considered crucial for the development of an industrial MEC based process. For example, it has been demonstrated that the volumetric production of hydrogen can e substantially increased and an expensive Proton Exchange Membrane (PEM) design can be replaced with a membraneless MEC with non-noble
Me catalysts such as Ni, stainless steel, or tungsten carbide (Chae et al. 2008). These improvements have made the scale-up of MECs more realistic and pragmatic.
Also, it was demonstrated by Tartakovsky, Mehta et al. (2011) that the production of hydrogen gas can be maximized by real-time optimization of applied voltage. Real-time control system was found to efficiently track the changes in the operating conditions of a MEC, while keeping the production of H2 at the maximum achievable level. The applied voltage (Uapp) was periodically adjusted in order to minimize the apparent resistance (Ra) by using an online minimal resistance tracking (MRT) algorithm similar to the perturbation and observation (P/O) algorithm used previously to maximize the power output of a microbial fuel cell (Woodward, Perrier et al. 2010). Constant amplitude for each change of the applied voltage (∆U) was pre-set and the direction of the applied voltage was dependent on the sign of the gradient, which is determined by using the finite difference method. The value of internal resistance was estimated at time ti and it was
compared with the pervious estimated value ti-1. The algorithm is mathematically expressed by
the following equation:
( )
( )
( )
( ) (
(
)
)
− − − − − − + − = 2 1 2 1 1 int int i U i U i R i R U i U i U (1.5)where ∆U represents the input perturbation and i is the iteration number. The applied voltage was restricted between the upper and lower bounds to avoid the operation of MECs outside of the bioelectrochemical mode of operation, i.e. above the threshold value of water electrolysis.
𝑈𝑚𝑖𝑛 ≤ (𝑖) ≤ 𝑈𝑚𝑎𝑥 (1.6)
It was found that the hydrogen production increases with increase in Uapp until it reaches a
plateau. Simultaneously power consumption also increases with the increase in Uapp. The multi-
criteria optimization was formulated as:
where FH2 is the flow rate of hydrogen and P is the power consumption. Multi-criteria
optimization was minimized to a simpler problem:
The approach to maximizing hydrogen production based on Ra minimization was tested by using different influent COD concentrations and different types of influent wastewater. The tests confirmed the robustness of the proposed algorithm.
Overall, MEC performance can be greatly improved by minimizing the internal resistance. Internal resistance of the MEC can be affected by many factors, including material of construction for anode (Cheng et al. 2007; Liu et al. 2010; Logan et al. 2008), space between the electrodes (Cheng and Logan, 2011), configuration of cathode and the use of catalysts (Call et al., 2009; Hu et al. 2009; Selembo et al., 2009).
2.1.2 Arrangements of electrodes
Another important factor that could influence the performance of MEC by reducing ohmic resistance is electrode arrangement. In one of the arrangements, MEC was constructed by using anode as the graphite felt and cathode as carbon cloth (Liang et al. 2011). Two different arrangements were studied in this work; (i) Two anodes were placed in the reactor on both sides of the cathode and, (ii) Anodes were connected together on the same side of cathode. Figure 1.1 presents arrangements of anode in two MEC (MEC #1 and MEC # 2) in order to minimize the ohmic losses in MEC.
Figure 1.1: Schematic diagram of MECs with different electrode arrangements. Figures adopted from Liang et al. 2011.
It was observed that current was higher in MEC in which the anodes were placed separately on different sides of cathode as compared to the MEC which was constructed by placing anodes together on the same side of the cathode. Hydrogen production rate was also better for MEC#1. Internal resistance (solution resistance, polarization resistance and biofilm resistance) in MEC #1 were estimated by using EIS. Impedance analysis was carried out by an equivalent electrical circuit model of MEC with resistances and capacitance in parallel as shown in Figure 1.2.
Figure 1.2: Electrical equivalent circuit of MEC for impedance data analysis (Liang et al. 2011)
Impedance test results have shown that anode arrangement as depicted in MEC#1 in Figure 1.1 was favourable in reducing the total internal resistance in MEC.
2.1.3 Biocathode
Performance of MEC is greatly affected by the material used as the cathode. Platinum has been used and have shown good results in reducing the overpotential in MEC but there have been many concerns associated with the use of platinum, being an expensive noble metal. It is also poisoned by the presence of CO and sulphur compounds. Study carried out by Tahereh et al. (2015); describes the use of alternative metal catalysts. In particular, biocathode utilizes microorganisms creating an environmental friendly and inexpensive electrode. In a biocathode MEC, electrode serves as an electron donor for electroactive microorganisms, which catalyse the reaction of hydrogen production (Tahereh et al. 2015).
Performance of bio-cathode based MEC was examined in three different types of MECs based on their construction: (i) half biological chambered biocathode MEC, (ii) full biological two-chambered biocathode MEC, and (iii) full biological single-two-chambered biocathode MEC. Maximum hydrogen production was achieved in half biological two-chambered MEC. It was also observed that when MEC is operated at higher current density, hydrogen loss through the membrane becomes less significant. Single-chambered MEC offers less resistance to the flow of electrons (Tahereh et al. 2015). Growth of microbial community on biocathode film is greatly influenced by the reactor design size and flow pattern.
2.1.4 Optimum Applied Voltage
External voltage is applied to overcome the thermodynamic barrier in MEC for the transfer of electrons from anode to cathode. A study carried out by Linji et al. (2013) analysed the effect of different applied voltage on soluble chemical oxygen demand (sCOD) removal efficiency and biogas production. Experiments were carried out by using activated municipal waste sludge and varying the applied voltage from 0.6 V to 1.2 V. It was observed that the soluble COD (sCOD) maximum removal efficiency took place at the applied voltage of 0.8 V with the maximum columbic efficiency at 98.9%. Figure 1.3 shows the sCOD removal efficiency and columbic efficiency and biogas production at different applied voltages.
A
Figure 1.3: (a) sCOD removal at different applied voltage. (b) Gas volume at different applied voltage. Figure is taken from Linji et al. 2013.
These results indicate that maximum sCOD removal and biogas production occurs at an applied voltage of 0.8 V, while further increase in the applied voltage negatively affects the performance of MEC in terms of sCOD removal and biogas production.
Optimum applied voltage varies depending on the strength of influent concentration (organic loading rate, OLR) (Escapa et al. 2012). Different experiments were carried out by considering low and relatively high OLR, while operating the MEC reactor at different applied voltages to analyze the COD removal efficiency and hydrogen production. It was experimentally determined that the optimum applied voltage for treating low and high strength wastewater were 0.75 V and 0.85 V respectively. Hydrogen production displayed a Monod-type trend; it is highly dependent on influent carbon source concentration.
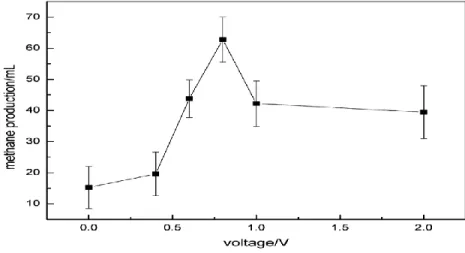
Another study carried out by Ding et al. 2016 determined optimum methane production at the applied voltage of 0.8 V. It was observed that further increase in the voltage decreases methane production as shown in Figure 1.4.
Dark fermentation effluent contains considerably high amounts of volatile fatty acids which needed to be treated before disposing it in the environment. The experiments carried out by Rivera et al. (2015) utilize dark fermentation effluent in two-chambered MEC for hydrogen production. MEC was operated at several COD concentrations (400 mg/L, 600 mg/L and 1200 mg/L) and at two different voltages (350 mV and 550 mV). Hydrogen production rate and COD effluent removal was studied under the above stated conditions. The robustness of MEC was evaluated by feeding the MEC with real effluent containing large amount of glucose. The substrate was composed of glucose, ethanol, acetate, propionate and butyrate with COD of 3700 mg/L. The reactor was operated under 350mV and 550 mV. The resulting biogas was mainly composed of methane and no hydrogen production was observed at the cathode chamber.
It was observed that MEC performs better when it was fed with dark fermentation effluent which contains VFAs. However, the performance of MEC in terms of hydrogen production was significantly decreased in the cathodic chamber, when substrate containing carbohydrates was used as the influent feed to MEC (Rivera et al. 2015).
2.1.5 Effect of Current on MEC Performance
Wastewater with high sulphate content is hazardous for the environment. MEC can be used to treat the sulphate-rich wastewater. In an experiment aimed at studying sulphate removal MEC was operated under different applied currents. It was observed that maximum sulphate removal occurs at 1.5 mA (Kia et al. 2017). As the applied current further increases the substrate consumption was observed to be decreased. High applied current also results in the cell membrane rupture. Following figure shows the removal of sulphate ions under different applied current values.
Figure 1.5: Rate of sulphate removal efficiency at different applied current. Figure taken from Kia et al. 2017
The results of this work indicate that there is an optimum value of the current (and corresponding voltage) in MEC. If the current is too high, it has detrimental effects on the biofilm formation, growth and metabolic activity of the microorganisms in MEC. However, the optimum current helps in the enrichment of the bacteria in the cathode film, consequently favouring the electron transfer to electrode (Kia et al. 2017).
Another study carried out by Tartakovsky et al. (2012) shows that the production of hydrogen gas in MEC is proportional to the strength of wastewater. The high strength wastewater led to higher rate of hydrogen production and vice versa. Another study carried out by Verea et al. (2014) focused on optimum production of hydrogen at low cost. The efficiency of hydrogen productivity was improved by the change in electrolyte conductivity and the electrode surface area/electrolyte volume ratio. It was observed that the hydrogen production rate was enhanced with the increase in electrolyte conductivity. Using this approach of maximizing hydrogen production through increased electrolyte conductivity and the optimization of electrode surface area/electrolyte volume ratio also improves cathodic reaction efficiency and columbic efficiency. It was observed that the hydrogen recovery rate was increased with the decrease in the volume of electrolyte when the electrode surface area was kept constant. The results obtained confirm that enrichment process of electroactive bacteria at anode is one of the important factors in improving hydrogen production in MEC (Verea at al. 2014).
2.1.6 Effect of external resistance on MFC performance
External resistance has a great influence on the power generation by MFCs. Maximum power can be harvested from MFCs when the external load (external resistance) equals to the internal
resistance (Logan 2008). Other factors such as temperature, pH and influent composition also affect the power generation by MFCs. Hence, a periodic adjustment of external load is required to maximize power production. The simplest way to operate the MFCs is to keep the external resistance constant, which results in severe power losses when the applied electrical load is not matched with the internal resistance (Logan 2008). Different electrical power sources like photovoltaic arrays and chemical fuel cells resolve this problem by online optimization of the electrical load. The electrical source is connected to a power converter and the duty cycle ratio or the current drawn by the converter is optimized by using a maximum power point tracking (MPPT) method (Esram and Chapman, 2007). The use of power convertor is out of the scope of this study, hence attention is paid to optimizing the electrical load.
2.1.7 Intermittent connection of external electrical load during MFC
In order to increase the power generation of an MFC (Grondin, et al. 2012) proposed to operate the MFC intermittently by alternating the value of external resistance from infinite (open circuit) to a fixed value. Internal MFC capacitance was exploited to develop novel power management methods (Fradler, et al. 2014). By periodically disconnecting the MFC from an electrical load, energy was internally stored and then released to enable a power output burst (Grondin, et al. 2012). Due to varying operating conditions and the process of biofilm growth and decay over time, significant changes of the total internal resistance over time can be expected. These changes result in a mismatch between the internal and the external resistance, even if the initial external resistance value was set close to optimal, hence decreasing MFC output (Grondin, et al. 2012). These mismatch can be reduced by adjusting the load (external resistance) connected to the MFC. This requires knowledge of internal resistance, which can be estimated by the polarization tests. This approach of controlling the equivalent resistance requires a detailed MFC characterization, since the growth rate of electricigenic microorganisms is unknown. In one attempt at optimizing MFC performance described in Pinto et al (2011), external resistance was connected periodically. The tests showed that by periodically connecting and disconnecting Rext, even if Rext is non-optimal, MFC can be operated without significant power losses.
Grondin, et al. (2012) compared the power output obtained by using the P/O method previously described with the periodic operation at values of the external resistance lower than its optimum. MFC can be operated without significant losses. The mismatch of Rext and Rint was resolved operating MFC with periodic resistance connection, where connection and disconnection times were controlled based on voltage measurement. (Grondin et al. 2012). This approach of operating MFC resolves the problem of internal and external resistance mismatch and it also accounts for the variation in electrochemical characteristics due to varying operating conditions. No such periodic operation has been performed for MEC performance optimization. By varying external voltage, the internal and external mismatch in MECs can be also resolved and it gives the opportunity to study the yield and efficiency of MEC under varying operating conditions.
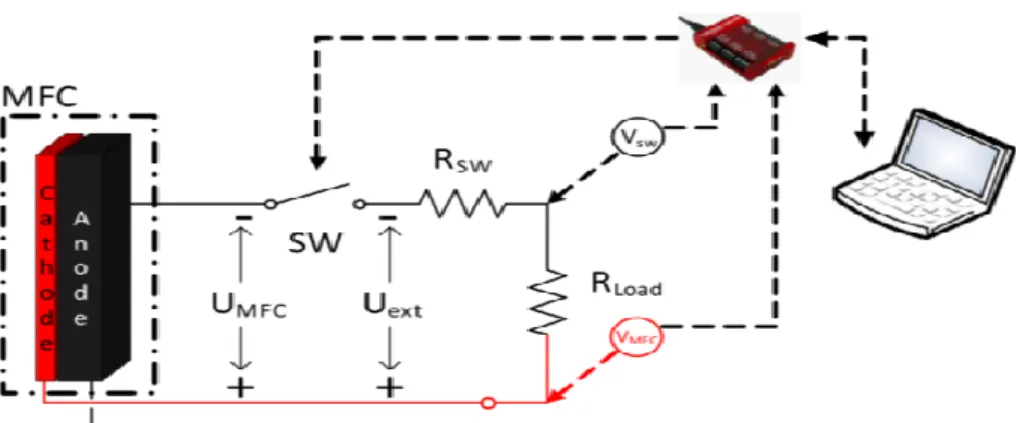
Periodic connection of external resistance can be also achieved by using pulse-width modulated mode of operation. This approach was recently demonstrated by Coronado et al (2013). In this work periodic connection of electrical load at frequencies ranging from 0.1-1000 Hz was studied. Experiments were performed using two membraneless MFCs. Pulse width modulated connection of the external resistance (Rext) was established by the addition of an electronic switch. Figure 1.6 shows the experimental setup.
Figure 1.6: Schematic diagram of experimental setup and electric circuit. Figure adopted from Coronado et al. (2013).
As in the previous study, improved stability and higher power output was observed during pulse-width modulated mode of operation, even at lower than optimal external resistance values.
2.1.8 MEC performance on synthetic and real wastewaters
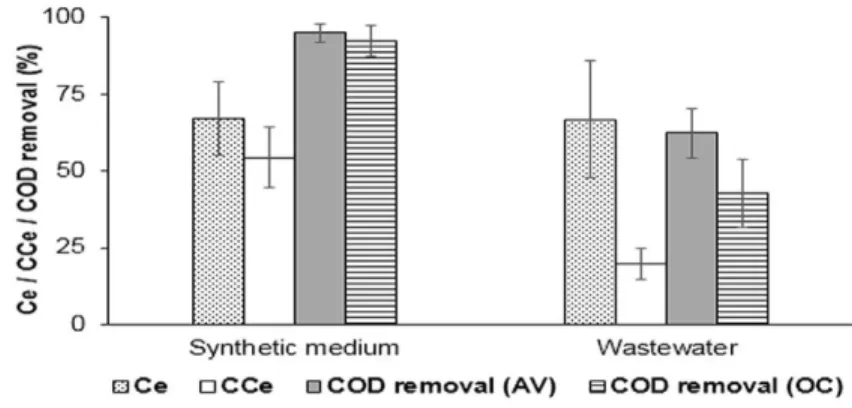
As mentioned earlier, MECs are mostly considered for hydrogen production. However, methane can also be considered as a reliable fuel produced from wastewater in a MEC. Experiments were conducted by Moreno et al. (2016) using synthetic medium and the real wastewater (WW) as the influents to MEC. It was observed that methane production was sharply decreased while using wastewater as the influent substrate because of low acetate concentration. The use of WW as the substrate also resulted in low cathodic conversion efficiency (CCe), it means that significant number of electrons at the cathode were not converted to methane. This loss is explained by the reduction of oxidized compounds such as nitrates and sulphates at the cathode, although these compounds are present in very small concentration in the WW, but their impact on CCe in MEC cannot be neglected. Figure 1.7 represents the comparisons between the CCe, COD removal and columbic efficiency in MEC with synthetic medium (SM) and wastewater (WW) as the influent feed.
Figure 1.7: Columbic (Ce) and cathodic (CCe) efficiencies, and COD removal for SM and WW influent streams. Figure taken from Moreno et al. 2016
It was observed that MEC performed better while using synthetic media as compared to WW. The COD removal and CCe is much better while using SM. The methane production in MEC can also be improved by increasing the HRT. The experimental results show that MEC with WW as the influent generates more methane at higher HRT, where anode respiring bacteria have advantage over acetoclastic methanogens. Energy recovery is also favoured by higher HRT, which makes the process more cost effective. (Moreno et al. 2016).
2.1.9 Performance of Membraneless MEC
In order to improve the performance of MEC and to reduce ohmic losses, a study was carried out by constructing MEC without membrane and by eliminating metal catalyst on anode (Hyung et al. 2010). It was found that a single chamber membraneless MEC (operated at 1 V applied voltage) featured low ohmic resistance (losses). Also, single chamber MEC favours neutral pH due to ion exchange between the compartments. In turn, losses due to electrode overpotentials are also reduced. Energy-conversion efficiency (ECE) was calculated by following mathematical expressions. app app V H c V app V H c H V in V out E CCE E I H F CCE I E I H V E E ECE 0.815 1000 / 1000 / 2 2 2 . , , , = = = = (1.8)
where Eout,v is the output electrical energy from H2-production per volume of MEC, Ein,v
represents the electrical energy supplied per volume of MEC (KJ/m3s), V
H2 is H2-production rate
per volume of MEC, Δc,H2 is the heat of combustion of H2 per electron equivalence (142.915
kJ/e_ eq of H2), a is the energy-conversion parameter from heat energy of H2 to electricity (0.55 in a hydrogen fuel cell) (Larminie et al. 2003), Iv is volumetric current density (A/m3), 1000 is a
units conversion factor (1000 J/kJ), CCE is cathodic conversion efficiency from coulombs to H2 gas, and F is the Faraday constant (96,485 C/e_ eq).
In general, energy conversion efficiency of a MEC can be increased by lowering the anode and cathode activation losses and by decreasing the voltage applied to the MEC (Hyung at al. 2010). The maximum value of ECE was found at 0.6V of applied voltage. Study carried out by Tartakovsky et al. estimated ECE to be 81% with CE and CCE were very close to 100% with the voltage applied of 1V. In order to achieve more ECE > 100%, CCE must be greater than 80% and applied voltage less than 0.6V and by reducing the anode and cathode energy losses (Hyung et al. 2010).
2.2 Dynamic Modeling
Design of MEC systems presents a challenge since MEC dynamics is poorly understood. Hence, dynamic modeling is a useful tool in order to better understand the system. The models of MECs
have been developed by using bioelectrochemical reactions and the knowledge of physics, biology and electrochemistry to represent microbial and bioelectrochemical behavior of the system. This approach is helpful in understanding the slow dynamics of microbial transformations, but it lacks information on relationship between the electrochemical and electrical variables. Below, a critical review of existing MEC and MFC models is presented.
2.2.1 Biofilm Modeling
Microbial biofilms can be modeled using different approaches, sometimes resulting in rather complex models. A simplified dynamic one-dimensional multispecies model was presented by Wanner and Reichert (1996) where the biofilm growth and composition were combined into three main processes: (i) substrate conversion, (ii) volume expansion of biomass and (iii) substrate diffusion. The evolution of the biofilm thickness and dynamics, and spatial distribution of multiple microbial species and substrates can be predicted by the model derived from the mass conservation principle. This simplified approach to biofilm modeling was adopted in many biofilm studies, including modeling of bioelectrochemically active (anodophilic) biofilms.
Several anodophilic biofim models can be found in literature. One of the first models was proposed by Marcus et al. (2007). This model describes the anodic biofilm as a conductive solid matrix, which accepts electrons from a carbon source and transfers them to the anode. A diffusive non-conducting layer is considered between conductive matrix and the bulk anodic liquid. The model considers a hypothetical biofilm with electrical conduction property instead of exogenous mediators to explain the behaviour of biofilms in MFCs. This model does not take into account the reaction rate kinetics, diffusion limitations, overpotentials and the existence of several microbial populations competing for the same substrate. Later, Hamelers et al. (2011) described the kinetics of electricigenic bacteria by using Butler-Volmer- Monod expressions that produced better results when fitting the experimental polarization curves.
A one dimensional (1D) model is useful for analyzing the effects of current density and overpotential on biofilm thickness. Like in other biofilm-based biological reactors (such as anaerobic sludge blanket reactor, expanded granular sludge bed reactor, anaerobic biofilter, and anaerobic fluidized bed reactor), in an MFC bacteria are attached to the anode forming a biofilm (Saravanan, et al. 2006). This section discusses generalized one dimensional models developed in
Cartesian coordinates. A typical biofilm is composed of four compartments (Wanner, et al. 2006) namely: (i) the substratum where the biofilm grows, (ii) the biofilm itself, (iii) the bulk liquid around the biofilm, and (iv) mass transfer boundary layer between biofilm and bulk compartments that considers the resistance to mass transport. Each compartment contains components (such as biomass, substrate, etc.) that undergo various transformations.
Picioreanu, Head et al. (2007) described a multidimensional model of a MFC. This computational model includes parameters such as current produced, charge, power, voltage and consumption of substrates with suspended and attached biomass growth in the anode compartment under varying operating conditions. Electrochemical reactions occurring in the anode compartment are described using a redox mediator. Also, biochemical reactions corresponding to methanogenic and electricigenic species, formation of biofilm, mass transport and reactions occurring in biofilm and bulk liquid are considered. The modeling of biofilm was achieved by particle based approach developed by Picioreanu et al. (2004) was used to depict the dynamic mass balances in the bulk liquid for a CSTR which were used to determine substrate and suspended biomass concentration. In this biofilm model, microbial growth and biomass transport were represented by hard spherical particles and were combined with the diffusion reaction mass balances for chemical species. The model of Picioreanu et al. (2007) requires large computational times of around 14 hours for a single 3D simulation. Later, the model was modified (Picioreanu, Katuri et al. (2008)) to describe degradation of wastewater. This modified model was based on International Water Association (IWA) anaerobic digestion model number 1 (ADM1) (Batstone et al. 2002). Picioreanu, et al. (2010) further extended the model and incorporated pH calculations and different electrode geometry. pH calculations were simulated by using Nernst-Planck fluxes of ions with ionic charge balance instead of molecular diffusion. The variations in electrode geometry were described by modeling mass transport by convection as the mediator that freely diffused in the biofilm and the bulk liquid. This study involved single-species electroactive biofilm on a planar and porous electrode and multi-species electroactive and fermentive biofilm on a planar electrode used to treat wastewater. However, the simulations obtained were not compared to any real data. The estimation from experimental data was impossible because of large amount of model parameters.
2.2.2 Multi-population models
A different approach for modeling of MFCs considers several microbial species, either in suspension or, more often, in a biofilm. Pinto et al. (2010) presented a two-population MFC model describing the competition of electricigenic and methanogenic microbial population for same substrate. It is important to consider multiple populations and the existence of biofilm if MFC is to be used for wastewater treatment applications. This model considers that methanogenic bacteria are competing with electricigenic bacteria for the same substrate. It is assumed that the methanogenic bacteria are present in the biofilm as well as suspended in the bulk liquid of the anodic compartment. The charge transfer mechanism assumes the presence of an intercellular mediator (e.g. NADP). Extracellular electron transfer is described by considering the electricigenic bacteria being attached to the anode surface. Also, growth-washout model (Tartakovsky, et al. 2008) is used to describe biofilm formation and retention. Model analysis was carried out by Fisher information matrix, which shows that only seven parameters of the model could be estimated by minimizing the weighted and normalized difference between the simulated and experimental values.
The model of Pinto et al (2010) established a link between external resistance, organic load and the coexistence of microbial populations. The model was further extended to simulate a microbial electrolysis cell for the production of hydrogen (Pinto et al. 2011). In this case the number of microbial populations was extended to include fermentative, electricigenic, methanogenic, acetoclastic, and methanogenic hydrogenophilic species.
In recent years significant progress has been made in MEC development. These improvements were mainly focused on enhancing hydrogen production by using better cathode materials, better electrode compartment design and optimizing operating conditions. Yet, the overall performance remains relatively low (Logan et al 2008). Modeling can significantly contribute to the process development effort. Pinto (2011) developed a model that solves the modeling complexity offered by MEC by presenting a simple dynamic model that simulate hydrogen production from wastewater. The model describes the influence of organic load and applied voltage on COD removal. The model was validated in an experimental setup with three membraneless MECs with 50 mL anodic and hydrogen collection compartments. Neutral pH was maintained and the
temperature was set to 30°C. The formation of anaerobic film was supported by three dimensional carbon felt anode. Electrochemical part of the MEC model considered ohmic, activation and concentration losses. The following equation described the electrochemical balance.
- Eapplied = ECEF - ηohm – ηconc – ηact (1.9) where ECEF represents the counter electromotive force for MEC, ηohm is the ohmic losses, ηconc is
the concentration overpotential and ηact is the activation overpotential.
Nernst equation is used to calculate the concentration losses at the anode, while the concentration losses at the cathode can be neglected due to small size of H2 molecules resulting in a large diffusion coefficient of H2 in a gas diffusion cathode. The concentration losses are given by the following equation, where Mred and Mox are the reduced and oxidized forms of anodophilic
intercellular mediator respectively. Mtotal is the sum of Mred and Mox.
= red total conc M M mF RT ln (1.10)
The activation losses were calculated by Butler-Volmer equation approximation. The following equation describes the activation losses at cathode
= − 0 , 1 2A i I Sinh mF BT A sur mec act
(1.11)where ί0 represents the exchange current density in reference conditions, Asur,A is the anode
surface area and β is either the reduction or the oxidation transfer coefficient. F is the Faraday’s constant.
H2 production was found to be maximum at an applied voltage of 1.2 V. Pinto and Srinivasan (2011) also demonstrated the effect of influent COD concentration and suggested that the high rate of H2 production is possible with increasing the organic load. Less acetate is
produced at low concentration and consequently the shortage of electricigenic microorganisms results in decrease in the current and therefore less hydrogen flow.
The multipopulation model provides guidance with respect to MEC design and operation. The model is applicable for real-time processes control because of its simplicity. The model does not
provide information about the adjustment of electrical parameters that could be used to maximize the desired gas production while achieving a high degree of COD removal.
2.2.3 Electrical Equivalent Circuit Model
This section analyzes the electrical equivalent circuit models of MFCs that can be applied to MECs. In addition, the effect of change in external resistance with intermittent connection/disconnection of external resistance on the performance in MFCs is described to provide a basis for MEC modeling. Electrical circuit modeling is the strategy, which can be used in order to replace the highly complex multipopulation models of an MFC.
In electrochemical systems, the electrical charge is stored in the layer, which is at the interface between the electrode and the electrolyte. When current is manipulated, a sudden change in operating voltage occurs due to the internal resistance, which is followed by a gradual and slow transition to the final voltage equilibrium stage. This process is termed as double layer capacitance effect (Larminie, et al. 2003). An electrical equivalent circuit can model double layer capacitance if, the charged layer is represented by a capacitor. The electrical equivalent circuit modeling can be found in the literature of electrochemical systems such as lithium-ion batteries (Gao, et al. 2002), polymer electrolyte fuel cells (Wagner 2002) or lead acid batteries (Dür, et al. 2006). Even though this approach of modeling can be used in MFCs and MECs, however very few publications have been found on MFC modeling and none related to MEC modeling.
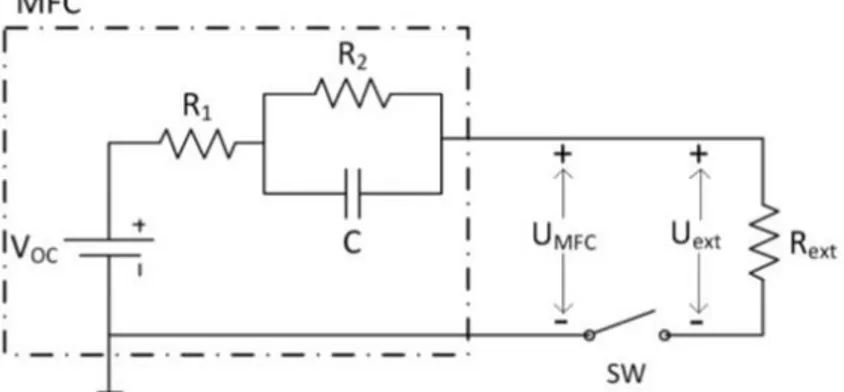
Proton exchange membrane fuel cell (PEM-FC) was characterized by using electrochemical impedance spectroscopy by Wagner (2002). The electrical equivalent circuit model includes ohmic (R) and capacitive (C) elements. The connection of the circuit elements in series represents the simultaneous occurring processes, while the connection in parallel depicts the subsequent processes. The following figure represents a simple equivalent electrical circuit of an MFC.
Figure 1.8: Electrical equivalent circuit of an MFC. Figure adopted from Coronado et al. (2013).
2.2.4 Long term dynamics of bioelectrochemical models
The relationship between the biochemical variables and the electrical properties are used to describe the long-term dynamics of bioelectrochemical models (Picioreanu et al. 2007). Generally, two mechanisms are accepted to describe the transport of electrons from biodegradable substance to the electrode (Schroder 2007): (i) The transfer of electrons through direct contact or by the presence of conducting nanowires, which helps in the conduction of electrons, and (ii) The transfer of electrons through a mediator; via exogenous redox mediators or via secondary metabolites.
This section describes the bioelectrochemical models of MFCs and MECs found in the literature. Unified (MxC) Model
Modeling of biofilm formation is simplified by the division of biofilms into several distinct layers and the assumption of uniform distribution of microorganisms within each layer (Rauch et al. 1999). This approach was applied to develop a unified model capable of modeling both an MFC and MEC (hence an MxC model). In this model, the biofilm at the surface of anode is assumed to consist of anodophilic and acetoclastic methanogenic microorganisms. Here, anodophilic microorganisms are capable of utilizing the anode as terminal electron acceptor, while the acetoclastic microorganisms are capable of producing methane (Pinto et al. 2011). The transfer of charge from a carbon source towards anode is assumed to take place by intercellular mediator,
which is present in the reduced and oxidized forms (Pinto et al. 2010). The second biofilm layer consists of fermentative microorganisms, which transform large organic moleculaes into acetate. Also, it was also assumed that a biofilm layer is present at the cathode. This biofilm consists of hydrogenotrophic methanogens, which convert the hydrogen produced at the cathode into methane.
The carbon source (acetate) was assumed to be well distributed in the anodic chamber. The formation of the acetate gradient inside the biofilm is neglected. A constant pool of intercellular electron transfer mediator Finally, temperature and pressure are kept constant (Pinto et al. 2011). Main microbially catalyzed transformations are assumed as follows:
Andodophilic microorganisms:
C2H4O2 + 2H2O + 4Mox → 4Mred + 2CO2 (1.12)
4Mred → 4Mox + 8e- + 8H+ (1.13)
where Mred and Mox are the reduced and oxidized forms of anodophilic intercellular mediator respectively.
Acetoclastic methanogenic microorganisms:
C2H4O2 → CH4 + CO2 (1.14)
Hydrogenotrophic methanogenic microorganisms:
CO2 + 4H2 → CH4 + 2H2O (1.15)
To collect data for model parameter estimation MEC was fed with acetate at three concentration levels: 1000, 1500 and 900 mg-A L-1, while for model validation MEC was fed with acetate at either 1500 or 1900 mg-A L-1, where A represents acetate concentration. In both conditions the temperature was kept constant at 30 °C and the voltage supplied was set to 1 V.
The model developed by Pinto et al; 2011 provided a simulation tool that can be used for design, optimization and control purposes.
Combined bioelectrochemical - electrical model of MFC
This section presents critical describes another modeling approach in which bio electrochemical MFC model was combined with an electrical equivalent circuit model to create a combined