The determinants of Illiquidity on emerging stock markets: a comparative
analysis between the Johannesburg Stock Exchange (JSE) and the Nigerian
Stock Exchange (NSE)
Prince Dubois KENFACK HIKOUATCHA 1; Hans Patrick MENIK BIDIAS1; David KAMDEM2;
Joseph NZONGANG1
1 University of Dschang; 2 University of Douala (Cameroon), corresponding author: hikouatcha@gmail.com/duprin@yahoo.fr
Abstract
The purpose of this study is to carry out to a comparative study of the determinants of illiquidity, between JSE and NSE, using the Generalized Least Square (GLS) method and the Generalized Method of Moment (GMM), on a stock panel. The obtained results show that stock return is the only illiquidity common factor in the studied markets. In addition, the trading value on the JSE and stock capitalization on the NSE, are the specific determinants of illiquidity. For the global market situation, the number of trading days and number of trades are factors, which permit the reduction of liquidity shortage.
keywords: determinants, illiquidity, JSE, NSE, emerging stock market.
Les déterminants du manqué de liquidité sur les marches boursiers émergents : une analyse comparative entre la Johannesburg Stock Exchange (JSE) et la Nigerian Stock
Exchange (NSE)
Résumé
L’objectif de cet article est de faire une analyse comparative des déterminants de l’illiquidité, entre la JSE et la NSE, à partir de la méthode des Moindres Carrés Généralisés et la Méthode des Moments Généralisés, sur un panel d’actions. Les résultats montrent que le rendement du titre est le seul déterminant commun de l’illiquidité des places financières étudiées. Par ailleurs, la valeur de transaction sur la JSE et la capitalisation boursière sur la NSE, sont les déterminants spécifiques de l’illiquidité. Avec le marché global, le nombre de jours d’opérations et le nombre de transactions, sont les variables qui permettent de réduire le manque de liquidité.
1- Introduction
Financial markets play a major role in the economic development and growth of enterprises. They are at the heart of economic efficiency promotion (Sadjahim, 2003). They are also relevant because, from an institutional point of view, when talking about solutions for economic development, financial markets contribution to capital mobilization, in the form of aid, long-term capital or large infrastructures financing. The contribution of financial markets to economic growth can be perceived at four levels. First, it allows long run financing of the economy; second, it is a mechanism for exchange of investment capacities; third, stock exchanges are considerable tools for industrial reorganization (Hikouatcha, 2017); and fourth, investors and companies also find an efficient way to invest.
According to N'dri and Aderomou (2011), the birth of financial markets encounters the financing needs of economies, especially of companies. In addition, the financial market represents the most advantageous way to get access to the capital. This advantage can also been manifested in terms of capital diversification, improvement of the company reputation, reduction of informational asymmetry, or facilitation of capital movement and fusion operations (Avom et al., 2017). The emergence of financial markets in Africa is due to the quest of these advantages.
African financial markets have experienced spectacular growth since the early 90s (Nkontchou et al, 2010). Before1989, Africa had only eight stock exchanges (Ordera, 2012), this number increased to nineteen in 2007 (Yartey and Adjasi, 2007), to twenty-six in 2008 (Afego, 2011) and today we can identify about twenty-nine stock markets.
The total capitalization of African stock exchange markets was about 20% of the continent's GDP in 2005. Two years later, this figure rose to more than 60% and from 2007 to 2009, the capitalization has been multiplied by nine. Moreover, more than 10 billion dollars was raised on African stock exchanges during the same period, mainly through 170new listed companies1. Between 2002 and 2008, market capitalization of the 10 largest markets increased by more than 18% (from 222 to 700 billion dollars). These financial markets, therefore, experienced phenomenal growth, such as Ghana, which recorded a growth rate of 1559 % during the same period (Atiopou, 2007).
This recent proliferation of stock exchange markets is far from being a fad, because the economic stakes, that underlie it, are real and relevant (Bayala, 2002). Like most emerging markets, those in Africa are of particular importance, such that no investor worthy of this name can offer himself the luxury of ignoring them (Hicham, 2008). According to Templeton (2012), emerging stock markets, like those of Africa, could increase in size in the next decades. Their total value could exceed that of the United States, Japan and Europe. This growth of African financial markets depends on several variables, including liquidity, which plays a major role. In fact, liquidity represents, besides profitability and risk, the most important variable for an investor on a stock market (Hikouatcha et al., 2016).
Despite the significant growth of African financial markets and their hopeful promises, they remain the least liquid in the world. In fact, the value of the liquidity ratio on African financial markets does not exceed 10% (except JSE, where the liquidity ratio is around 40%)2.This value is similar to that of the Thai market (1%) but remains well below the 47% of the Russian financial market (Lesmond,
1
More than 2000 companies are currently registered on African financial markets and the registrations are increasing. This shows the size of local savings and the interest of domestic investors for these stock exchange markets
2
During the 2000 decade for example, the liquidity of the stock market of Johannesburg varied between 37 and 44 % with an average of around 40 %. Over the same period, this ratio was 29 % on average for Egypt, 17 % for Morocco, 12 % for Tunisia, 10 % for Nigeria, 7 % for Kenya and 5 % for the Mauritius Islands. All other stock markets of the continent had an average liquidity ratio lower than or equal to 3.5 %. Among these markets, at least five, including the BRVM had a ratio lower than 1%.
2005). Moreover, when liquidity is measured by turnover ratio, a value of 0.02% is found on the Swaziland market, and that value is by far lower than the 27% of the Mexican financial market (Yartey and Adjasi, 2007). According to these authors, African financial markets suffer from a serious liquidity problem. The lack of liquidity has indeed significant consequences for real economic activity, financial stability (Brandao-Marques, 2016) and price formation. A liquid market improves capital mobilization and long-run economic growth expectations (Abdul-Khaliq, 2013).
Liquidity is essential on stock markets, so long as its lack, in addition to being a major obstacle for market development, becomes a kind of friction that can decrease the market activity and have undesirable effects on stock value (Mihhejev, 2012). In fact, illiquidity causes huge losses on markets, due to stock prices volatility (Kumar and Misra, 2015), which is very relevant on African financial markets. It is also well known that, an illiquid stock market can lead to an increase in cost of capital, a decline in productive investment and economic activity. The liquidity of a financial market is therefore an important issue for both firms and for the economy as a whole. It is therefore necessary to look for the factors that explain the lack of liquidity on African stock markets while their growth is in full progress. The literature on the determinants of illiquidity of financial markets in Africa is not well documented. This study aims at providing an insight to this lack of liquidity, in order to examine the channels of its reduction.
The rest of this article is structured as follows: section two provides a literature review on the stock market liquidity concept and its determinants; section three exposes the empirical methodology of the study; section four presents the results and the conclusion made in section five permits to do the recommendations.
2- Literature review
In the financial literature, liquidity has been the subject to numerous studies, which can be classified in three main groups: those based on asset pricing, studies relating to liquidity common factors and those that analyse the determinants of liquidity measured by various variables.
Following criticisms advanced against the standard assets pricing model and Ross’ (1976) work, Amihud and Mendelson (1986) are the first to highlight the role of liquidity and the related risk, on asset pricing. Their findings show that, liquidity is a decreasing function of expected returns on one hand, and that its function is concave, on the other hand. In part of the findings of Soosung and Lu (2005) and Acharya and Pedersen (2005), the conclusion found by others authors are the same on the American markets (Datar and al., 1998; Amihud et al. 2002, 2005; Chordia et al. 2001), on Australian market (Chan and Faff, 2005), and on a panel of developed countries belonging to the G7 (Chiang and Zheng, 2015). Concerning emerging stocks markets, the results have a two-sided tendency. On one side, we have some studies that confirm the negative relationship between these two variables (Bekeart and al., 2007; Hikouatcha et al., 2016; Salehi et al., 2011; Akram, 2014). On the other side, Hearn and Piesse (2009), Hearn (2010) found no relationship in the South Saharan part of Africa. In conclusion, in spite of the exceptions on some markets, it appears that whatever the context (emerging or developed), liquidity is globally an important asset pricing factor.
However, the literature on the financial market’s microstructure is no longer dedicated only to the analysis of the effect of phenomena on individual stocks. It has now progressed to what is generally known as commonality on liquidity, which refers to the co-variation between stock liquidity and market liquidity (Kumer and Misra, 2015). Chordia and al. (2000) are among the first to study these factors. They studied 1169 stocks of NYSE and concluded that at least 30% of the stock liquidity variation in terms of bid-ask spread are attributable to market liquidity. Several other authors found the existence of liquidity common factor’s, on developed stock markets (Coughenour and Saad's,
2004; Archarya and Pedersen, 2005; Martinez and al., 2003; Caroline-Fournier, 2004; Mirailles et al., 2011), and on emerging stock markets (Zheng and Zhang., 2006; Brockman and al., 2002; Puktuanthong-Le and Visaltanachoti., 2009; Tissaoui et al., 2015; ). Differing to that finding, Fabre and Frino (2004) and Hasbrouck and Seppi (2001), found that this relationship is not significant on the Australian Stock Exchange and for 30 stocks of the Dow Jones Industrial Average. From the preceding studies, it is possible to conclude that the existence of a liquidity common factor, as found on most financial markets, is the result of the market structure. However, for a better understanding, it is important to know its determinants.
Drawn from existing literature on the determinants of liquidity, one can distinguish between specifics factors (specific to the company) and global factors, and between studies on American markets and others.
2.1- Specific determinants of liquidity
According to Tayeh (2016), very few studies have focused on the identification of the causes of liquidity variations over time. Demsetz (1968) was the first to analyze the determinants of liquidity or liquidity cost, measured by the Bid-Ask Spread. He founds that, liquidity is positively related to the trading rate and the number of markets where the securities were listed. Tinic (1972), also showed that there is a positive relationship between liquidity, trading volume and the number of trading days. In the same manner, Cannon and Cole (2011) also found that for stock of the Real Estate Investment (REIT) listed on NYSE and AMEX between 1988 and 2007, liquidity is positively related to stock price, market capitalization and the trading volume. According to Mihhejev (2012), several authors in the same decade obtained the same results onthe American market. However, Branch and Freed (1977)showed that on NYSE and AMEX, in addition to these variables, there is a negative relationship between liquidity and the inverse of stock price. Cannon and Cole (2011) also found that liquidity is negatively related to return volatility. These results on the US market are consistent with those of Chordia and al. (2001), who showed that liquidity on NYSE is affected by market returns and price volatility. On the other hand, they moderate those of Ness et al. (2005), which showed that, on NASDAQ, volatility is not related to liquidity, although it is established in the microstructure’s literature that, volatility is negatively related to stock’s liquidity.
Away from the American market, Tayeh (2016) focuses on the effect on liquidity of certain number of market variables, from 2000 to 2014. The obtained results show that, contrary to the conclusions of Chordia and al. (2001) and Ness and al. (2005), illiquidity (measured by the spread) increases when market conditions are good. In the same way, on the Baltic Stock Market, Kazlauskaite and Makauskas (2006) used panel data analysis to test the effect of various liquidity factors and found that contrary to the literature, size is positively related to spread at the level of 10%. Alzahrani (2011), analyzed the determinants of three (03) liquidity indicators (“the quoted Bid-Ask Spread”,” the relative Bid-Ask Spread” and “the effective Bid-Ask Spread”) on the Saudi Financial Market and found that with the stock size and trading number, the relationship is significantly negative. On the Riga Stock Exchange and Tallim Stock Exchange, Kokoskins and Baumanis (2001) had already found that there is a significant and positive relationship between the Bid-Ask Spread and its determinants, which are the inverse of stock price, volatility and trading volume. The positive relation showed by these authors simply means that there is a negative association between those variables and liquidity.
Contrarily, Madyan et al. (2013) made a distinction between "Sharia" Stocks and the "non-Sharia" ones. The results, unlike those of the former authors, have led to the conclusion that when liquidity is measured by the spread, it is negatively influenced by the trading volume.That is the relationship between those variables are positive. They also show that irrespective ofthe stocks category, when liquidity is measured by deepness, the relationship with trading volume, size and price is significantly positive. Kazlauskaite and Makauskas (2006) also found that the trading volume and profitability
increases liquidity. For Alzahrani (2011), whatever the variable used, liquidity positively and significantly affects (at the significant level of 1%) the trading volume and volatility. Following the same conclusion, using a panel data analysis on 138 companies of this market between 2006 and 2010, Mihhejev (2012) highlighted that, there is a positive relationship between trading volume and the liquidity variables used. From these results, he showed that there is a significant relationship with the specifics variables. On the other hand, Brandao-Marques (2016)found that volatility and market capitalization do not have a significant effect on liquidity in the Chilean market. Unlike Mihhejev (2012), among whom size does not significantly contribute to the explanation of the liquidity in the Baltic Stock Market.
Finally, one can note that empirical results on liquidity’s determinants depends on the type of market and on the studied variable, because with the same variable, the relation could be either positive, or negative or non-existent.
2.2- Global liquidity’s determinants
Among the global determinants of liquidity, we distinguish between macroeconomic determinants that concern economic policy in general, and governance variables.
2.2.1- Macroeconomic factors
According to Chabchitrchaidol and Panyanukul (2005), macroeconomic variables (including the size of the economy), are significant determinants of liquidity. More precisely, Chordia and al., (2001) showed that in addition to microeconomic variables such as market returns and volatility, some macroeconomic variables might be relevant determinants of liquidity. Among them, these authors show that the Gross Domestic Product, unemployment rate and interest rate can have a significant effect on market liquidity. Furthermore, Ding and al., (2013) found that on the Shangai Stock Exchange and Shenzhen Stock Exchange, a participation of the foreign institutions most likely increases the market liquidity. In the same way Goyenko and Ukhov (2009) and Fujimoto (2003), found that inflation and monetary policy had a significant effect on the liquidity of the NYSE and the AMEX. However, Chordia and al., (2005) found a weak explanatory power of monetary policy on market liquidity, thus contradicting the results on the American market. In addition, Brandao-Marques (2016) found that on the Chilean market, political risk and inflation does not have a significant effect on liquidity, although there is a negative and significant relationship with Gross Domestic Product.
2.2.2- The role of governance in the explanation of liquidity variation
This group of determinants concerns investor protection and company governance. Generally, good governance is likely to improve market and stocks liquidity, but some governance factors, on some markets, may rather have a negative or non-existent effect.
Concerning the positive relation between governance and liquidity, Brockman and Chen and al. (2003) found that on the Hong Kong market, the investor’s protective environment increases stocks liquidity. According to them, this result is robust in the presence of the institutional factors. In addition, Naes (2004), in the same way, showed, from a panel data analysis, that in the Norway Stock Exchange, shareholding concentration is negatively linked to the "spread" and to information cost; that is the link with liquidity is positive. It is also shown that the presence of institutional investors can explain the variation of market liquidity or stocks liquidity. This is the case of Yaghoobnezhad et al. (2011) on Tehran stock exchange where they found that the presence of such investors might increase the liquidity of the stocks concerned.
Inversely, Jackson (2013), in his study of 71 Caribbean companies, highlighted the relationship, which exists between the ownership structure, corporate governance and financial-market liquidity. He
found that companies with concentrated ownership structures are associated with a low liquidity level. Brandao-Marques (2016), using a panel data on 23 emerging economies, found that there is a positive and significant relationship between market liquidity (measured by the Amihud illiquidity ratio) and the protection of marginal investors. Jacoby and Zhang (2010) empirically showed that on the NYSE and AMEX, there is a positive relationship between the diversity of the Board of Directors, the “block holder ownership" and illiquidity. That negative relationship with liquidity is true for all size of firm’s stocks. In the same way, Alves et al. (2015) conclude that turnover (an indicator of liquidity) is negatively related to the ownership structure, suggesting that a high concentration of shareholders leads to a low trading volume of 38 companies on the Portuguese market and 102 companies on the Spanish market in 2007. They also found that this relationship is positive with the Bid-Ask Spread and concluded that an ownership concentration leads to an inefficient asset pricing on the market. This result is consistent with the findings of Blumeand Keim (2012), which showed that the participation of such investors explains the cross-sectional variation of illiquidity on American stock market.
Diverging from the conclusions of most studies on stock market microstructure, Sharma (2005), who studied the link between the ownership structure and the liquidity of stocks listed on the Indian stock market, found that the share of capital held by the promoters is not a significant factor in the explanation of liquidity. Similarly, Jackson (2013) denounces the governance problems in the Caribbean, which makes foreign family companies to be more liquid than para-public companies. This author found that there is no significant relationship between governance and liquidity. On the other hand, Naes (2004) found that there is no significant relationship between liquidity and institutional shareholding.
In conclusion, in addition to the importance of liquidity shown in its role on asset pricing and its impact in terms of common factors, the determinants of this significant variable of the financial market, have an effect, which can vary from one variable to another or from one market to another. In addition, the literature presented shows a vacuum about liquidity determinants on the African financial markets. Furthermore, the effects of some important variables like the trading value, trading frequency have been ignored. It is what justifies the need of this research.
3- Methodological framework
In Africa today, there are about 29 financial markets, which represent 38 countries, given the two regional markets (BRVM and BVMAC)3. JSE and NSE are the top two, in terms of capitalization and trading volume. According to the investment bank "African Alliance" their capitalization was approximately 413.1 billion dollars at the end of the year 2016, thus being more than three quarters of the global capitalization of African markets. Taking it into account and the fact that they are the two first African financial markets in terms of trading number, trading volume and trading frequency, this study focuses on these two financial places. The data used are obtained from the database of these two markets. That is, it is mainly constituted of information about the trading activity of the stocks listed on these financial markets between 2000 and 2014 (monthly data).
3.1- Econometric model
The econometric model used to study the determinants of illiquidity on the JSE and NSE is as follows:
, 0 1 , 2 , 3 , 4 , 5 , 6 , ,
i t i t i t i t i t i t i t i t
ILLIQ
= +
α
β
R
+
β
TVo
+
β
NT
+
β
NTD
+
β
TVa
+
β
SC
+
ε
3
So-called « Bourse Régionale des Valeurs Mobilières » and « Bourse des Valeurs Mobilières de l’Afrique Centrale » respectively.
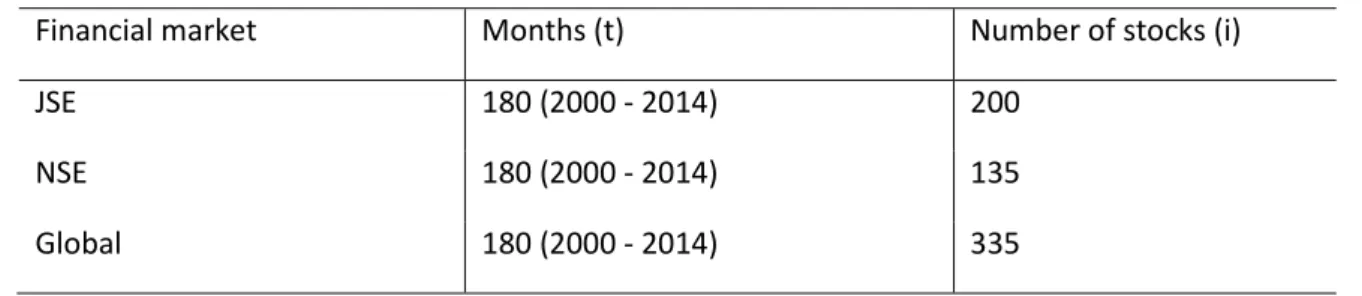
The codes assigned to the variables in this model will be presented below. This is a static non-balanced panel data model whose characteristics, according to each studied stock market, are as presented in the table 1 below:
Table 1 Characteristics of the various panels of the study
Financial market Months (t) Number of stocks (i)
JSE 180 (2000 - 2014) 200
NSE 180 (2000 - 2014) 135
Global 180 (2000 - 2014) 335
After having eliminated the stocks which have a considerable lack of information during the estimation period, we used for the estimation, 200 stocks of JSE and 180 NSE, and 335 stocks for the whole market (combination of stock listed on JSE and NSE), from 2000 to 2014 (15 years).
Thus, « t » in the above model is an indicator of time (month) which goes from 1 to 180 for each panel’s individual; « i » is the index of the panel’s individual dimension (stocks) and is equal to 135 on the NSE, 200 for the JSE and 335 for the global situation. When the panel is not static, the lagged value of the dependent variable is simply used an explanatory variable in the model above.
3.2- Variables of the study and estimation
It is necessary to differentiate the dependent variable (an illiquidity indicator) from independent variables.
3.2.1- The indicator of illiquidity: the Amihud’s (2002) variable (ILLIQ)
There is an ongoing debate in financial literature about the adequate measurement indicator of liquidity in the financial market. The most common indicator used is the Bid-Ask Spread, which measures illiquidity through the associated cost. However, the structure of African stock markets does not facilitate its calculation. In the African context, given the low liquidity level, it is easier and better to evaluate the liquidity as a shortage. It is one of the conclusions of Hikouatcha et al. (2016), who show that on the BRVM, the turnover, which measures the level of liquidity, is less performing than Amihud’s illiquidity variable used. Apart from this variable, several other indicators of illiquidity have been developed in the literature. We can list the inverse of profitability developed by Pastor and Stambough (2003), and illiquidity ratio of Amihud (2002).Among these illiquidity indicators, that of Amihud(2002) is the most used today. It has indeed gained in importance in the literature. It is easy to calculate, and one of its advantage is the resolution of the problems of liquidity evaluation in emerging markets4. According to Trzcinzka et al. (2009), this indicator is far better than the majority of variables identified in the literature and it is adapted to many changes. The preceding justifies the use of Amihud’s (2002) illiquidity ratio as a dependent variable in this study.
3.2.2- Dependent variables
The traditional determinants are used as explanatory variables of this study for several reasons: First, they have not yet been studied in the African context; second, the technique of estimation used and
4
This simplicity in calculation is due to the fact that it requires only data on transactions which are available for the majority of the emerging financial markets.
the studied period does not allow the inclusion of macroeconomic and governance variables. Thus the explanatory variables retained for this study are:
The number of traded stocks or Trading Volume (TV): a high volume of transaction shows the facility with which the stock is exchangeable. There is thus a high probability that this variable evolves in the opposite direction of illiquidity for the stocks listed on the studied markets
The stock returns (R): The literature shows that there is a negative relationship between the standard deviation of returns and liquidity (Mihhejev, 2012). It is also established that, the relationship which exists between returns and its standard deviation (risk) is rather decreasing. Thus, returns should normally be negatively related to stock illiquidity.
The trading value (TV): A large value of transactions does not necessarily means that there is a trading facility, since it can be related to a small number of stocks. It is thus difficult to predict the relationship, which may exists with liquidity in the African context, because even the literature is silent on this issue.
The company’s size or stock capitalization (SC): According to Madyan et al. (2013), the larger the company, the more liquid it is. This is because large companies stocks are more frequently and easily exchanged compared to those of small size companies. The size of the company indeed facilitates the availability of information related to that company, thus consequently reduces information asymmetry and increases liquidity (the more known the company is, the less there will be costs of adverse selection and the more liquid it will be (Alzahrani, 2011)). This is why we predict in the context of this study that there is a negative relationship between illiquidity and market capitalization, which measures the size of the company
The number of trading days on the studied period (NTD): This is an indicator of trading frequency, which takes into account the regularity of transactions on the market. Generally, the more frequent the transactions on a stock, the more this stock will be considered as liquid. This implies a decreasing relationship between this variable and illiquidity.
The number of transactions (NT): The more a stock is traded over a given period, the more it is supposed to be liquid. Thus, this determinant is supposed to positively affect liquidity and negatively affect the illiquidity.
These variables are generated monthly for each stock of the sample. The monthly average is used instead of the end-of-period information regularly used in literature (for the developed countries). This is because African markets are famous for their high volatility (Thus information at the end of the month is not more representative than average information of the period). The pooling of these variables permits to obtain a panel data model, which is estimated after taking into account various preliminary precautions.
Concerning the preliminary tests, the variables used were stationary (test of Im-Pesaran-Shin). Furthermore, the test of homogeneity of Fisher shows that the stocks are not behaving homogenously, which means that all the stocks have specifics behaviors. The Breusch-Pagantest of heteroscedasticity and autocorrelation test of Wooldridge permits to conclude that all the panels are autocorrelated and heteroscedastic. For this reason, the Hausman specification test is not necessary because the econometric model used will be estimated through the Generalized Least Squares (GLS) method. In order to take into account an eventual problem of endogeneity, we also carried out the estimation trough the Generalized Method of Moments (GMM). This last method suppose that the panel is dynamic and not static. The dynamic panel has the advantage of controlling endogeneity, heterogeneity and multi colinearity.
4- The Determinants of illiquidity on the JSE and NSE: Results obtained
With an aim to highlight the determinants of the illiquidity on the studied African stock markets, a correlation analysis is carried out before the estimation of the econometric model.
4.1- Analysis of the correlation between illiquidity and its traditional determinants
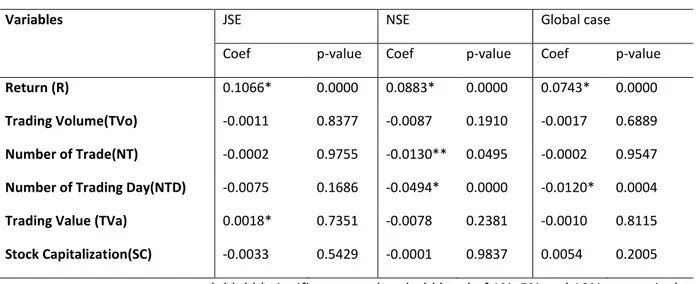
In order to have an idea about the short-term effect on illiquidity of its determinants, we perform a Pearson’s correlation test. The related results are presented in the table 2 below:
Table 2: Correlation between illiquidity and its determinants
Pearson’s correlation Test
Variables JSE NSE Global case
Coef p-value Coef p-value Coef p-value
Return (R) 0.1066* 0.0000 0.0883* 0.0000 0.0743* 0.0000
Trading Volume(TVo) -0.0011 0.8377 -0.0087 0.1910 -0.0017 0.6889
Number of Trade(NT) -0.0002 0.9755 -0.0130** 0.0495 -0.0002 0.9547
Number of Trading Day(NTD) -0.0075 0.1686 -0.0494* 0.0000 -0.0120* 0.0004
Trading Value (TVa) 0.0018* 0.7351 -0.0078 0.2381 -0.0010 0.8115
Stock Capitalization(SC) -0.0033 0.5429 -0.0001 0.9837 0.0054 0.2005 *,**,*** significant at a threshold level of 1%, 5% and 10% respectively Whatever the market considered (individual or global case),there is a positive and significant correlation between illiquidity and stocks returns. Consequently, returns appear to be the only common positive and significant determinant of illiquidity on those stock markets. Furthermore, the correlation between illiquidity and Trading Volume is significantly negative for both the NSE and for the global situation. In addition, the lack of liquidity is negatively correlated to the Number of Trade, only for NSE at a significant level of 5%. All other variables, on all the financial places have a non-significant correlation effect with illiquidity. These results show that, considering short-term analysis, the expected rate of return (for all markets), the Number of Trades (for NSE) and the Number of Trading days (for the NSE and globally), are variables that can affect illiquidity on studied African stock markets. These conclusions can be confirmed through a long-term analysis, especially through the results of an econometric regression.
4.2- The determinants of the lack of liquidity on JSE
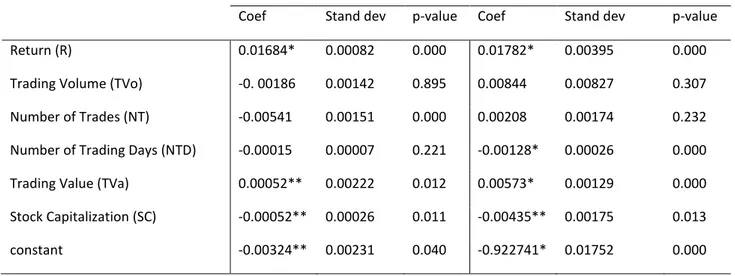
Table 3 below presents the results of the determinants of illiquidity on JSE for both the Generalized Lease Square (GLS) method and the System- Generalized Method of Moments (Sys-GMM).
Table 3: determinants of illiquidity on JSE
*,**,*** significant at a threshold of 1%, 5% and 10% respectively Concerning the GLS results, in line with the correlation analysis, it arises from the above table 3 that, two variables significantly increase the illiquidity on the South-African financial market. These variables are stock return and trading value, which have positive effects on illiquidity. This implies that, a unit increase in returns leads to an increase of illiquidity for approximately 1.68%. This relationship is consistent with the literature on asset pricing, which supports that there is a decreasing relationship between returns and liquidity (and consequently a positive relationship with illiquidity), following Amihud and al. (1986). This result, although in line with the theory on liquidity premium, diverges from those of Hikouatcha et al. (2016), which show that on African markets in particular, and emerging markets generally, the risk associated to the liquidity is not priced. This result is however in opposition with our expectations and the literature on the liquidity determinants (in the sense of Mihhejev (2012), which shows that there is a negative relationship between the returns’ standard deviation and liquidity), thus contradicting the conclusions of Cannon and Cole (2011). Furthermore, a unit increase of trading value significantly leads to a reduction of liquidity by approximately 0.05%. Thus, when the trading value increases, the liquidity of the associated stocks decreases.
Besides these two variables which significantly increase illiquidity on this stock market, and considering the results of the same table 3, one can notices that the trading volume and the stock size rather leads to a reduction of illiquidity. In fact, a point increase in each of these variables causes a reduction of illiquidity of approximately 0.541% and 0.05% respectively. These results are in line with the correlation coefficient presumptions and the expected signs. These findings are thus in conformity with the literature among Madyan et al., (2013), who found that the larger a company, the more liquid it is. In addition, Alzahrani (2011) also found that the spread (Bid – Ask Spread) is negatively related to the trading volume on the Saudi financial market.
Apart from those variables, the trading frequency (measured by the number of trading days) and the trading volume (measured by the number transaction), could also cause a reduction of illiquidity. However, their effect on JSE is not significant. The significant value of the constant confirms the fact that at a 5%level of significance, the variables used are not enough to considerably explain the lack of liquidity on the studied market.
As well as GLS analysis, when the estimation is carried out through the system-GMM, the dissimilarities between the results are not very considerable. More specifically, except the Number of Trading Days and the Number of trades, all the other variables behave in the same way like the GLS;
Variables Generalized Least Squares Generalized Method of Moments
Coef Stand dev p-value Coef Stand dev p-value
Return (R) 0.01684* 0.00082 0.000 0.01782* 0.00395 0.000
Trading Volume (TVo) -0. 00186 0.00142 0.895 0.00844 0.00827 0.307
Number of Trades (NT) -0.00541 0.00151 0.000 0.00208 0.00174 0.232
Number of Trading Days (NTD) -0.00015 0.00007 0.221 -0.00128* 0.00026 0.000
Trading Value (TVa) 0.00052** 0.00222 0.012 0.00573* 0.00129 0.000
Stock Capitalization (SC) -0.00052** 0.00026 0.011 -0.00435** 0.00175 0.013
the value of the coefficients became more important and their significance increased. The results with GLS show a negative and non-significant effect of the trade frequency on illiquidity, but with GMM, a unit increase on the value of that variables will significantly (at a level of 1%) lead to a decrease of 0.128% on the value of illiquidity. Inversely, with the GMM, the estimation results with the Number of Trades are not as significant as they were with the GLS analysis. More specifically, the sign of the coefficient is now positive and not negative. This means that, if the coefficient’s p-value was less than 10%, an increase of about 1% on the number of trades may lead to an increase of liquidity shortage of about 0.20%.
Summarily, on JSE, one can distinguish between the factors, which increase the lack of liquidity (the trading value and the stock returns), the factors, which reduce it (the trading volume, the stock capitalization and the number of trading days) and variables, which, while being able to impact the level of liquidity, do not have a significant effect. It only remains to check if the NSE behaves identically.
4.3- Explanatory factors of illiquidity on NSE
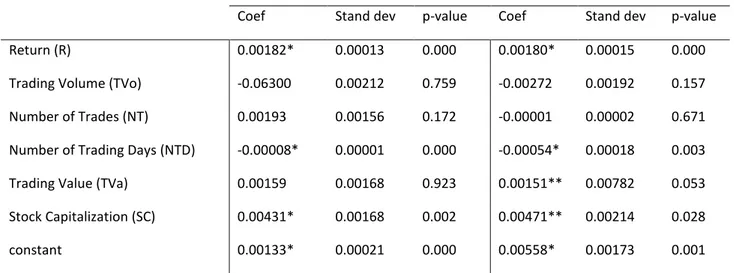
The results of the estimations obtained from the NSE data are presented in table 4:
Table 4: explanatory variables of illiquidity on NSE
*,**,*** significant at a threshold of 1%, 5% and 10% respectively From the above table, one can conclude that when estimation is carried out through the GLS method, the NSE stocks behave identically to the JSE at three points: firstly, the constant is significant; indicating that in addition to these variables, several other determinants of illiquidity could exist. This is, for example the company governance and macroeconomic variables. Secondly, just like on the JSE, there is a positive and significant relationship between illiquidity and the stock return. In fact, a unit increase of the value of expected return leads to a0.18% increase in the illiquidity value. The theory of Amihud and Mendelson (1986) is thus respected both on the NSE and on the JSE, since the most profitable shares are the least liquid. However, this result is contrary to studies on the determinants of liquidity like that of Branch and Freed (1977). Thirdly, the JSE and the NSE have the same results concerning the effect of the trading volume on illiquidity. More precisely, on these two financial markets, the latter is regarded as a variable that can reduce the lack of liquidity, but its effect is not significant. This conclusion is consistent with that of Cannon and Cole (2011), who found that the trading volume is a factor that is positively and significantly related to liquidity on the American market. In the same manner, Kazlauskaite and Makauskas (2006) found that the value of liquidity increases with the trading volume on the Baltic stock market.
Variables Generalized Lease Square Generalized Method of Moments
Coef Stand dev p-value Coef Stand dev p-value
Return (R) 0.00182* 0.00013 0.000 0.00180* 0.00015 0.000
Trading Volume (TVo) -0.06300 0.00212 0.759 -0.00272 0.00192 0.157
Number of Trades (NT) 0.00193 0.00156 0.172 -0.00001 0.00002 0.671
Number of Trading Days (NTD) -0.00008* 0.00001 0.000 -0.00054* 0.00018 0.003
Trading Value (TVa) 0.00159 0.00168 0.923 0.00151** 0.00782 0.053
Stock Capitalization (SC) 0.00431* 0.00168 0.002 0.00471** 0.00214 0.028
Apart from these similarities, table 4 also reveals some specifics characteristics of the NSE as compare to the JSE. The first is related to the positive and significant effect of market capitalization on illiquidity. In fact, a unit increase on the value of market capitalization leads to about 0.431% increase of illiquidity value. We thus deduce that it is the smallest companies that benefit from a greater liquidity, and this is contrary to our expectations and the assortment of most studies on this research area, which show that size is positively related to liquidity and thus negatively related to its lack. On the other hand, these results are consistent with those of Kazlauskaite and Makauskas (2006) whose findings reveal that this variable is positively related to the spread on the Baltic stock market, and with those of Brandao-Marques (2016), who found that the effect of market capitalization on illiquidity is insignificant. The second difference is related to the effect of the Number of Trading Days, which became significant as compared to the case of JSE. In fact, the direction of the relationship is identical on the two financial markets, but it is significant only on the NSE. We thus conclude that the trading frequency measured by the number of trading days during the month reduces illiquidity significantly, just as the conclusion of Tinic (1972). Thirdly, compared to the JSE, the Number of Transactions and the trading value become insignificant determinants of the illiquidity on the NSE. This result is inconsistent with those of Madyan et al. (2013) who found that, the trading volume is negatively related to illiquidity, as it is on the JSE.
In addition, just like on the JSE, the conclusions do not considerably change when the estimation technique changes. In fact, the value of the coefficient has not significantly changed because, except the case of the Number of Trades, all the signs remain the same. Concerning the consistency of the variables, it is found (from table 4) that, with the GMM, the trading value for now, has a positive and significant effect on illiquidity. Therefore, a unit increase on the trade value leads to a significant increase of 0.15% on the value of illiquidity. This result indicates that on NSE, when there are transactions of an important value, the effects on liquidity is negative, because it may significantly leads to its reduction. The same conclusion has been made for JSE, meaning that concerning this variable, those two stock exchanges behave in the same way.
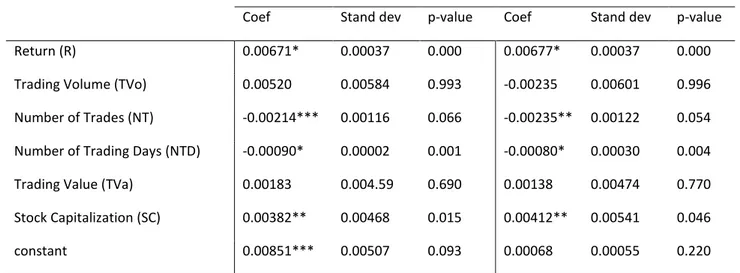
4.4- Illiquidity’s determinants on both JSE and NSE (global case)
Just as it was the case with the JSE and the NSE, when the stocks of these two markets are taken into account simultaneously, the following table 5 puts in light the obtained results:
Table 5: determinants of illiquidity on the global market (JSE and NSE)
*,**,*** significant at a threshold of 1%, 5% and 10% respectively
Variables Generalized Lease Square Generalized Method of Moments
Coef Stand dev p-value Coef Stand dev p-value
Return (R) 0.00671* 0.00037 0.000 0.00677* 0.00037 0.000
Trading Volume (TVo) 0.00520 0.00584 0.993 -0.00235 0.00601 0.996
Number of Trades (NT) -0.00214*** 0.00116 0.066 -0.00235** 0.00122 0.054 Number of Trading Days (NTD) -0.00090* 0.00002 0.001 -0.00080* 0.00030 0.004
Trading Value (TVa) 0.00183 0.004.59 0.690 0.00138 0.00474 0.770
Stock Capitalization (SC) 0.00382** 0.00468 0.015 0.00412** 0.00541 0.046
Globally, it can be seen that the results of the global situation is better than those of individuals markets. Whatever the method used (GLS or GMM), the expected return still has a positive and significant (at 1% threshold) effect on illiquidity. For a unit increase on the value of return, there is a reduction of stock liquidity by more than 0.67%. It means that, return is a factor, which does not facilitate the liquidity of the market or the stock liquidity. Those results are in line with the conclusions of Amihud and Mendelson (1986), Hikouatcha and al., (2016) and Cannon and Cole (2011).Furthermore, the same relationship has been established with company size, captured by stock capitalization. More specifically, a unit increase on stock capitalization leads to an increase in the illiquidity’s value for at least 0.4%. That is, for an investor who holds both the shares of NSE and JSE in a portfolio and considering both estimation methods, the more the concerned stock size is high on those markets, the less liquid they will be. These results are not consistent with that of Madyan et al. (2013), according to whom, the larger the company the more liquid it is. However, they are consistent with the conclusions of Cannon and Cole (2011), whose results show that the relation between stock capitalization and its return is positive.
Contrarily to these two variables, the number of trades and the number of trading days appear to have a significantly negative relationship with the lack of liquidity. Simply, there is an increase of liquidity for at least 0.2% and 0.08% because of an increase of the number of trades and the number of trading days respectively. That is, when the stock markets are taken into consideration simultaneously, an increase in trade frequency and the number of days where there is at least one operation (transaction) on a concerned stock is source of an increase in the associate stock liquidity. These results are not in contradiction with the findings of Tinic (1972), who found a positive relationship between trading frequency and liquidity. They are also in line with the conclusions of Cannon and Cole (2011), who used trading volume as the liquidity determinant. For all others factors, the relationship with illiquidity are not significant, meaning that there are not important determinants of the lack of liquidity on the stock markets taken simultaneously.
Finally, when considering the whole market (constituted by the stocks listed on the two financial markets), the findings are not substantially different from the one of individual stock markets, because generally, the same variables have a significant effect on illiquidity. This implies that the change of estimation method and the change of the studied stockmarket, have no considerable effects on the nature of the relationship between liquidity and its determinants.
5- Conclusion
Liquidity is one of the most important variables of financial markets and African stock markets are recognized as the least liquid in the world, despite their recent important and significant growth. The purpose of this study was to perform a comparative analysis of the illiquidity’s determinants between JSE, NSE and the global situation where both markets are considered as a unique. To this end, we applied panel data analysis on monthly data from year 2000 to year 2014. Concerning the number of stocks used (individual panel size), we had135 securities listed on the Nigerian Stock Exchange, 200 listed securities on the South African market and 335 for the global market situation; the estimation technique used was the Generalized Least Squares method and the Generalized Method of Moments. The latter permitted us to take into account the eventual problems of endogeneity, heterogeneity or multi colinearity. The results show that on these two stock markets individually and globally, the return is the common and significant factor that increases illiquidity. In addition, the trading value (on JSE and sometime on NSE) and stock capitalization (on NSE and for global case) are also significant determinants of the illiquidity on the stock markets, because they also increase its value. On the other hand, the number of trading days per month (for all financial markets),the market capitalization (on the JSE) and the number of transactions (on the JSE and for global situation) are rather factors, which reduce illiquidity. These results lead to the conclusion that, in terms of illiquidity determinants, the two markets have differences and similarities, since except for the expected returns, all other variables do not react in the same way. The direct implication of
these findings is that, to improve liquidity on the JSE, it is judicious to discourage the transactions of very high value, while increasing the number of transactions, the number of trading days and promoting the operations of large companies. In the same manner, to have a similar effect on the NSE, it will rather be necessary to increase trading frequency, discourage transactions of important value and to reconsider the size of the listed companies, which are operating on the stock market. From an international point of view (an investors who holds the stocks of both financial markets in the same portfolio), the policies must be directed towards the discouragement of important variation on stock prices (returns) and transactions of firms with high value of capitalization. Furthermore, as a strategy to raise the value of liquidity, policies globally should encourage the multiplication of the number of transactions and the number of trading days, that is globally, the trading frequency most be improved.
Finally, what may be considered as important on African stock markets is not the value of transactions, but its number. That is, on African financial markets, particular attention must be granted to the strategy to increase trading frequency instead of trading value. Consequently, further research may pay attention to the factors, which can raise trade frequency. In addition, another interesting area of research could be the determinants of liquidity on other African financial markets, or using other estimation techniques or other liquidity factors.
References
Abdul-Khaliq S., (2013), The Impact of Stock Market Liquidity on Economic Growth in Jordan, European Journal of Business and Management, Vol.5, No.30
Acharya, v., and Pedersen, L. (2005). Asset Pricing With Liquidity Risk. Journal of Financial Economics, pp. 375-410.
Afego P., “Market Efficiency in Developing African Stock Markets: A Survey And Review Of Literature”, Social Sciences Research Network 1909732, 2011.
Akram, N. (2014), "The Effect of Liquidity on Stock Returns: An Evidence From Pakistan." Journal of Business and Management (IOSR-JBM), e-ISSN: 2278-487X, p-ISSN: 2319-7668. Volume 16, Issue 2, pp. 66-69.
Alzahrani, A. (2011). Liquidity Cost Determinants in the Saudi Market. Journal of Trade, Economics and Finance, 2(3), pp. 185-193
Amihud, Y. (2002), "Illiquidity and stock returns: Cross-section and time series effects." Journal of Financial Markets 5, pp. 31-56.
Amihud, Y., Mendelson, H., et Pedersen, L. (2005), "Liquidity and asset prices." Foundation and Trends in Finance 1, , pp. 269-364.
Amihud,H and Mendelson. (1986) , Asset Pricing and the Bid-Ask Spread. Journal of Financial Economics, pp. 223-249.
Atiopou, A. M. (2007), "Marchés financiers africains 2002-2006" .working paper, [online] http://www.afrology.com (accessed 14 February 2013),
Avom D., Feudjo J., R., ; Hikouatcha K., P., D., Tchapda W., M., G., (2017), Pourquoi les entreprises résistent-elles à se financer à la Douala Stock Exchange (DSX) ?, WP, Université de Dschang
Bayala B., « La Bourse Régionale des Valeurs Mobilières en Afrique de l’Ouest, L’introduction en bourse : pourquoi et pourquoi pas ? » Les sociétés et les Investisseurs, Thèse de Doctorat, Center For DevelopmentStudies-University of Groningen-Netherlands, 2002.
Bekaert, G., Campbell, et Christian, L. (2007), "Liquidity And Expected Returns: Lessons From Emerging Markets." Review Of Financial Studies 20 , pp. 1783-1831.
Branch, B., and Freed, W. (1977). Bid-asked spreads on the AMEX and the big-board. The Journal of Finance, 32(1), pp. 159-163.
Brandao-Marques L. (2016), Stock Market Liquidity in Chile, International Monetary Fund’s Working Paper
Brockman, P., and Chung, D. Y. (2003). Investor protection and firm liquidity. The Journal of Finance, 58(2), pp. 921-937
Brockman, P., Chung, D. Y. and Pérignon C. (2002), “Commonality in Liquidity: Evidence from an Order Driven Market Structure”, Journal of Financial Research, 25, pp. 521-539
Cannon, S. E., and Cole, R. A. (2011). Changes in REIT liquidity 1988-2007: evidence from daily data. Journal of Real Estate Finance and Economics, 43, pp.258-280.
Chabchitrchaidol A. and Panyanukul S. (2005), Key Determinants of Liquidity in the Thai Bond Market, document de recherché, Bank of Thailand and the Bank for International Settlements
Chen, W. P., Chung, H., Lee, C., and Liao, W. L. (2007). Corporate governance and equity liquidity: analysis of S&P transparency and disclosure rankings. Corporate Governance: An International Review, 15(4), pp. 644-660.
Chiang, T., etZheng, D. (2015), "Liquidity And Stock Returns: Evidence From International Markets." Global Finance Journal 27, pp. 73-97.
Chordia, T., Roll, R. and Subrahmanyam, A. (2000). Commonality in liquidity. Journal of Financial Economics, 56, pp. 3–28
Chordia, T., Roll, R. and Subrahmanyam, A. (2001). Common determinants of Liquidity and Trading. The Research Foundation of AIMR (CFA Institute).
Chordia, T., Roll, R., and Subrahmanyam, A. (2001). Market Liquidity and Trading Activity. Journal of Finance, 56, pp. 501-530.
Chordia, T., Sarkar, A. and Subrahmanyam, A. (2005). The Joint Dynamics of Liquidity, Returns, and Volatility across Small and Large Firms. Federal Reserve Bank of New York Staff Reports, 207. Coughenour, J.F. and Saad, M. M. (2004). Common market makers and commonality in liquidity. Journal of Financial Economics, 73, pp. 37–69
Datar, V., Naik, Y., et Radcliffe. (1998), "Liquidity And Stock Return: An Alternative Test." Journal Of Financial Markets, 1.
Demsetz, H. (1968). The cost of transacting. The Quarterly Journal of Economics, 82(1), pp. 33-53. Fabre, J. and Frino, A. (2004). Commonality in liquidity: evidence from the Australian stock exchange. Accounting and Finance, 44, 357-368.
Fournier-Ermonet C. (2004), l’identification des facteurs commun de liquidité sur le marché parisien des actions, Cahier de Recherche N° 1, Centre de Recherche sur la Gestion (CEREG).
Fujimoto, A. (2003). Macroeconomic Sources of Systematic Liquidity. Working Paper, Yale University, pp. 1-50.
Goyenko, R.Y. and Ukhov, A.D. (2009). Stock and Bond Market Liquidity: A Long-Run Empirical Analysis. Journal of Financial and Quantitative Analysis, 44(1), pp. 189–212.
Hasbrouck J. and Seppi D. (2001), “common factor in prices, order flows and liquidity”, Journal of Financial Economics N° 59, pp. 383-411
Hearn, B., et Piesse, J. (2009), "Pricing Southern Shares In The Presence Of Illiquidity: A Capital Asset Pricing Model Augmented By Size And Liquidity Premiums." Social Science Reseach Network (King's College London),
Hearn, B. (2010), "Liquidity And Valuation In East African Securities Markets." Social Science Resarch Network (King's College London),
Helena Alves, Natalia Canadas and Ana Maria Rdrigues (2015), Determinants of Share Price and Share Liquidity: an Analysis Using a SEM Model, Procedia Economics and Finance 25, pp..318 – 331
Hicham, A. (2008), "Les marchés financiers émergents: caractéristiques des performances." CIEF. Hikouatcha K. P. D., Kamdem D., Bidias M. H. P. and Adeyeye P. O. (2016), "The Pricing Of Illiquidity Risk On Emerging Stock Exchange Markets: A Portfolio Panel Data Analysis", Journal of Economics and International Finance, Vol. 8(8), pp. 127-141
Hikouatcha K. Prince D. (2017), "Microstructure et processus de formation des cours sur les marchés boursier émergents : les leçons de l'Afrique Subsaharienne", Ph.Dthesis, University of Dschang. Jacoby, G. and Zheng, S.X. (2010).Ownership dispersion and market liquidity. International Review of Financial Analysis, 19, 81–88.
Kazlauskaite, R., and Makauskas , A. (2006). Illiquidity discount measurement in the Baltic States: public and private companies compared. Stockholm School of Economics in Riga, Riga, Latvia working paper
Kokoškins, J., and Baumanis, M. (2001). Dynamics of liquidity of Riga Stock Exchange before and after the Russian crisis. WP, Stockholm School of Economics in Riga, Riga, Latvia
Kumar G. and Misra A. K. (2015), Closer View at the Stock Market Liquidity: A Literature Review, Asian Journal of Finance & Accounting, Vol. 7, No. 2
Lesmond, A.D. (2005). Liquidity of emerging markets. Journal of Financial Economics, 77, pp. 411-425.
Marcia Karen Jackson (2013), Ownership, Corporate Governance and Liquidity in Caribbean Firms, Master’s thesis, The School of Economics and Finance, Faculty of Business, Queensland University of Technology Brisbane, Australia
Marshall E. Blume and Donald B. Keim (2012), The Changing Nature of Institutional Stock Investing, WP, FTSE World Investment Forum, The Wharton School, University of Pennsylvania
Mihhejev I., Yaroslava O. and Högholm K. (2012), Explaining Equity Liquidity on the Baltic Stock Markets: Role of Traditional and Novel Determinants, Working Paper, Stockholm School of Economics in Riga
Miralles, J. L., Miralles, M., and Olivera, C. (2011). The Role of An Illiquidity Factor in the Portuguese Stock Market. XII Iberian-Italian Congress of Financial and Actuarial Mathematics (Lisbon).
Muhammad Madyan, UbudSalim, MuslichAnshori and Solimun (2013), Liquidity Determinants of Sharia and non-Sharia Stocks, Journal of Business and Management Volume 9, Issue 2, pp. 28-38 N’dri L. K. et Aderomou R. B., « Les introductions en bourse à la BRVM : Théories et Analyse du cas des sociétés non cotées du Bénin », ISSN: 16941225, 2011.
Naes, R. (2004). Ownership Structure and Stock Market Liquidity. Working papers from Norges Bank, ANO 2004/6.
Ness V., B. F., Van. R. A., and Warr, R. S. (2005). NASDAQ Trading and Trading Costs: 1993-2002. The Financial Review, 40, pp. 281-304.
Nkontchou C., « La récente montée en puissance des marchés financiers africains », secteur privé & développement revue proparco, 2010.
Pastor, L., etStambaugh. (2003), "Liquidity Risk And Expected Stock Returns." Journal Of Political Economy, 111 , pp. 642-685.
Pukthuanthong-Le, K. and Visaltanachoti, N. (2009). Commonality in liquidity: Evidence from the Stock Exchange of Thailand. Pacific-Basin Finance Journal, 17, pp. 80–99.
Sharma, L. (2005).Ownership Structure and Stock Liquidity – Evidence from Indian Market. Available at: http://www.nseindia.com/content/press/LS_mar2005.pdf.
Sharpe, W. F. (1964). Capital Asset Prices: A theory of Market Equilibrum under Conditions of Risk. Journal of Finance 19, pp. 425-442.
Soosung, H., et Lu, C. (2005), "Cross-Dectional Stock Returns In The UK Market The role of Liquidity Risk." Working Paper, Cass Business School (City of London),
Tayeh M. (2016), Determinants of Market Liquidity: Evidence from the Jordanian Stock Market, International Journal of Economics and Finance; Vol. 8, No. 10
Tinic, S.M. (1972).The economics of liquidity services. The Quarterly Journal of Economics, 86(1), 79-93.
Tissaoui, K. (2015). Commonality in liquidity: lessons from an emerging stock market, The Journal of Applied Business Research, Vol 31, N° 5
Trzcinka, C.A., Goyenko, R.Y. and Holden, C.W. (2009). Do liquidity measures measure liquidity? Journal of Financial Economics, 92, 153–181.
Ujunwa, A., et Pius, S. O. (2010), "Stock Market Development and Economic Growth: Evidence from Nigeria". European Journal of Economics, Finance and Administrative Sciences. ISSN 1450-2275 Issue 25.
Yaghoobnezhad, A., Roodposhti, F.R. and Zabihi, A.(2011). The Study of Relationship between Institutional Ownership and Stock Liquidity in Tehran Stock Exchange, Journal of Basic Apply Science. Research.
Yartey C. A. etAdjasi C. K., “Stock Market Development In Sub-Saharan Africa: Critical Issues and Challenges”, International Monetary Fund Working Paper WP/O7/209, 2007.
Yartey C. A., and Adjasi C. K., (2007), Stock Market Development in Sub-Saharan Africa: Critical Issues and Challenges, IMF Working Paper N° 07/209
Zheng, X. and Zhang, Z. (2006). Commonality in Liquidity in Emerging Markets: Evidence from the Chinese Stock Market. Durham WorkingPaper in Economics and Finance, No.06/04