PREDICTING NEXT KIDNEY OFFER FOR A KIDNEY TRANSPLANT CANDIDATE DECLINING CURRENT ONE
JEAN-NOËL WELLER
DÉPARTEMENT DE MATHÉMATIQUES ET DE GÉNIE INDUSTRIEL ÉCOLE POLYTECHNIQUE DE MONTRÉAL
MÉMOIRE PRÉSENTÉ EN VUE DE L’OBTENTION DU DIPLÔME DE MAÎTRISE ÈS SCIENCES APPLIQUÉES
(MATHÉMATIQUES APPLIQUÉES) AOÛT 2018
c
ÉCOLE POLYTECHNIQUE DE MONTRÉAL
Ce mémoire intitulé :
PREDICTING NEXT KIDNEY OFFER FOR A KIDNEY TRANSPLANT CANDIDATE DECLINING CURRENT ONE
présenté par : WELLER Jean-Noël
en vue de l’obtention du diplôme de : Maîtrise ès sciences appliquées a été dûment accepté par le jury d’examen constitué de :
M. ROUSSEAU Louis-Martin, Ph. D., président
M. LODI Andrea, Ph. D., membre et directeur de recherche M. JALBERT Jonathan, Ph. D., membre
DEDICATION
« Il n’y a pas de plus grand amour que de donner sa vie pour ses amis. » Jean 15, 13
ACKNOWLEDGEMENTS
I wish to thank my supervisor Andrea Lodi for his confidence throughout the whole project, letting me go off the beaten methodological path. He helped me focus on realistic objectives for the project when I started losing myself into too much mathematical verbosity. He always made time when was necessary. He was always very efficient and drove the project among his impressive amount of responsibilities, with a pinch of humour.
I also thank the Canadian National Transplant Research Program (CNTRP) and the In-stitute for Data Valorization (IVADO) for the financial support of the research presented in this thesis.
I thank all the members of the jury for their careful proof-reading of this thesis, and their useful comments especially towards the improvement of the mathematical parts.
Je souhaite remercier le docteur Héloïse Cardinal du fond du cœur pour son engagement dans le projet, sa compréhension très large du sujet, tant sur le plan de la connaissance des reins, de l’univers de la transplantation et de l’aide à la décision que des interactions avec le milieu mathématique. Rajoutons à cela son aide attentive et dévouée, sa disponibilité, son franc-parler, sa sensibilité et son enthousiasme. Elle a été un co-superviseur officieux mais actif, et ses conseils ont été précieux dans la rédaction du présent mémoire. Sans sa ténacité, ainsi que celle de mon superviseur, l’acquisition des données aurait été proprement impossible.
J’adresse mes remerciements à Louis Beaulieu et Marie-Josée Simard de Transplant Québec d’avoir rendu possible l’accès aux données. Je remercie aussi Sylvain Lavigne de Transplant Québec et Sophie Payment de Cosior pour l’extraction concrète des données. Des données scientifiques telles que celles utilisées pour ce travail n’existaient pas au Québec. Merci à eux de s’être ingéniés à transformer une base de données technique en données exploitables à des fins scientifiques. Merci pour leur patience et leurs réponses à mes incompréhensions sur les données, pour le temps consacré à accéder à mes demandes sur le pointage utilisé et à comparer mes calculs avec ceux de Transplant Québec.
Muito obrigado à Margarida Carvalho pour ses conseils sur la rédaction scientifique. Sa disponibilité angélique l’a menée jusqu’à corriger des documents en vacances... Ses
encoura-gements ont été aussi précieux que sa connaissance de la littérature sur la transplantation rénale en mathématiques. Merci à Didier Chetelat pour ses conseils en statistique et ses re-marques déstabilisantes et pointues sur mes raisonnements mathématiques. Merci à Maxime Gasse pour ses conseils sur la vérification de mes algorithmes ainsi que son approche prag-matique des mesures d’erreur et de coût. Merci à Mathieu Tanneau pour son aide, lui que j’ai fait suer du bureau jusqu’au sauna. Merci à mes voisins de bureau Pierre Hulot, Antoine Prouvost, Aurélien Serre, Flore Sentenac d’avoir à tour de rôle supporté la déblatération de mes doléances, de mes questionnements et de mes pitreries et d’avoir su quand et quand ne pas y répondre.
Merci à l’ensemble des membres de la Chaire de Recherche sur la science des données et la prise de décision en temps réel. À Koladé Nourou, pour son dévouement auprès de chacun des étudiants, son implication dans l’ensemble de la vie de la chaire, sa grande ouverture d’esprit et son combat héroïque pour maintenir les locaux salubres. À Khalid Laaziri pour son support informatique et sa bienveillance envers un amateur en console de commandes tel que moi. Il a montré qu’il était possible d’être un chercheur dans tous les domaines de la vie, de la physique à l’informatique en passant par l’histoire et la théologie. Merci à Mehdi Taobane de m’avoir aidé dans mes démarches administratives et de s’être assuré que je ne me fasse pas expulser du Canada avant la fin de ma maîtrise.
Un grand merci à l’Orchestre Symphonique des Jeunes de Montréal de m’avoir offert un espace pour souffler de tout mon cor, à tous mes collègues musiciens qui m’ont donné de la liberté vis-à-vis de mon travail scientifique, à mon professeur de cor Denys Derome, d’avoir cru qu’un étudiant en sciences pouvait continuer à se perfectionner en musique, et à mon professeur de technique Alexander Lawrence Smith, de m’avoir appris à garder la tête haute mais mobile devant mon instrument comme mon ordinateur. Merci pour leur confiance et leurs encouragements, qui, heureusement, n’ont pas suffi à me faire arrêter ma maîtrise pour me lancer complètement en musique. Merci à l’Espace Benoît Lacroix, à l’Église Unie Saint-Jean, ainsi qu’à l’Echad d’avoir donné une profondeur et une unité à mon travail pour garder à l’esprit l’essentiel de la recherche.
RÉSUMÉ
Un patient atteint d’insuffisance rénale terminale est confronté à un choix difficile lorsqu’un rein d’un donneur décédé lui est offert. Il peut ou bien accepter, ou bien attendre une meilleure offre en restant sous dialyse. La décision associe le patient et son néphrologue, qui doivent, à deux, parvenir au meilleur choix pour le patient dans un processus appelé Prise de Décision Participative (PDP).
D’une part, environ 500 personnes étaient en attente d’une transplantation rénale en 2017 au Québec. Parmi elles, 54 sont décédées sur la liste d’attente la même année. Le temps d’attente moyen des patients transplantés en 2017 était de 493 jours. D’autre part, des reins de moindre qualité qui auraient pu bénéficier à des patients à risque ne sont pas utilisés. Pour certains patients, accepter un rein de qualité inférieure augmente les chances de survie par rapport à attendre en dialyse. De plus, les chances de succès à long terme d’une transplan-tation diminuent avec le temps passé sous dialyse. Cependant, il peut être avantageux pour les patients prioritaires d’attendre une meilleur offre.
Par conséquent, une méthodologie et des outils mathématiques pour développer une PDP éclairée augmenteraient la qualité et le nombre de greffes, la survie et la satisfaction des patients, la confiance des médecins dans leurs recommandations, diminueraient les dépenses de santé et les reins non-utilisés. Toutefois, les outils qui existent à ce jour pour ce faire ne nous paraissent pas adéquats. En effet, ils visent en général à recommander au patient la décision à prendre, en se fondant sur des critères souvent incomplets, au lieu de l’informer.
Notre travail s’inscrit dans un projet de recherche plus général qui a été séparé en deux questions pour lesquelles le patient aimerait des réponses afin de prendre une décision. Notre travail répond à la seconde question en supposant la première résolue comme une boîte-noire.
1. Qu’advient-il si j’accepte l’offre ?
Combien de temps un patient comme moi peut-il espérer survivre avec ce rein ? Ce temps est-il très différent du temps de survie espéré pour un donneur médian ? 2. Qu’advient-il si je refuse l’offre ?
Combien de temps vais-je devoir attendre pour une prochaine offre ? Quelle est la qualité espérée d’une telle offre ?
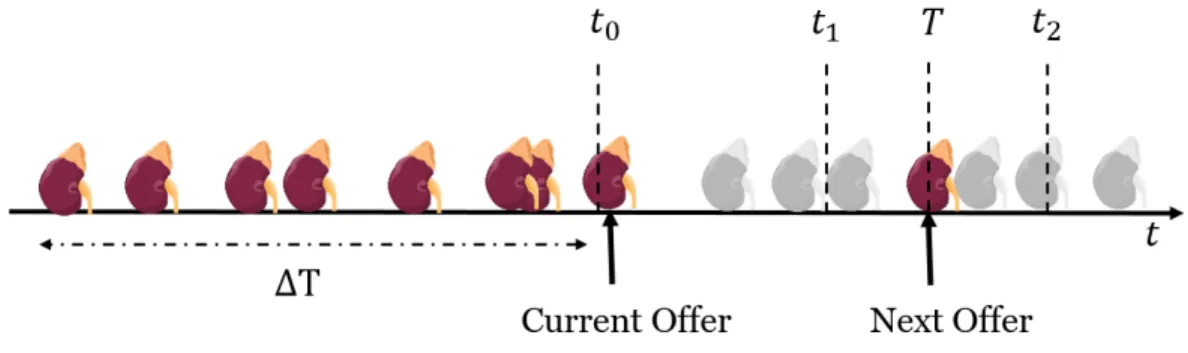
Nous considérons un système d’attribution par pointage de reins de donneurs décédés. Des offres sont faites au patient selon son rang sur la liste d’attente, déterminé par une fonction de pointage à chaque arrivée de donneur. Soit x un patient auquel un rein y0 est offert.
Nous cherchons à prédire le temps T auquel le prochain rein Y sera proposé à x. Sachant q un prédicteur de la qualité d’une greffe (le temps de survie par exemple), nous souhaitons estimer q(x, Y ) ainsi que le temps de prochaine meilleure offre (T |q(x, Y ) > q(x, y0)).
Nous modélisons l’arrivée de donneurs éligibles (c’est-à-dire compatibles et réellement pro-posés au patient) par un processus ponctuel de Poisson non-homogène de paramètre constant par morceaux. En pratique, nous estimons ce paramètre à l’aide des donneurs arrivés au cours des deux années précédant l’offre. Pour chaque donneur, nous évaluons s’il aurait été éligible pour le patient en considérant différentes dates dans le futur (afin de tenir compte de l’évo-lution du temps d’attente et de l’âge dudit patient). En définitive, notre algorithme apprend la distribution complète de l’offre suivante pour ce patient. L’on peut fournir au patient le temps espéré E(T ) de prochaine offre (avec intervalles de confiance obtenus par bootstrapping) et t95%, temps auquel le patient aura obtenu une offre avec probabilité 0.95.
Pour valider notre algorithme, nous utilisons des données fournies par Transplant Québec. Nous démontrons que comparer les quantiles prédits tα aux temps réels de prochaine offre
permet d’estimer les quantiles empiriques sur l’ensemble du jeu de données. Nous démontrons qu’il est possible de comparer la moyenne des temps observés au même mois prédit E(T ), tout en incluant les données censurées. La meilleure version de l’algorithme prédit fidèlement la distribution de T sur l’ensemble de test (712 offres : 569 observées, 143 censurées) : temps observés inférieurs aux t95% dans 94% des cas pour un C-index de 0.74. Nous introduisons
une mesure de détection des erreurs de prédiction et de leur envergure. Enfin, nous utilisons le Kidney-Donor-Risk-Index (mesure de qualité reconnue en pratique) pour estimer la qualité de l’offre espérée comparativement à l’offre actuelle. Nous adaptons l’algorithme pour prédire l’espérance du temps de prochaine meilleure offre E(T |q(x, Y ) > q(x, y0)).
Nous n’avons appliqué l’algorithme qu’à des données québécoises à ce jour, mais il s’étend à toute liste d’attente par pointage. Il est personnalisé, économe en temps de calcul, interpré-table, s’adapte aux évolutions de la distribution de donneurs et permet d’informer le patient de multiples manières. Il inclut actuellement des limitations. Les prédictions sont mauvaises quand les données sont trop peu nombreuses ou pour certains types de patients. Enfin, l’algo-rithme néglige le risque de décès ou de sortie de la liste, d’où l’importance que le néphrologue confronte les résultats avec son expertise et que l’approche continue à être développée.
ABSTRACT
Patients with end-stage kidney disease waiting for a kidney transplant are confronted to difficult decisions when a deceased donor is proposed to them. They can either accept the offer, or wait for a potentially better offer, while remaining under dialysis. The decision involves both patient and physician who should evaluate together the alternative to find the best decision for the patient. This process is called Shared-Decision-Making (SDM).
On the one hand, around 500 persons were waiting for a kidney transplant in 2017 in the province of Québec, and 54 died in the waiting-list the same year. The mean waiting time of transplanted patients in 2017 was 493 days. On the other hand, lower-quality kidneys are wasted which could have benefited to patients at risk. For some patients, getting a lower-quality kidney leads to better survival chances than remaining on dialysis. Moreover, the longer the waiting-time, the worse the expected outcomes of a future transplant. At the same time, some high-priority patients can benefit from waiting for a better kidney offer.
Therefore, developing a methodology and decision-support tools to enhance informed SDM could at once increase quality and number of transplants, survival and satisfaction of patients, physicians’ confidence in their advice, decrease organ wastage and healthcare expenditures for end-stage kidney disease. Yet, the mathematical tools which exist to foster SDM to date are not fully satisfactory. Indeed, they are designed most of the time to give an advice to the patient, based on little evidence, and not to inform him.
Our work is part of a larger research project. It has been split in two questions that the patient would like answered in order to make his decision. Our work addresses the second question and assumes that the first one is solved as a black-box.
1. What happens if I say yes?
How long is the kidney from this specific donor expected to survive in a patient like me?
How different is this survival compared to the one of an average donor? 2. What happens if I say no?
If I decline this offer, how long am I supposed to wait for another offer? What would be the expected quality of this offer?
We consider a general scoring allocation system for deceased donors: offers are made to patients according to their rank on the waiting-list determined by a scoring function at each donor arrival. We consider a patient x getting a kidney offer y0. Our objective is to predict
the time T at which the patient will get a next offer Y . Given a black-box q predicting the quality of a matching (for example time of survival), we want to estimate the quality of next offer q(x, Y ) and the time to next better offer (T |q(x, Y ) > q(x, y0)).
The arrival of eligible donors (i.e. compatible donors who will actually be proposed to our patient) can be modelled as a non-homogeneous Poisson point process with piecewise constant parameter. We learn this parameter in practice using donors arrived up to two years before the current offer. For each donor y, we try to assess if she would have been eligible to our patient at different points in times in the future (accounting for update of patient’s age and waiting-time). In the end, our algorithm predicts the whole distribution of next offer for a specific patient. This enables to provide the patient with the expected time to next offer E(T ) (and bootstrapping derived confidence intervals) and t95%, time by which
he will have had an offer with 95% confidence.
We validated our algorithm on data provided by Transplant Québec. We proved that we could compare the actual predicted quantiles tα to the observed times to next offer and
estimate the empirical quantiles over the whole dataset. We also proved that we could group the predicted expected times to next offer by month and compare them to the averaged observed times while accounting for censored values. The best version of the algorithm predicts faithfully the distribution of T on our test set (712 offers: 569 uncensored, 143 censored): actual observed times lower than predicted t95% for 94% of the observations and
concordance-index 0.74. We introduced a measure to detect bad predictions and study their importance. Finally we used the well-known Kidney-Donor-Risk-Index to estimate the next offer’s expected quality and compare it to the current one. We adapted our algorithm to predict the mean time to next better offer E(T |q(x, Y ) > q(x, y0)).
Though we only applied our algorithm to data from Québec, it is applicable to any scoring waiting-list. It is a highly personalised and interpretable on-line algorithm, it is not time-consuming, captures long-term trends in donors’ arrival and leads to many ways of informing the patient. Of course, it currently has limitations. Bad predictions occurred for different reasons: too little data, special type of patient. Furthermore, we did not include the risk of death or removal from the list. Thus, it is important the physician should be able to confront the results to her expertise and it is also important to continue developing the approach.
TABLE OF CONTENTS DEDICATION . . . iii ACKNOWLEDGEMENTS . . . iv RÉSUMÉ . . . vi ABSTRACT . . . viii TABLE OF CONTENTS . . . x
LIST OF TABLES . . . xiii
LIST OF FIGURES . . . xv
LIST OF SYMBOLS AND ABBREVIATIONS . . . xvii
CHAPTER 1 INTRODUCTION . . . 1
1.1 Renal Replacement Therapy . . . 1
1.1.1 General Considerations about Transplant Outcomes . . . 2
1.1.2 Attribution of deceased donor kidneys in Québec . . . 3
1.1.3 Decision-Making . . . 4
1.2 Setting and Problem Characteristics . . . 5
1.3 Objective . . . 7
1.4 Outline . . . 7
CHAPTER 2 LITERATURE REVIEW . . . 9
2.1 Predicting Survival after Kidney Transplantation . . . 9
2.1.1 Models Based on Cox Regression Analysis . . . 9
2.1.2 Models Based on Machine-Learning . . . 10
2.1.3 Models Based on Artificial Neural Networks . . . 11
2.1.4 Summary . . . 12
2.2 Decision-Aid . . . 13
2.2.1 Optimisation of Kidney Allocation Policies . . . 14
2.2.2 Prediction of Waiting-List Evolution . . . 14
2.2.3 Optimisation of Patients Decisions . . . 14
CHAPTER 3 KIDNEY ATTRIBUTION SYSTEM IN QUÉBEC . . . 17
3.1 Overall System . . . 17
3.1.1 Priority Lists . . . 17
3.1.2 General Scoring List . . . 18
3.2 Mathematics of the Scoring Function . . . 21
3.2.1 Expression of the Scoring Function . . . 21
3.2.2 Behaviour of the Scoring Function . . . 23
CHAPTER 4 MATHEMATICAL MODELLING OF THE PROBLEM . . . 26
4.1 General Modelling of the Attribution Process . . . 26
4.1.1 Notations . . . 26
4.1.2 Random Arrival of Donors . . . 27
4.2 Modelling Next Kidney Offer . . . 29
4.2.1 Notations . . . 29
4.2.2 Random Arrival of Eligible Donors . . . 29
4.2.3 Eligibility Relaxation . . . 37
4.2.4 Quality of Eligible Donors . . . 41
4.3 Algorithmic Perspective . . . 42
4.3.1 General Algorithm . . . 42
4.3.2 Detailed Variants . . . 44
4.3.3 Complexity Analysis . . . 47
4.4 Summary . . . 49
CHAPTER 5 OBSERVATIONAL DATA . . . 50
5.1 Preprocessing . . . 50
5.1.1 Files and Features . . . 50
5.1.2 Formatting . . . 50
5.1.3 Missing Data . . . 53
5.1.4 Cleaning . . . 53
5.2 Main Figures . . . 55
5.2.1 Attribution in the province of Québec . . . 55
5.2.2 Donors in the province of Québec . . . 55
5.2.3 Patients in the province of Québec . . . 58
5.2.4 Evolution of the Waiting-List . . . 61
5.3 First Verifications . . . 65
5.3.1 Kolmogorov-Smirnov Test . . . 67
5.4 Training, Validation and Test Sets . . . 70
5.4.1 Training Set . . . 70
5.4.2 Validation and Test Sets . . . 71
CHAPTER 6 VERIFICATIONS . . . 74
6.1 Verification Methodology . . . 74
6.1.1 Foreword . . . 74
6.1.2 Mean Squared Error and Mean Absolute Percentage Error . . . 76
6.1.3 Mean Normalised Squared Error . . . 77
6.1.4 Concordance Index . . . 79
6.1.5 Wasserstein Distance . . . 80
6.1.6 Empirical Mean Quantiles . . . 81
6.1.7 Local means . . . 82
6.1.8 Summary . . . 88
6.2 Results . . . 90
6.2.1 Hyper-Parameters . . . 90
6.2.2 Fixing some Hyper-Parameters . . . 92
6.2.3 Validation . . . 94
6.2.4 Test . . . 107
6.2.5 Summary . . . 107
CHAPTER 7 CONCLUSION . . . 110
7.1 Summary . . . 110
7.1.1 Two Practical Examples . . . 111
7.2 Limitations . . . 112
7.3 Future Research Directions . . . 113
LIST OF TABLES
Table 3.1 Bloodtype eligibility as defined by Transplant Québec (TQ). . . 18
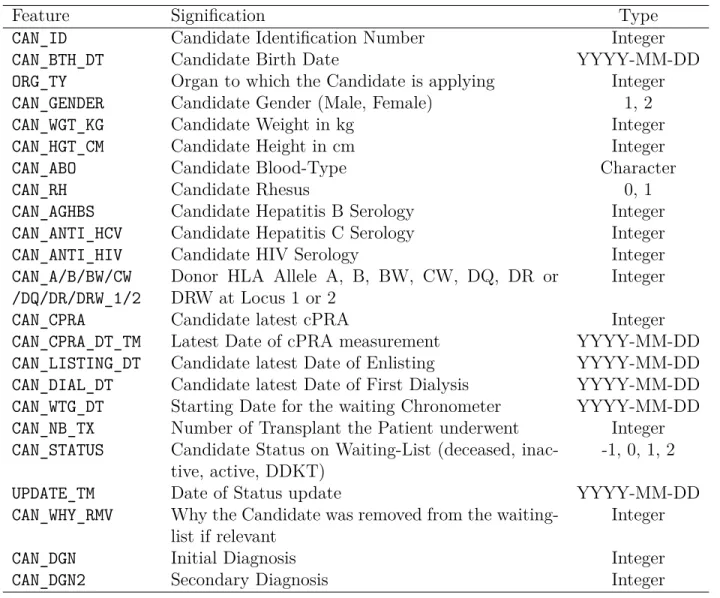
Table 5.1 Features of the donor file. . . 51
Table 5.2 Features of the patient file. . . 52
Table 5.3 Features of the patient cpra file. . . 52
Table 5.4 Distribution of categorical features of recovered donors in Québec be-tween 2012-03-29 and 2017-12-13. . . 57
Table 5.5 Distribution of numerical features of recovered donors in Québec be-tween 2012-03-29 and 2017-12-13. . . 57
Table 5.6 Distribution of categorical features of patients at time of enlisting in Québec between 2012-03-29 and 2017-12-13. . . 60
Table 5.7 Distribution of categorical features of patients competing on scoring waiting-list on 2017-12-13 in Québec. . . 60
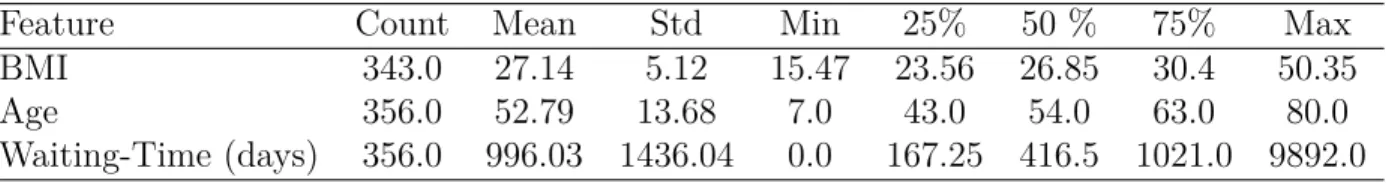
Table 5.8 Distribution of numerical features of patients at time of enlisting in Québec between 2012-03-29 and 2017-12-13. . . 61
Table 5.9 Distribution of numerical features of patients competing on scoring waiting-list on 2017-12-13 in Québec. . . 62
Table 5.10 Distribution of categorical features of patients competing on scoring waiting-list on 2012-03-29 in Québec. . . 62
Table 5.11 Some statistics about numerical features of patients competing on scor-ing waitscor-ing-list on 2012-03-29 in Québec. . . 62
Table 5.12 Kolmogorov-Smirnov adjusted statistic estimate for different time win-dows. . . 69
Table 5.13 Validation and test sets. . . 73
Table 6.1 Validation measures: summary . . . 89
Table 6.2 Different distances between 95% bootstrap confidence bounds for dif-ferent numbers of simulations for the validation set including censored values. . . 93
Table 6.3 Comparison of expected time prediction performances between ∆T = 365 and ∆T = 730. The Past Waiting-List method with calculated Panel Reactive Antibodies (cPRA) was used on the validation set (in-cluding censored data for the C-index). . . 93 Table 6.4 Numerical validation results for several configurations of hyper-parameters. 95
Table 6.5 Values of the empirical mean quantiles with confidence intervals for different sets of hyper-parameters. We removed the censored values from the validation set. . . 101 Table 6.6 Statistics about time to next offer and cPRA in the validation set
excluding censored values for predictions with Normalised Squared Er-ror (NSE) higher than 3. . . 105 Table 6.7 Statistics about time to next offer and cPRA in the validation set
excluding censored values for predictions. . . 106 Table 6.8 Proportion of bad predictions with NSE in the validation set for the
Past Waiting-List (PWL) method with and without cPRA adjustment. 106 Table 6.9 Prediction of one distribution of next offer: average computational
times with standard deviation for different sets of hyper-parameters. . 106 Table 6.10 Numerical validation vs. test results for the PWL with cPRA, ∆T =
LIST OF FIGURES
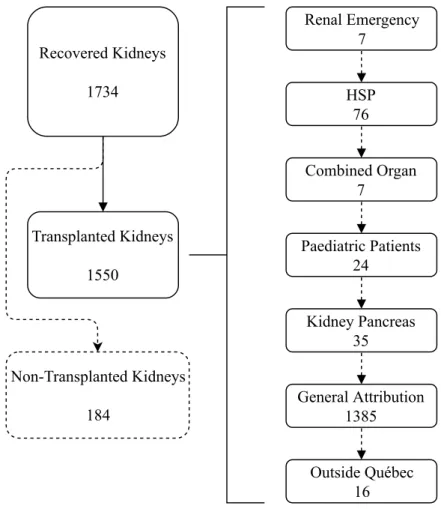
Figure 4.1 Illustration of the algorithm to estimate the distribution of time to next offer. . . 49 Figure 5.1 Numbers of kidneys recovered, transplanted and attributed in the
dif-ferent priority lists in Québec between 2012-03-29 and 2017-12-13. . . 56 Figure 5.2 Distribution of the maximal ranks of offer for recovered donors in
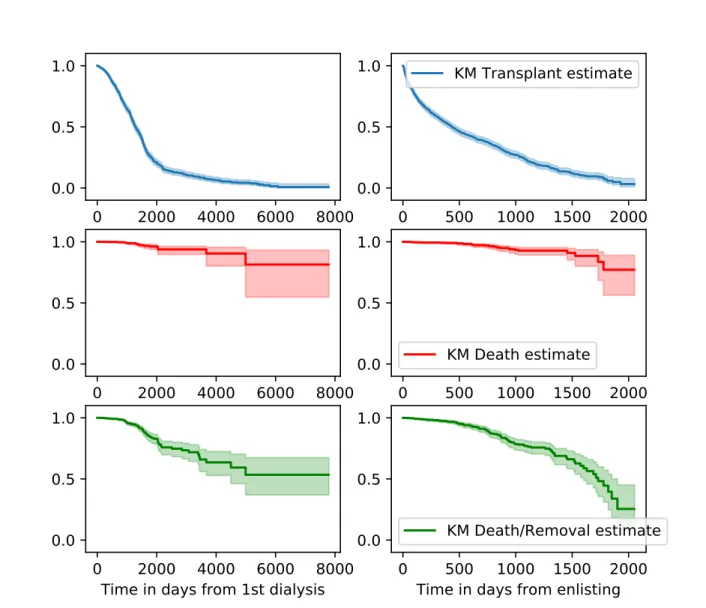
Québec between 2012-03-29 and 2017-12-13. . . 58 Figure 5.3 Kaplan-Meier curves with confidence intervals presenting time to
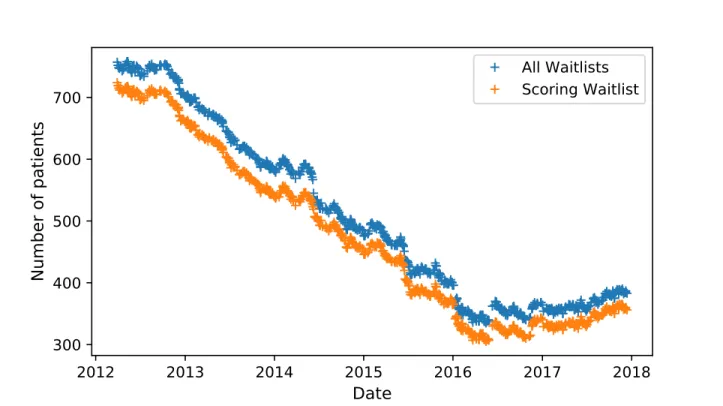
trans-plant, time to death and time to death or permanent removal from first time of dialysis and enlisting. Patients enlisted between 2012-03-29 and 2017-12-13. . . 64 Figure 5.4 Evolution of the size of the waiting-list between 2012-03-29 and
2017-12-13. . . 65 Figure 5.5 Estimation of the value of the Poisson parameter for different time
windows. . . 66 Figure 5.6 Empirical vs. theoretical Cumulative Distribution Function (CDF) of
donors arrival between 2012-03-29 and 2017-12-13. . . 68 Figure 5.7 Probability-Probability (PP) plot of donors arrival between 2012-03-29
and 2017-12-13 vs. first bisector. . . 70 Figure 5.8 Distribution of the inter-offers-times across the kidney offers made in
Québec between 2012-03-29 and 2017-12-13. . . 72 Figure 6.1 Local means for different methods with expected confidence intervals
excluding censored data from the validation set. . . 98 Figure 6.2 Local means for different methods with expected confidence intervals
including censored data in the validation set. . . 99 Figure 6.3 Empirical mean quantiles for different methods with confidence
inter-vals excluding censored data from the validation set. . . 100 Figure 6.4 Empirical mean quantiles for different methods with confidence
inter-vals including censored data in the validation set. . . 102 Figure 6.5 Symmetric Absolute Percentage Error between observed and predicted
expected time in increasing order for different experiments. We ex-cluded censored values from the validation set. . . 103
Figure 6.6 Normalised Squared Error between observed and predicted expected time in increasing order for different experiments. We excluded cen-sored values from the validation set. . . 104 Figure 6.7 Local means for the validation and test set on the PWL method with
cPRA. Excluding censored values (left) and including censored values (right). . . 109
LIST OF SYMBOLS AND ABBREVIATIONS
ANN Artificial Neural Network
AUROC Area Under the Receiver Operating Characteristic curve BMI Body Mass Index
CDF Cumulative Distribution Function cPRA calculated Panel Reactive Antibodies CWL Current Waiting-List
DCD Donation after Cardiac Death
DDKT Deceased Donor Kidney Transplantation DND Donation after Neurological Death ER Eligibility Relaxation
ESKD End-Stage Kidney Disease HLA Human Leukocyte Antigen HSP Hypersensitised Patient KDPI Kidney Donor Profile Index KDRI Kidney Donor Risk Index KEP Kidney Exchange Program KS Kolmogorov-Smirnov
LDKT Living Donor Kidney Transplantation LKDPI Living Kidney Donor Profile Index ML Machine-Learning
MAPE Mean Absolute Percentage Error MNSE Mean Normalised Squared Error MSE Mean Squared Error
MWD Mean Wasserstein Distance NSE Normalised Squared Error PWL Past Waiting-List
PP Probability-Probability QQ Quantile-Quantile
SAPE Symmetric Absolute Percentage Error SDM Shared Decision Making
SMAPE Symmetric Mean Absolute Percentage Error SRTR Scientific Registry of Transplant Recipients TQ Transplant Québec
CHAPTER 1 INTRODUCTION
1.1 Renal Replacement Therapy
Kidneys are vital organs which filter blood from its impurities. The Canadian Blood Services define End-Stage Kidney Disease (ESKD) as: “A condition in which the kidneys are permanently impaired and can no longer function normally to maintain life” (CORR, 2015).
ESKD affects more than 40000 Canadians today (CORR, 2015). As population is ageing, this number is not expected to decrease in the short-term. This has an important impact on the Canadian public health system, with 1.2% of total health expenditures in 2007 (Manns et al., 2007). So far, ESKD has been addressed through renal replacement therapy, which regroups dialysis and transplantation.
The Canadian Blood Services define dialysis as a process “whereby the blood is cleaned and wastes and excess water are removed from the body” (CORR, 2015). Even though dialysis is the most easily accessible renal replacement therapy, it is less satisfactory than transplantation. In terms of quality of life, employment rate, survival expectancy and even health expenditures, the latter outperforms the former (Laupacis et al., 1996; Wolfe et al., 1999). Both therapies imply heavy medication, but dialysis usually requires three sessions of four hours per week to filter blood. Less than 50% of patients undergoing dialysis sur-vive more than 5 years (CORR, 2015) in Canada. From an economical perspective, kidney transplantation is cost effective even for high-risk transplantations1 in comparison to dialysis
among all types of donors (Axelrod et al., 2018). Otherwise, for standard transplantations, it is cost-saving. Therefore, transplantation is indisputably the best renal replacement therapy today.
There are two types of transplantation. Living Donor Kidney Transplantation (LDKT) and Deceased Donor Kidney Transplantation (DDKT). LDKT yields better outcomes in terms of survival than DDKT (CORR, 2015). Living donations originate mostly from rel-atives or friends willing to give one of their two kidneys. In some cases, some unrelated altruistic donors donate a kidney. This can elicit chains of donations of willing to give but incompatible patient-donor pairs, each patient benefiting from a kidney of another donor.
This happens also in so-called Kidney Exchange Programs (KEPs): willing to give but in-compatible patient-donor pairs are matched to other inin-compatible pairs and result in cross-transplantations. However, in the majority of the cases, a patient does not have a compati-ble living donor, that is why around 60% of transplantations come from deceased donors in Canada (CORR, 2015).
DDKT can occur in two cases: Donation after Cardiac Death (DCD) and Donation after Neurological Death (DND). DCD happens when the donor’s kidney (as well as all other rele-vant organs) is recovered just after the heart stops beating. DND happens when the donor’s kidney is recovered while the heart keeps beating but after brain death was pronounced. In any case, the consent of the family and/or the prior consent of the donor are required. One easily understands that there is an influence of the situation in which the kidney is recovered on the expected outcomes: if the kidney is recovered after cardiac death, there is a certain time-lapse during which the organ got no oxygen. The time is very important in deceased donation: the longer an organ is outside a body (the so-called warm ischemia time2), the
worse the outcomes are (Danovitch, 2009). In deceased donation, the candidates or surgeons cannot really choose the time of transplantation, unlike in living donation.
1.1.1 General Considerations about Transplant Outcomes
In general, some sine qua non medical conditions exist for transplantation. The transplant candidate and the donor have to be blood-type compatible: O candidates need an O donor, A candidates accept A and O, B accept B and O, and AB accept any blood-type. They also have to be tissue-type or cross-match compatible, which means the patient should not have antibodies against the donor’s Human Leukocyte Antigen (HLA)3. To describe the probability of a patient of being tissue-type incompatible to a random donor, the cPRA is used. In brief, transplant candidates have blood tests every third month while waiting on dialysis. In a specialised laboratory, the candidate’s sera are exposed to beads on which common HLA antigens are fixed. In a second step, the presence of anti-HLA antibodies is detected. The cPRA is a function of the extent to which anti-HLA antibodies are present and of the relative frequency of the HLA antigens to which a candidate has antibodies in the general population. The cPRA takes values of 0-100%. The higher the cPRA, the less likely
2Warm ischemia time is the time spent by the organ out of the body. The time spent in cold storage while
the organ is transported is called cold ischemia time. Long cold and warm ischemia times are associated with worse graft survival.
3HLAs are a genetic marker of the immune footprint of a person. In transplantation, three loci are known
to be particularly important: A, B and DR; the better the HLA matching between donor and patient, the better the expected survival (Danovitch, 2009).
a candidate is to find a compatible donor. It is interpreted as a patient’s level of sensitisation. A patient is said to be hypersensitised if he has a greater cPRA than 80% or 95% for instance, according to the definition. This cPRA can vary over time, for example after a transfusion, a transplant or a pregnancy.
Full genetic twins put aside, a graft will always be eventually rejected (Danovitch, 2009) without appropriate medication. Therefore, all transplanted patients have to undergo im-munosuppressive therapies during their whole lifetime. These therapies aim at preventing the body from rejecting the kidney. Graft rejection occurs in 15-20% of patients in the first 5 years post transplant. Rejection is a diagnosis which needs to be made on a biopsy of the transplanted kidney. It is reversible in over 75% of cases by increasing the amount of immunosuppression provided. Hence, allograft rejection does not always lead to graft failure. Graft failure is defined as a transplanted kidney that has stopped to function properly. In cases of graft failure, dialysis must be resumed, a new transplantation must be provided for patients to survive. Graft failure can happen from a short time after transplantation to several years after. The objective is always to maximise the time during which a patient can live with a functioning kidney graft.
Many parameters may influence graft outcomes: some we know before transplantation, some we know after transplantation and some nobody knows. For example, the shorter the cold ischemia time, the better the outcomes (more than 36 hours is often not accepted) (Danovitch, 2009; Rao et al., 2009). However, this parameter is not available when the decision to transplant is made. Adherence of the patient to the immunosuppressive therapy is also very important (Danovitch, 2009) although it is very difficult to assess beforehand (or even not desirable). Other factors that have been associated with allograft survival include donor age, age matching, donor Body Mass Index (BMI), HLA matching, patient cPRA, donor serology (HIV, hepatitis...), donor diabetes, donor hypertension, patient time under dialysis, donor ethnicity, donor gender, donor history of cigarette, cocaine... (Rao et al., 2009; Massie et al., 2016).
1.1.2 Attribution of deceased donor kidneys in Québec
In Canada, the distribution of deceased organs is organised provincially. In Québec, it is under the responsibility of Transplant Québec to attribute organs from deceased donors. Since the 28th of march 2012, there is a new attribution system in Québec. The system is split in several priority layers: renal emergency, hypersensitised patients, combined organ
transplantations patients, paediatric patients, kidney-pancreas patients, general attribution.
When a donor becomes available, her kidneys are proposed to transplant candidates ac-cording to a certain procedure to the different priority levels. If one of the kidneys is accepted at any other priority level than the general waitlist, the second kidney comes down automat-ically to this general waitlist. For each of the patients in the general waitlist, TQ attributes a score. All patients known to be ineligible (blood-type or tissue-type ineligible) are removed from the waitlist for the specific donor who is being investigated. The patient with the higher score gets the offer, and if he declines, the next patient on the waitlist gets an offer, until the end of the waitlist, as long as a kidney remains available.
The scoring function used by TQ is based on two criteria: utility and justice. The goal is to be simultaneously fair (minimising waiting time) and efficient (maximising survival). For justice, high waiting times and hypersensitised patients get more points. For utility, young patients, better HLA match and better donor-recipient age match get more points.
1.1.3 Decision-Making
Regardless of the allocation system and the nature of transplantation, there is always the same question whether to accept or decline an offer when a patient gets one. This is an important question as donor characteristics have a significant impact on the survival of the transplanted allograft (Rao et al., 2009; Massie et al., 2016). Also, as pointed out earlier, longer waiting-time on dialysis is also associated with increased post-transplant mortality. The decision thus depends on the patient and allograft survival perspectives with a given offer, the chances of getting a better offer in the future, the survival while waiting for another offer, the chances of becoming untransplantable in the future. It also depends on how well the patient lives under dialysis and on his own values.
The notion of informed consent is predominant in clinical practice: the nephrologist should provide the candidate with elements of donor history that may affect allograft survival and the candidate should participate in the decision in full knowledge of the facts. There is a subtle but important difference between informed consent and Shared Decision Making (SDM). In SDM, patients do not only receive this information and decide. Patients are expected to reflect on the options, gather more information, ask questions to their physicians, put the alternatives in the light of their preferences, values and personal characteristics to finally come to a decision jointly with their physician (Edwards and Elwyn, 2009; Gillick, 2015).
This involves greater participation and responsibility on the patient side, but studies suggest that SDM improves both outcomes and satisfaction of the patient (Greenfield et al., 1985, 1988).
Achieving SDM in practice is very difficult. Not only is there a need for reliable decision-support tools to assess the expected outcomes of the transplant, but there is also a need for education to using such tools. The latter is entrusted to the clinical world, whereas the former is up to the scientific world. Nevertheless, this is the responsibility of the scientists to develop together with the clinicians a tool of practical interest. The tool should be easy to use, it should provide reliable, understandable, unbiased and personalised information to both patient and physician. It should leave space for a discussion between patient and physician. The physician should be able to critically look at the results thanks to her expertise. So typically, a black-box administering arbitrary injunctions is not what we need.
1.2 Setting and Problem Characteristics
On the one hand, in spite of the 42% increase in deceased organ donation since 2007 in Canada, there is still a graft shortage, with around 3500 persons awaiting a transplant in 2016 (CIHI, 2017). 260 of them died in 2016 on the waitlist. In the province of Québec, around 500 persons were waiting for a kidney transplant in 2017, and 54 of them died on the waiting-list the same year (Transplant Québec, 2018). The mean waiting-time of transplanted patients in 2017 was of 493 days (Transplant Québec, 2018).4
On the other hand, lower-quality kidneys are wasted which could have benefited to patients at risk. For some patients, getting a kidney from a high-risk donor leads to better 2-year (or 3-year) survival chances than remaining on dialysis (Bae et al., 2016; Wey et al., 2018). Indeed, not only a patient under dialysis is at risk of an event, but the longer the waiting-time, the worse the expected outcomes of a future transplant (Meier-Kriesche et al., 2000). At the same time, some high-priority patients can benefit from waiting for a better kidney offer (Wey et al., 2018).
Therefore, developing a methodology and decision-support tools to enhance informed SDM could at once:
• increase the number of transplants
• increase the survival of patients • increase the satisfaction of patients • increase the physicians’ confidence • decrease organ wastage
• decrease the cost of healthcare for ESKD
Yet, the mathematical tools which exist to foster SDM to date are not fully satisfactory. Indeed, they are designed most of the time to give an advice to the patient, and not to inform him. We think that the statistical information provided by some mathematical tools is hard to interpret for a patient, as it is given in terms of survival probability and not predicted time of survival (Wey et al., 2018). Even if we wanted to apply the methodology of, for example, Wey et al. (2018) in the province of Québec, this would not be possible due to the small size of the pool of patients and donors and the split in the data collection between post-transplant and pre-transplant. There can even be perverse side effects of too granular predictive tools with regard to the actual eventual survival (Bae et al., 2016). This problem is of course very difficult, and there will never exist a totally unbiased and at the same time understandable tool to enhance decision-making. However, we feel that work can be done in the way of extracting the information from data to foster SDM while preserving a relative neutrality.
The work presented in this thesis is part of a larger research project which aims at address-ing the aforementioned problem. This large research project has been split in two questions that the patient would like to answer in order to make his decision, while complying with the specifications for the tool (easy to use, reliable, understandable, unbiased and personalised).
1. What happens if I say yes?
How long is the kidney from this specific donor expected to survive in a patient like me?
In someone like me, how different is the expected kidney survival provided by the current offer compared to that of an average donor, or from the best donor I could get? 2. What happens if I say no?
If I decline this offer, how long am I supposed to wait for another offer? What would be the expected quality of this offer?
The second question of course relies on the first one. This thesis focuses on the second question and assumes that the first one is solved as a black-box, even though we will explore the different solutions available in the literature.
1.3 Objective
Let us consider a non-paediatric patient x in the scoring waiting-list getting a kidney offer y0 at time 0. Our objective is to predict the time T at which the patient will get a next offer
Y , provided the patient keeps being on the waiting-list in the mean-time.
Let us assume that we have a black-box q predicting the quality of an offer (for example time of survival). We want to give an estimate of the quality q(x, Y ) of the next offer. Then, we want to predict the time to next better offer (T |q(x, Y ) > q(x, y0)).
We will address this problem both mathematically, using stochastic processes, and practi-cally, developing an algorithm which we will test on data provided by TQ.
We feel useful to mention that we will not do optimisation as such here: we do not want to find an optimal allocation model for TQ. We do not want to predict the probability that a patient dies or becomes untransplantable on the waiting-list. We do not want to train a machine learning algorithm to predict the times of interest. Neither do we want to resort to brute force simulations. Instead, we propose an original and interpretable method to give highly personalised predictions, keeping always in mind that the final objective is to enable SDM.
1.4 Outline
We will begin this work by a large literature review on the field of kidney transplantation and decision-aid, including prediction of graft survival. Then we will detail the kidney attri-bution system in the province of Québec: interactions between the priority lists, exceptions and the behaviour of the scoring function used to rank patients. In the next chapter, we will present our mathematical modelling of the problem: the overall stochastic process with ar-rivals of donors, the particular point of view of a patient getting an offer, practical algorithms to learn the parameters necessary to make predictions. We will introduce the data which we used from TQ, give the characteristics of the study population, explain how we preprocessed it, verify the first main assumptions which we did in the mathematical part. Once this is
done, we will see how to verify and compare our methods with the data, developing specific methodologies for the problem and presenting the results. In conclusion, we will explain how the generic algorithm we developed works in practice, present its limitations and mention future research directions.
CHAPTER 2 LITERATURE REVIEW
2.1 Predicting Survival after Kidney Transplantation
In this section, we will discuss the predictive tools which have been developed previously to answer the first relevant question of our decision-aid: “How long is the current offer expected to function in someone like me, and how is that different from the average donor or the best donor I could get?”. We will discuss the limitations of the current approaches.
2.1.1 Models Based on Cox Regression Analysis
Although many models have been published, the only one that is widely used clinically is the Kidney Donor Profile Index (KDPI), developed by Rao et al. (2009). It relies on the Kidney Donor Risk Index (KDRI) which is a measure of the relative quality of a deceased donor kidney in comparison to a certain donor of reference, using Cox regression to model the risk of death or graft failure. The KDPI gives a measure in percentile of how much better a graft is, given the donor’s parameters, in comparison to the pool of deceased donor kidneys of the year before. However, Bennett and McEvoy (2011) criticise the KDRI, as the most important parameters for graft survival: diabetes, serum creatinine, cerebrovascular cause of death and hypertension, are presented sparsely in the data. They question both the relevance and the reliability of the data: how it is measured, how rigorously it is written down. In the same spirit of the KDPI, a Living Kidney Donor Profile Index (LKDPI) has been developed by Massie et al. (2016). They extended the KDPI to living donors also, still using Cox regression, allowing for a comparison between outstanding deceased donor kidneys and poor living donor kidneys.
Although both the deceased and the living donor KDPIs are adjusted for recipient charac-teristics, they do not account for interactions between donor and recipient characteristics in survival predictions. The presence of such interactions has been reported by Heaphy et al. (2013), who show that the negative impact of high KDPI kidneys on 5-year graft survival is much lower when the recipients have risk features for suboptimal graft survival (i.e. older recipients, diabetics, black race). The last calculator using Cox regression to date is the one developed by Ashby et al. (2017). They built a web-based calculator to improve the selection of living donors when multiple donors are available. Unlike the two former indexes, it uses both the parameters of the patient and the donor to make predictions, including both living
and deceased donors. Moreover, it gives a probability of 5 and 10 years failure. These Cox models are a useful tool to analyse the importance of each parameter. However, Cox models are not meant to make personalised survival prediction and so they should be used carefully in decision-aid.
2.1.2 Models Based on Machine-Learning
Some patient-donor approaches have been developed in the field of Machine Learning (ML), not only for kidney transplantation, but also liver and heart transplantation. The first tackling the problem of long-term graft survival prediction are Krikov et al. (2007), with an approach based on decision trees for kidneys. They trained decision trees to predict 1, 3, 5, 7 and 10-year survival probability. They used a dataset composed of approximately 90000 transplants from the United Network for Organ Sharing (UNOS) and the Scientific Registry of Transplant Recipients (SRTR). They managed to include both censored and uncensored patients in a first step to analyse the important features, but they only kept the uncensored patients to make their predictions. Their results were measured in terms of Area Under the Receiver Operating Characteristic curve (AUROC) and scaled from 0.63 for the one year prediction to 0.90 for the ten years prediction. Besides the little use of the censored values, it must be noted that no special distinction was made between living and deceased donors. Reinaldo et al. (2010) used different basic ML algorithms both in classification (survival after a pre-specified number of years) and regression (prediction of the number of months of survival). They used Brazilian data with only 106 transplantation cases and 16 features, and used 10 fold cross-validation to obtain their validation rates. They claim to have above 90% accuracy in classification for their best algorithms (decision trees). However, this result is to be set in perspective due to the very little dataset and the fact that they do not give a confusion matrix to see how the predictions perform. Additionally, the quality of the regression part is very difficult to evaluate, due to the little interpretability of the indicators they use (e.g. Mean Squared Error (MSE)). A comparable study was published the same year by Li et al. (2010) in which they use UNOS data (based on a thousand of records) to predict early graft survival after transplantation and prediction (less than 1, between 1 and 5, 5 and 10, and more than 10-year survival), based on Bayesian networks. In this case also, the classification part performs very well in terms of accuracy, sensitivity, specificity and precision (greater than 96%). The predictive accuracy was 70% with good sensitivity and precision (greater than 85%) for the 1-year prediction but worse ones for longer survival times (sensitivity and precision less than 65%). Tang et al. (2011) performed tree based classification algorithms to respectively predict 1, 3, 5, 7 and 10-year graft survival (with increasing values of AUROC for each classifier, from 0.59 for 1 year to
0.97 for 10 years, which are coherent with Krikov et al. (2007)). They used uncensored data from both living and deceased donors, and compared the outcomes between local (single-centre) data and national data in the U.S. The discrepancy between the local and national results highlights that care should be taken when applying large-scale algorithms to a local centre. Recently, Shaikhina et al. (2017) made a more specific application of ML for outcome prediction. Again, they used decision trees and random forests to a small British dataset (less than 80 grafts) for the special case of antibody incompatible patient donors pairs. The most robust model is as expected the one they get from random forests (which results in an 85% accuracy predicting early rejection). This work underlines the particular importance of the donor-specific immunoglobulin level in rejection (in addition to more commonly known parameters as HLA mismatches).
General ML algorithms were applied for other organs than kidney, for which we will only mention two recent examples, interesting to us from a methodological point of view. The first one comes from Dag et al. (2017). They handle the 1, 5 and 9-year heart transplantation survival prediction. They tackle the problem of imbalance in the data (more successes than failures) by using resampling methods. They choose to simply discard records with missing values. It is remarkable that the best performances are achieved with Logistic Regression, with AUROC values scaling from 0.62 for one year to 0.84 for nine-year prediction. Among others, their neural network is significantly outperformed by the logistic regression. Then they measure the evolution of importance of the features through time, using a weighted average of the sensitivity of the features for their different models. The second example by Pérez-Ortiz et al. (2017) tackles the liver transplantation outcome and allocation system problems through semi-supervised learning. They rebalance their dataset using both censored patients and fictional transplants (building new pairs from the already existing donors and patients), labelled from their supervised data, with nearest neighbour algorithms and refinements. The prediction was performed through support vector classifier for 3 or 12-month survival, using the rebalanced dataset, with best trade-off between overall accuracy and predictive power for the minority class obtained in the semi-supervised approach.
2.1.3 Models Based on Artificial Neural Networks
Even though Artificial Neural Networks (ANNs) are part of ML, we consider separately their use for kidney survival prediction. To the best of our knowledge, the first attempt to use ANNs for kidney transplantation was made by Brier et al. (2003), in order to predict graft-delayed function (post operative complication). Using a small, local dataset (300
ob-servations), ANN increased sensitivity but decreased specificity when compared to logistic regression. An interesting comparison between the Cox model and neural networks was given by Akl et al. (2008), with a dataset of 1900 patients with a living-donor graft having survived at least three months, for which they predict the 5-year survival. They show that their ANN is superior to the Cox model for the sensitivity and the positive predictive value, but equiv-alent for the accuracy and the specificity. The most recent example to our knowledge for an attempt to use neural networks to predict kidney transplantation survival comes from our group (Luck et al., 2017). Our colleagues used data from the SRTR (around 100000 donor-patient pairs); a Cox’s partial likelihood function is used as a first loss function, designed to handle ties (several patients deceased after the same period), which they combined to a ranking loss, designed to handle right-censored data. They tried to predict the number of years of survival and the survival curve for each patient. However, the outcomes, measured with the C-statistic (0.65), are similar to the ones from the Cox model in terms of clinical interpretation. If the algorithm was able to predict faithfully the survival curves of a spe-cific patient-donor match, this would enable to predict the time of survival with confidence intervals, which could be included in a decision-aid tool.
For more methodological information about ANNs designed for survival prediction, we refer to Faraggi and Simon (1995) for a non-linear Cox model using ANNs and Ripley et al. (2004) for a more complete overview.
2.1.4 Summary
In summary, although many models have been developed to predict patient and allograft survival in kidney transplant recipients, these tools are not used in everyday clinical practice, with the exception of the KDPI. In the U.S., the KDPI is used in the allocation system where the transplant candidates with the highest probability of survival (young, non-diabetic patients with short-time on dialysis) are given points when low-KDPI kidneys are available (i.e. the kidneys that have the best profile in terms of long-term graft survival). Transplant candidates must also pre-consent to receive offers for high-KDPI (> 85%) kidneys (kidneys from donors who have risk features for shorter long-term graft survival). The KDPI does not seem to outperform donor age in survival prediction in British Columbia (Rose et al., 2018) and it has not been validated in other provinces for the time being. The KDPI is not used in Canada, and it may not be appropriate: Canadian transplant recipients experience better long-term graft survival than U.S. patients, which may be due to differences in anti-rejection drug coverage (Gill and Tonelli, 2012). Although our group has previously used
ANNs with the American SRTR data, our next step is to gather regional data with the hope of developing a model with better accuracy to answer the first relevant clinical question for our decision-aid.
2.2 Decision-Aid
Giving a measure of graft quality and building a decision-aid are two different things, even though the latter relies on the former. Many papers which claim to have built a decision-aid actually help the policy-makers rather than the patients and nephrologists, because of how the information is presented. For instance, the KDPI gives an idea of the average quality of an organ with no consideration of the candidate characteristics and interactions between donor and recipent characteristics. It does not say with which confidence a lower KDPI organ would actually result in lower outcomes. Nor does it provide any information on the consequences of refusing an organ for transplantation. However, it might be used as a reference to optimise an allocation policy, as it is a good indicator in average. Yet, some of the predictive models of survival presented earlier are used in practice for decision-making. The KDPI is commonly used in the U.S. and by isolated nephrologists worldwide, and therefore a guide was created on how to use the KDPI (Procurement and Network, 2016). This question is important as shown by Ahn and Hornberger (1996) already in 1996. The perception of the importance of the transplantation outcomes varies among patients, they argue. Therefore, they use a decision-model in order to infer, from the patients preferences, which organs they should be proposed. Note that the decision of the patient is predicted in order to optimise the policy: the goal is to improve the allocation policy. It is a different problem than considering a given allocation policy and making decision-aid without changing it. Gordon et al. (2013) foster the concept of SDM for transplantation and distinguish it from informed consent, which only necessitates an approval of the patient after the therapy has been explained. SDM also implies that the patient has a role to play in the selection of his therapy at different steps of the transplantation process.
We present below different research fields which include the patient at different degrees in the attribution process. The first field considers the problem from the allocator’s side: how to properly optimise the attribution system, so that the patient has the best offers. The second aims at forecasting the effect of a policy on the size of the waiting-list. The third aims at optimising the decisions of the patients. The last one aims at fostering an informed decision of the patient.
2.2.1 Optimisation of Kidney Allocation Policies
Zenios et al. (2000) built an optimised allocation policy maximising the quality of life and minimising the mean waiting-time for all 6 main demographic groups. Markov Decision Pro-cesses have been used by different researchers for different purposes for liver transplantation (Alagoz et al., 2007, 2010; Erkin et al., 2010; Sandıkçı et al., 2013). Alagoz et al. (2007, 2010) apply it to advise the patient on what he should do and to build an optimal policy, whereas Erkin et al. (2010); Sandıkçı et al. (2013) use it to guess the patient’s decision, the former using inverse optimisation, and the latter with partially observable Markov Decision Processes. This is exactly the reverse of our problem: we want to predict the behaviour of the waiting-list to inform the patient on his future transplant perspectives and not predict-ing the decisions of patients. However, correctly predictpredict-ing patients’ preferences is also a means to learn what matters to patients and how to develop a decision-aid. Bertsimas et al. (2013) developed a method to design allocation policies for renal transplantation thanks to optimisation, with fairness constraints.
Harvey (2015) thoroughly modelled the current U.S. kidney allocation process to prove the need of change of policy, so as to prevent the waitlist from increasing, thanks to a discrete event model. In another work (Harvey and Thompson, 2016), she focuses on the enlisting of wealthy patients in multiple transplantation centres to maximise their chances of getting a transplant, using a discrete event model, to estimate the influence of such behaviours at the local and national level.
2.2.2 Prediction of Waiting-List Evolution
Predicting the evolution of the waiting-list is also an issue. The problem has been addressed by Abellán et al. (2004) and a discrete event simulation model is used to quantify the evolution of the kidney waiting-list in an autonomous region of Spain. The aim is to predict if the waiting-list will increase or decrease with the current policy. Yet, it does not allow to predict a patient’s waiting-time. Therefore, it is useful for the policy-maker, but not for the patient.
2.2.3 Optimisation of Patients Decisions
The problem of what type of kidney a patient should accept after a certain waiting-time has been addressed in the literature as the so-called secretary-problem. The basic general version of this problem is called by Chun and Sumichrast (2006) the sequential assignment problem, in which multiple candidates arrive at random times to get different positions in a
firm. Different rewards are attributed to candidates matched with a certain position. They prove that the problem only depends on the rank between the candidates and the rank between the positions. Another version of the problem is the multiple-stopping problem with random horizon as described by Krasnosielska-Kobos (2015) in which for example kidneys arrive at random times and have to be accepted or rejected by patients who can be randomly removed from the waiting-list (death, or transplantation impossibility). They prove that this problem can be reduced to a multiple-stopping problem with finite-horizon and discounted reward. The last improvement in this secretary problem, applied to kidney transplantation, have been made by Bendersky and David (2016a,b). The first paper focuses more on the secretary-problem, and how to model the horizons (uniform or Erlang distribution) and find the optimal strategy with dynamic programming, whereas the second exemplifies the case of kidney transplants: how demanding regarding the quality of the kidney a patient should be as time goes. To quantify the quality of a matching they only use ABO and HLA matching, although multiple other donor and recipient factors (age, sex, body size...) influence the probability of allograft function and survival. According to their model, the patient should be less demanding on graft quality as his waiting-time increases. This approach of decision-aid through operations research is interesting for us, because of the mathematical modelling part, the terminology used and the assumptions made. However, on the methodological part, we think it does not enhance SDM at the personalised level. It would be a good model of patients’ rational behaviour to make simulations of the allocation system, but not to actually say to a patient if he should accept or decline a particular offer at a certain time.
2.2.4 Prediction of Outcomes when Declining Current Offer
We see only two very recent examples in literature of actual decision-aid tools. The first has been developed by Wey et al. (2018) who designed an algorithm to give to the patient: probability of 3-year survival if he accepts the current offer, versus probability of 3-year survival if he refuses it. Their algorithm uses data from the SRTR. It uses the KDRI to predict the quality of a certain graft and uses the similarity between donors. The very positive part of their work is the consideration of the problem in terms of final outcomes taking into account probabilities of having an event while in the waiting list. However, there is still the question of the interpretability of probabilities by a patient (also subject to their predictive power, here of 0.69 in AUROC). This study gives strong motivation for accepting relatively high-risk kidneys for some patients. The second example comes from Bandi et al. (2018). Their approach is similar to ours in the objectives: estimating the waiting-time of candidates awaiting scarce resources attributed according to a priority attribution system. They design a general framework applicable to kidney queues as they exist in the U.S. They
model the problem as a multi-class (for multiple priority groups) multi-server (for multiple qualities of kidneys) problem. They include robust optimisation tools to cope with incomplete information. On synthetic experiments, their method outperforms significantly simulation both in accuracy and computation time. They test their algorithm on the American kidney allocation system with data from the SRTR. They use the KDPI to estimate the quality of a kidney and try to predict (average and percentiles) the time to next offer and to next better offer. They include patients’ preferences in terms of quality, blood-type, location and rank on the waiting-list (assumed to be determined by the waiting-time). Their method only uses publicly available information and can be used by transplant centres or physicians. The average absolute error of the estimates compared to empirical times is 15%. This is interesting because the estimates are very well calibrated and work with little information. However, this method is not individually personalised, makes clusters of similar patients, which works well in the American case, because of the high importance given to waiting-time in practice. We will try to go into further personalisation, less assumptions and more on-line adaptivity in a context of full information and collaboration with TQ, in line with the situation of the province of Québec.
CHAPTER 3 KIDNEY ATTRIBUTION SYSTEM IN QUÉBEC
This section extends and details the explanation given in 1.1.2. It is summarising and analysing the attribution procedure document provided by TQ (Transplant Québec, 2016).
3.1 Overall System
This system was designed qualitatively to maximise social welfare and come to a trade-off between utility and equity, most likely influenced by other systems worldwide (in the U.S. particularly).
3.1.1 Priority Lists
The current kidney allocation system in Québec has been set up on the 28th of March 2012
(see section 1.1.2). As soon as a donor becomes available, her kidneys are proposed to the different priority lists, in the following order:
1. renal emergency patients
2. Hypersensitised Patients (HSPs)
3. combined organ (including a kidney) patients: excluding kidney-pancreas 4. paediatric patients
5. kidney pancreas patients 6. general attribution
Number of offers Several subtleties govern the attribution. Even though our work focuses on the general attribution (also called scoring waiting-list or general attribution scoring list), it is important we should understand the whole process, as what happens on higher priorities has a direct impact on this general attribution. Only one kidney per list can be accepted in the five priority lists. If a kidney is accepted in one of these priority lists, the other has to be proposed to the general attribution scoring list, unless it has been accepted in the renal emergency list, in which case the second one can be accepted in the HSP list. Once a kidney has been accepted in a priority list, all the patients from the other priority lists get into the general attribution scoring list. The patients of the priority list in which the
kidney has been accepted do not get into the general scoring list, at the exception of HSP and kidney-pancreas patients. If no kidney has been accepted at the end of the round, the two kidneys are simultaneously proposed for a double-graft in the general attribution, under some conditions.
Applicability of the priority When a donor has a single kidney, no priority is given to combined organs and kidney-pancreas patients. When a donor is above 45, paediatric patients do not have a priority. To get a priority, the donor of a kidney-pancreas patient must be: less than 50, with a BMI less than 30 and non-diabetic.
Transplant Centres Even though the attribution is managed by TQ, a certain freedom is given to the transplant centres. Thus, when a kidney is considered as too bad or of no interest with respect to their patients by a centre, the centre can decline the offer for all its patients. In this case, the remaining patients of this centre are removed from the waiting-list for this very kidney.
3.1.2 General Scoring List Eligibility
To get an offer, a patient must be at first blood-type eligible to the donor. Eligibility as defined by TQ is more restrictive than compatibility. It is a fairness constraint to prevent shortage in specific blood-types (as is common for living unrelated donation, where very few O donors are available as they were all compatible to their related patient). Blood-type eligibility as per TQ standards is presented in table 3.1. All blood-type ineligible patients are removed from the waitlist at the beginning of the attribution process.
Table 3.1 Bloodtype eligibility as defined by TQ.
Candidate Donor O O A A B B AB (if cP RA = 0) AB AB (if cP RA ≥ 1) AB, A, B
The second condition is cross-match compatibility. Thanks to the cPRA of the patient, it is possible to know in advance if the patient will have specificities against the donor. Transplant
candidates who have an anti-HLA antibody that is specific to a given donor’s HLA (donor-specific antibodies) are removed from the waitlist at the beginning of the attribution process. A patient with no pre-determined anti-HLA antibody to a given donor is thus eligible to an offer. In rare occurrences, although a transplant candidate can be deemed eligible a priori, the final compatibility testing in which the candidate’s serum is put in contact with the donor’s cells will reveal the presence of an anti-HLA antibody that had not been detected. In theses cases, transplantation will not occur and the kidney will return to the attribution list for another candidate.
The third condition for a patient to be eligible to an offer is to be active on the waiting-list. A patient may be namely temporary or permanently removed from the waiting-list due to a health or personal reason. Transplanted patients (from any type of donation) are removed from the waiting-list. To be active on the waiting-list, a patient also needs to be thoroughly investigated for the absence of contraindications to transplantation (severe and untreatable coronary or vascular disease, active or recent cancers, severe and untreatable infections, non-adherence or unstable mental health problems). Furthermore, transplant candidates need to have severe chronic kidney disease, defined as the need for dialysis or poor kidney function.
Scoring Parameters
In order to rank the waiting-list, some parameters need to be known for both candidate and donor (if we assume that all are active and in the general attribution). Their dates of birth, their blood-type, their HLA profile at the A, B and DR loci. Information on the date a transplant candidate has been registered on the waiting-list, the date he started dialysis when applicable, and his most recent cPRA is also required. For the donor, we need the date of death. We also need the specificities of the patients used to compute his cPRA, to be able to predict the cross-match.
Waiting date The waiting-time is computed as the time elapsed between the day of the offer and the day of the first dialysis session. However, for patients enlisted before the 28th of
March 2012, the waiting-time can be computed as the time elapsed between the day of the offer and either the date of the first dialysis session or the date a candidate was first registered on the waitlist, whichever is longest. This exception was made to avoid disadvantaging patients who were registered on the waitlist before the change in the attribution system was implemented in 2012. Moreover, for patients who got a transplant which survived more than three months and go back to dialysis after graft failure, the waiting date is chosen as the new