Science Arts & Métiers (SAM)
is an open access repository that collects the work of Arts et Métiers Institute of Technology researchers and makes it freely available over the web where possible.
This is an author-deposited version published in: https://sam.ensam.eu
Handle ID: .http://hdl.handle.net/10985/10186
To cite this version :
Gérald FRANZ, Farid ABED-MERAIM, Tarak BEN ZINEB, Xavier LEMOINE, Marcel
BERVEILLER - Role of intragranular microstructure development in the macroscopic behavior of multiphase steels in the context of changing strain paths Materials Science and Engineering A -Vol. 517, n°1-2, p.300-311 - 2009
Accepted Manuscript
Role of intragranular microstructure development in the macroscopic
behavior of multiphase steels in the context of changing strain paths
Gérald Franza, Farid Abed-Meraima,*, Tarak Ben Zinebb, Xavier Lemoinec, Marcel Berveillera
aLPMM, UMR CNRS 7554 – Arts et Métiers ParisTech, 4 rue Augustin Fresnel, 57078 Metz Cedex 3, France
bLEMTA, UMR CNRS 7563 – Nancy University, 2 rue Jean Lamour, 54500 Vandœuvre-lès-Nancy, France
cR&D Automotive Products, ArcelorMittal Maizières, voie Romaine, B.P. 30320 57283 Maizières-lès-Metz, France
ABSTRACT
Sheet metal forming processes are commonly associated with strain-path changes in the material. Macroscopic softening/hardening transient effects can appear due to the plastic anisotropy induced by these deformation stages. Such characteristic effects can mainly be ascribed to the intragranular microstructure development and its evolution. It subsequently becomes necessary to accurately describe the dislocation patterning during monotonic and sequential loading paths in order to obtain a relevant constitutive model. In the present work, three types of local dislocation densities are taken to represent the spatially heterogeneous distributions of dislocations inside the grain. The resulting large strain single crystal constitutive law, based on crystal plasticity, is incorporated into a self-consistent scale-transition scheme. With the help of a rate-independent
regularization technique, this new extended multiscale model is able to calculate plastic slip activity for each grain, and it can also characterize the evolution of the dislocation microstructure. We show that our model successfully reproduces several mechanisms of intragranular substructure development that have been observed in TEM micrographs in the context of various loading conditions. Our approach is also capable of quantitatively predicting the macroscopic behavior of both single-phase and dual-phase polycrystalline steels in the context of changing strain paths.
Keywords: Micromechanical model; Crystal plasticity; Intragranular substructure;
Dislocations; Changing strain paths; Stress–strain behavior.
* Corresponding author. Tel.: +(33) 3.87.37.54.79; Fax: +(33) 3.87.37.54.70. E-mail address: farid.abed-meraim@metz.ensam.fr
Accepted Manuscript
1. Introduction
Sheet metal forming processes often involve strain-path changes together with large deformations. Predicting the main features of the macroscopic behavior of
polycrystalline aggregates during complex loading sequences requires an accurate modeling framework that takes into account the different sources of plastic anisotropy. The main physical cause of the softening/hardening transient effects that appear during sequential loading paths can be attributed to the evolution of intragranular dislocation patterns. In order to construct a relevant constitutive model, it is necessary to build an accurate description of the dislocation patterning in the context of monotonic and complex strain paths.
For many years, substantial effort has been devoted to accurate modeling of these softening/hardening effects, since such phenomena can significantly affect the strain distribution and may eventually cause flow localization and failure in the material. For this purpose, two main approaches have been concurrently developed in the literature: continuum (phenomenological) models and multiscale (micro-macro) descriptions. The main difference between the various attempts to capture these important macroscopic features lies in the scale of modeling chosen to describe these characteristic
softening/hardening transient effects.
In the context of continuum approaches, the consequences of the multiple sources of plastic anisotropy are accounted for by means of macroscopic scale modeling. The initial texture anisotropy of the material has been successively represented by various types of yield functions, ranging from quadratic functions, such as the Hill’48 yield criterion, to more elaborate non-quadratic descriptions. Isotropic, kinematic, or combined hardening laws are commonly used to reproduce the work-hardening behavior for various strain paths. Teodosiu and Hu [1] have proposed a continuum model capable of successfully reproducing the macroscopic softening/hardening effects observed during sequential loadings. In this semi-phenomenological model, which represents an extension of an earlier contribution by Hu et al. [2], three internal state variables are introduced at a macroscopic scale to describe the specific aspects of the evolution of the dislocation substructure. The constitutive equations combine both isotropic and kinematic hardening, while the shape of the yield surface is expressed using the Hill’48 criterion together with the three internal state variables. An
Accepted Manuscript
incorporated the crystallographic yield locus developed by Van Houtte et al. [4]. Despite the well-recognized benefits of continuum models in terms of computational efficiency, practical usability, and reduced implementation effort, these approaches do have certain limitations. Drawbacks include the fact that the initial texture and
substructural plastic anisotropy are merely approximated at the macroscopic scale, the lack of direct and physical linkages between the various scales for the purposes of material parameter identification, and the difficulty in accounting for textural evolution.
By contrast, micromechanics-motivated multiscale models provide descriptions of the multiple sources of plastic anisotropy at their appropriate scales. In this context, the material is considered as a set of grains with different crystallographic orientations, and the overall behavior is modeled by integrating the specific behavior of each elementary constituent. As a result, the constitutive equations can be expressed at the slip-system level, which corresponds to the microscopic scale. The characteristic features due to dislocation can then be partially reproduced by evolving the mean dislocation density across each slip system and calculating its coupling using the hardening law. In an attempt to improve our ability to model internal stresses associated with the
intragranular microstructure, a number of multiscale models have been proposed based on dislocation distribution morphology (see, for instance, Muller et al. [5], Lemoine et al. [6], and Langlois and Berveiller [7]). These models rely on Mughrabi’s two-phase composite description [8] for the intragranular microstructure. Dislocation walls with high local dislocation density (hard phase) are separated by regions with low local dislocation density (soft phase). Because the development of dislocation distributions during plastic deformation takes place at the mesoscopic scale, Peeters et al. [9,10] proposed a new multiscale model that combines a micro-macro approach (using a full-constraints Taylor model [11]) with mesoscopic modeling. They showed that the evolution of the dislocation substructure can be accurately described using their methodology, due to the specific properties of the dislocation walls (with respect to polarity and latent hardening). Peeters and co-workers confirmed that the
softening/hardening transient effects observed experimentally during sequential loadings can also be correctly reproduced using their approach.
In the present paper, a crystal plasticity-based model coupled with an accurate description of the heterogeneous dislocation distribution is incorporated into a self-consistent scale-transition scheme to reproduce the evolution of intragranular substructure during plastic deformation. We then investigate the impact of the
Accepted Manuscript
dislocation arrangement on the macroscopic effects by considering two constitutive descriptions, namely, the current modeling approach and a simpler model that does not precisely account for the intragranular microstructure. We compare results from each of the two models and conclude that these data emphasize the impact of intragranular substructure evolution on the plastic behavior of multiphase steels.
2. Mesoscopic modeling – single crystal behavior
This section describes the elastic–plastic single crystal behavior within the large strain framework. This can be used for both B.C.C. and F.C.C. materials; however, because modeling at the microscopic scale is based on experimental observations of intragranular microstructures for B.C.C. metals, application of this model will be restricted to these types of materials. 24 independent slip systems are associated with B.C.C. crystals, which are given by the two families <1 1 1> (1 1 0) and <1 1 1> (1 1 2).
The local incremental elastic–plastic constitutive law gives the relation between the nominal stress rate tensor n and the velocity gradient
g
v x as
n l g , (1)
where l is the fourth-order tangent modulus. Our new model is based on the pioneering contributions [12-16]; however, we also introduce certain improvements, especially with regard to slip system activity. In particular, we have devised a new criterion for determining the set of active slip systems along with a new formula for calculating slip rates [17,18]. This regularization technique considerably reduces the computational effort, as compared to more classical methods for selecting active slip systems. In the following analysis, we will use Einstein’s conventions unless otherwise specified.
The velocity gradient g classically consists of a symmetric part d, which expresses the total strain rate, and a skew-symmetric part w, which represents the total rotation rate. These two tensor quantities can further be decomposed into elastic and plastic components, indicated with superscripts e and p, respectively:
, e p , e p.
g d w d d d w w w (2)
The plastic parts of d and w are related to the slip rates
by, , p g g p g g g g
d R w S (3)Accepted Manuscript
where Rg and Sg denote the symmetric and skew-symmetric parts, respectively, of the
Schmid tensor for slip system g. These tensors are defined using the unit vector n, normal to the slip plane, and the unit vector m , which is parallel to the slip direction, as
1 1 , , 2 2 R m n n m S m n n m (4) where designates the tensor product.2.1. Regularization method for the detection of active slip systems
Classical thermodynamics-based analysis defines the plastic dissipation rate per unit volume dis as
: :
is
p g g
d d R
. (5)It follows that the resolved shear stress,
g, for a slip system g, defined as:
g g
R , (6)corresponds to the thermodynamic driving force associated with the variable
g. In order to satisfy the material invariance requirements, we calculate the resolved shear stress rate
g using an objective derivative for the Cauchy stress tensor . This is achieved by the introduction of a lattice spin-based derivative ˆ such asˆ :
g g
R . (7)This co-rotational lattice derivative ˆ follows the crystallographic rotation during loading, and is expressed as
ˆ wewe
, (8)
where is the Cauchy stress rate tensor.
According to the Schmid law, for plastic behavior, the definition of plastic yield or critical resolved shear stress leads to the following flow rule for a given slip system g:
0 and 0 0 and 0 0 , g g g c g g g g c g g g g c τ τ τ γ τ τ τ γ
(9)where
g and
cg are the resolved shear stress acting on system g and the corresponding critical resolved shear stress, respectively.Accepted Manuscript
Within the potentially active slip systems (i.e.,
c), several subsets of active systems (i.e.,
c and
c) may exist. According to Franciosi and Zaoui [19], one should define as truly active the combination of slip systems that minimizes thedeformation energy. From a numerical point of view, this requires performing a combinatorial analysis, which is generally excessively time consuming. A new
approach [17,18] is adopted here in order to avoid lengthy combinatory analyses and to significantly reduce the computing time. Accordingly, relation (9) is replaced with a rate-independent regularization technique g g
g, ,g g
gc
k
.Among several possible regularization functions, we adopt the following form:
0 1 2
1 1 1 1
1 tanh 1 tanh 1 1 tanh
2 2 2 g g g g g ref c ref k k k k H , (10) where H is a hardening parameter, and k k0, 1, k2, , and ref ref are purely numerical parameters. For an active slip system g, this regularized form of Schmid’s law leads to
ˆ :
g g g
k R
, (without summation over g). (11) Hooke’s law takes the following form within the large strain framework:
ˆ C d: e tr d , (12)
where C is the fourth-order elasticity tensor, and tr
denotes the trace operator. After mathematical development of the consistency condition, the slip rate can be expressed as
: :
g gh h
M
R C 1 d , (13) where gh
hg Rh : : g
1 C RM is obtained by inverting a matrix in which hg
denotes the identity matrix, Rh khRh, and 1 is the second-order identity tensor. 2.2. Local incremental elastic–plastic constitutive law
The relation between the co-rotational derivative of the Cauchy stress tensor, ˆ , and the nominal stress rate, n , is given by
ˆ n w p wp tr d d w
. (14)
Combining the previous equations with the large strain single crystal incremental constitutive law (1), the local elastic–plastic tangent modulus is obtained in the form
Accepted Manuscript
1 1 2 2 , ijkl ijkl ik lj il kj ik lj il jk g g g gh h ijpq pq ip pj ip pj mn mnkl mn kl l C C R S S M R C
(15)where Mgh is a shorthand notation for the components of matrix M .gh
3. Microscopic modeling – intragranular microstructural evolution
This part of the present multiscale model, based on experimental observations of B.C.C. grains, is inspired by the work of Peeters et al. [9,10]. Microscopic modeling allows the softening/hardening transient effects, which are observed at the macroscopic scale during sequential loadings, to be related to the evolution of the dislocation
distribution inside the crystals.
Many experimental studies on deformed B.C.C. metals, including uniaxial tensile tests [20-23], simple shear tests [23,24], plane strain tensile tests and biaxial expansion tests [22], as well as sequential loadings, e.g., reverse tests or cross tests [22-24], have shown that dislocations are generally distributed heterogeneously, with alternating planar regions of high local dislocation density, namely, the dislocation sheets, and low local dislocation density zones, i.e. the cell interiors (see Fig. 1a).
3.1. Intragranular substructure description
In order to describe this intragranular substructure based on physical elementary mechanisms of creation, storage, and annihilation of dislocations, it is necessary to associate three different types of dislocation densities (see Fig. 1b). These are
introduced as internal variables in our model and are relevant to both of the zones that define the heterogeneous dislocation distribution.
The randomly distributed dislocations inside cells are represented by a single local dislocation density
his dislocation density is considered to produce isotropic hardening. Two additional types of dislocation densities are associated with the dense dislocation walls. The first, denoted
wd, represents immobile dislocations that are stored in the dislocation sheets. This density parameter conveys the dislocation tangle during plastic deformation, which is responsible for latent hardening during strain-path changes. The second one, denoted
wp, is the local, directionally movable or polarizedAccepted Manuscript
sheet, but which can move again during reverse tests. This latter density has a polarity or sign that reproduces asymmetry in slip resistance.
3.2. Formation of dense walls of dislocations
The dislocation sheets are generated to offer minimal resistance to the slip activity under a given deformation mode [25]. This implies that these walls should be
constructed parallel to the crystallographic planes on which the slip activity is greatest. Hence, in B.C.C. crystals, the dense dislocation walls will logically have to belong to the families of planes that exhibit {110} or {112} orientations. However, experimental evidence suggests that these sheets are instead only ever parallel to {110} planes. Moreover, most TEM micrographs that are taken after mechanical tests performed on B.C.C. materials [23] show one or two families of dense dislocation sheets (see Fig. 2).
In agreement with these observations, our microscopic model will construct at most two families of dislocation sheets, parallel to the {110} planes on which the highest and second highest slip activity rates occur. Six independent families of dislocation walls can be defined in this way (see Table 1).
In order to account for the effect of the pre-existing microstructure and thus for the strain-path history of the material, the model will necessarily have to distinguish a set of existing generated sheets (one or two in number) from formerly existing sheets (four or five according to the number of walls present in the current step). The model thereby takes into account both evolution and interaction between dislocation substructures as developed during sequential strain paths.
Sections 3.3 and 3.4 describe the evolution equations that model the currently existing dislocation walls and the previously existing dislocation sheets, respectively.
3.3. Evolution of dislocation densities associated with currently existing walls
During plastic deformation, the mobile dislocations can either get trapped inside cells and in walls or get annihilated with immobile dislocations of opposite sign or through pencil glide. These phenomena are accounted for through the evolution equations of three types of dislocation densities, using two different terms of hardening, which express the mechanisms of immobilization (or creation) and recovery (or annihilation).
Accepted Manuscript
According to the earlier work of Kocks [26], the evolution of the local density of immobile dislocations
wd stored in walls can be further decomposed into a storage term and a recovery term.The evolution of the intensity of local dislocation density for each of the existing generated dislocation sheets will thus be expressed as
1 wd wd wd wd wd i I i R i i b
, (16)with b representing the magnitude of the Burgers vector and i the total slip rate on the crystallographic plane on which the ith greatest slip activity occurs. The first part (storage term) of the above equation characterizes the construction of the dense sheets, and the immobilization parameter Iwd reproduces the way in which the mobile
dislocations can be caught inside walls. The second part (recovery term) represents the recovery mechanisms, and the recovery parameter Rwd reproduces the annihilation of
the immobile dislocations through disintegration of edge dislocations of opposite sign.
Polarity assigned to dense dislocation sheets
During monotonic loading, the dense dislocation sheets get polarized. Polarization is due to mobile dislocations being arrested on slip systems that are non-coplanar to the walls. Consequently, dislocations of opposite sign will be concentrated on either side of the wall. The flux
iwp of the dislocations covering the boundaries of each existing generated wall i is thus expressed in terms of the slip rates of all the slip systems non-coplanar to that family i. It is calculated as follows:1 s n wp s w i i s b
m n . (17)The slip rate
s on slip system s can be positive or negative; it thus integrates the different slip directions on a particular slip system. In Eq. (17), n denotes the number of slip systems (n = 24 for B.C.C. crystals). To select only those slip systems that are non-coplanar to the considered family of walls, each slip rate is multiplied by the scalar product of the unit vector ms, assigned to the slip direction of system s, and the unitAccepted Manuscript
As before, the evolution of the polarized dislocation density associated with existing generated walls can be expressed by means of the summation of two contributions
sign
wp wp wp wd wp wp wp wp
i i I i i R i i
, (18)where Iwp is a parameter that characterizes the storage of the directionally movable dislocations, while parameter Rwp accounts for the mechanism of annihilation of the polarized dislocations associated with the walls. The storage of mobile dislocations on the border of walls is achieved from their interactions with other mobile dislocations but also with other directionally movable dislocations already stored in these dense walls. For that reason, in Eq. (18), the immobilization term is expressed in terms of both the polarized dislocation densities
wp and immobile dislocation densities
wd stored in dense walls. The annihilation process only takes place between mobile dislocations of opposite sign.In a reverse test, most of the active slip systems during prestrain remain active, but in the opposite direction. The dislocation flux associated with a family of currently
generated dense walls i is then reversed. The polarity dislocations that have already been accumulated along walls can easily move away and be annihilated by dislocations of opposite sign, a phenomenon which can be expressed by the following equation:
wp wp wp
i Rrev i i
, (19)where Rrev corresponds to the rate of annihilation of the mobile dislocations responsible for the polarity of the dense dislocation sheets consistent with the reversal of the flux.
Polarity allows us to account for the phenomena that occur during Bauschinger tests (strain reversal). During the prestrain, mobile dislocations of opposite sign will
accumulate on both sides of the walls, leading to their polarization. The polarity dislocation density will grow (in absolute value) according to Eq. (18). During the reversal of the load, the directionally movable dislocations responsible for the polarity will recover in movement and will be annihilated by dislocations of opposite sign. The polarity dislocation density will logically decrease (in absolute value) according to Eq. (19), which only takes into account the mechanism of annihilation. Existing generated dislocation walls will then depolarize gradually, which will be revealed at the
macroscopic behavior level by strain-hardening stagnation. Finally, after this transition regime, when the dense walls are depolarized, polarized dislocations of opposite sign
Accepted Manuscript
will again accumulate along the walls, consistent with the current deformation mode. Therefore, there will be a new increase (in absolute value) of the directionally movable dislocation density, which can be described by Eq. (18), exactly as during the prestrain.
3.4. Evolution of dislocation densities associated with former walls
A strain-path change or a rotation of the grain towards a stable orientation will lead to the activation of new slip systems. The mobile dislocations moving along the newly activated slip systems will generate new families of dense walls corresponding to the current strain path and will disintegrate previously generated dislocation sheets.
According to microstructural observations after a cross test, it would seem that the previously existing dense walls coexist with the newly formed ones, but without storing dislocations any further. These previously generated walls are then slowly removed by interaction with non-coplanar mobile dislocations associated with the newly activated systems. The disintegration of the former intragranular substructure is modeled by the following equations: ncg wd wd i i new R b
, (20) ncg wp wp i i new R b
, (21)with new representing the total slip rate on both of the crystallographic planes that feature the highest slip activity and Rncg indicating a parameter that characterizes the destruction of former dislocation walls.
3.5. Formation and evolution of statistically stored dislocations in the cell interiors We assume that the statistically stored dislocations in the cell interiors are
responsible for the isotropic hardening in the material. The evolution of the dislocation density is expressed by the summation of a storage term and an annihilation term, according to the Kocks law
1 1 n s s I R b
, (22)where I and R are, respectively, the immobilization parameter and recovery parameter associated with the randomly distributed dislocation network.
Accepted Manuscript
During a reverse test, most of the slip systems that were active during prestrain remain active, but in the opposite direction. As already mentioned, the dense dislocation sheets generated during prestrain will continue to exist and further develop, changing only their polarity. It was experimentally observed that the statistically stored
dislocation density in the cell interiors tends to decrease during load reversal. The directionally movable dislocations, responsible for the polarity of the dense walls, are very likely to be at the origin of this annihilation. An additional source of annihilation is added to Eq. (22) to account for this phenomenon as follows:
2 1 1 1 2 bausch n n s s wp s sat s I R R b
, (23)where y y if y0; y 0 otherwise. Parameter R2 reflects the importance of the annihilation of the statistically stored dislocations in the cell interiors by the remobilized directionally movable dislocations associated with the dense dislocation sheets. The switch parameter will activate ( 1) or inactivate ( 0) this additional term, depending on whether or not there is reversal of the flux associated with a family of currently generated walls. The value of
bausch will be different according to the number of reversed fluxes. In summary, if only one flux is reversed, then
bausch
iwp ; otherwise,
bausch
1wp
2wp .3.6. Isotropic hardening, latent hardening and polarity
It is necessary to relate the critical resolved shear stress on each slip system s to the three above-defined dislocation densities, i.e., the dislocation density in the cell interiors, the immobile dislocations stored in the dense walls, and the polarized dislocation density associated with the dislocation sheets. Following Mughrabi’s composite model [8], the intragranular microstructure in deformed metals is
decomposed into two phases. The dislocation sheets, due to their high concentration of dislocations, are considered the hard phase, while the cell interiors, with low local dislocation density, correspond to the soft phase. The resulting critical resolved shear stress is thus obtained from the summation of the stresses in the cell interiors and in the dislocation sheets as
6
0 1 1 s s cell wd wp c c is is i f f
, (24)Accepted Manuscript
where f is the volume fraction of the dislocation sheets and s0 c
is the initial critical resolved shear stress.The contribution to the critical resolved shear stress of the isotropic hardening, caused by the statistically stored dislocation density in the cell interiors, is given by the classical Taylor equation
cell b
, (25)where
is the dislocation interaction parameter and
is the shear modulus. The dislocation sheets are associated with latent hardening, as they prevent the mobile dislocations from moving on non-coplanar slip system planes. The contribution to the critical resolved shear stress on slip system s of the immobile dislocation density, stored in a family of dense walls i, can be given by adapting the Taylor equation:wd wd s w
is b i i
m n . (26)The dislocation wall polarity implies the existence of slip resistance asymmetry. When the same slip systems remain active, but in the opposite direction, the
directionally movable dislocations are not hindered by the dense walls. Hence, the contribution to the critical resolved shear stress on slip system s of the polarized dislocation density, associated with a family of dislocation walls i, can be written as
signwp wp s w wp
is b i i i
m n
. (27)3.7. Prediction of the intragranular microstructure
The following results arise from simulations on single crystals of IF-steel depicting various crystallographic orientations. The initial orientation of the crystals, which was not available experimentally, needs to be known in order to predict the substructure shown on TEM micrographs. However, the initial orientation of the crystals under investigation can be determined by following the simulated evolution of the Euler angles during plastic deformation. The material parameters, given in Table 2, have been identified by Peeters et al. [9,10] using experimental results at a macroscopic scale, i.e., stress–strain curves in the context of complex strain paths.
Accepted Manuscript
3.7.1. Monotonic simple shear
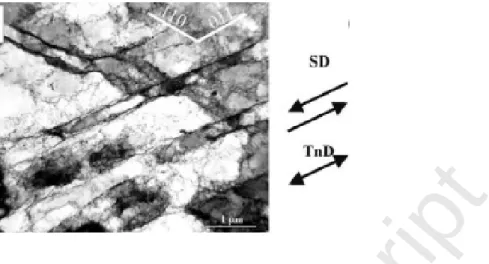
Fig. 2a shows a longitudinal plane view TEM micrograph of a (-27.7, 133.5, 51.7°)-oriented grain in a 15% sheared specimen. The shear direction (SD) is parallel to the rolling direction (RD), and the shear plane normal (SPN) is parallel to the transverse direction (TD). A single family of dislocation walls can be seen in this grain, which is parallel to the (101) crystallographic slip plane and roughly parallel to the macroscopic shearing direction.
Fig. 2b shows a longitudinal plane view TEM micrograph of a (-41.6, 135.2, 38.7°)-oriented grain in a 30% sheared specimen with SD parallel to RD and SPN parallel to TD. Two families of dislocation walls can be observed in this grain, the most
pronounced one running parallel to the (101) crystallographic slip plane, and the second running parallel to the (011) crystallographic slip plane.
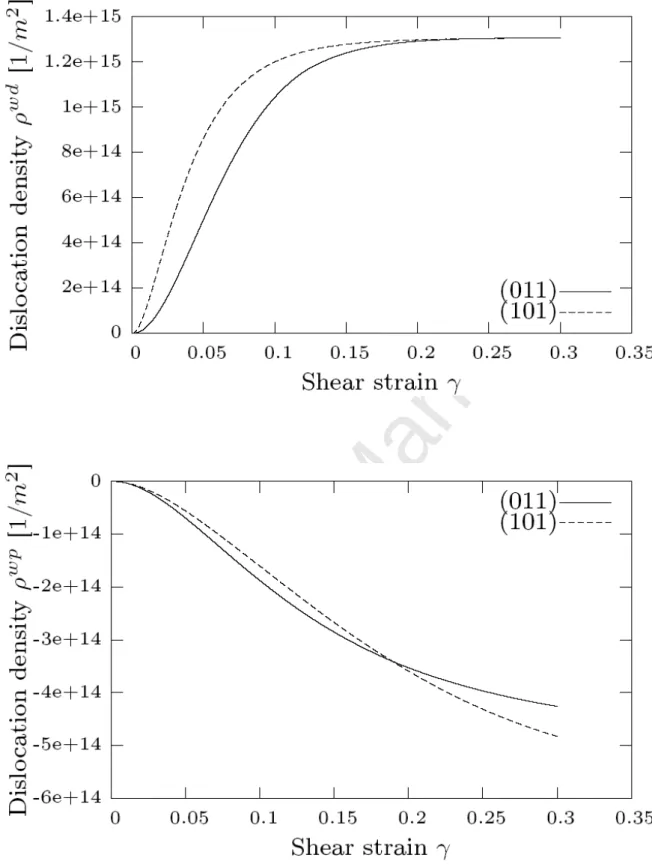
The model predictions for the heterogeneous dislocation distribution in these crystals can be depicted by means of the intensity and the polarity of the dislocation walls as functions of the shear strain (see Figs. 3–5).
Our model correctly predicts both families of dislocation walls in the crystals, whatever the grain orientation, as illustrated in Figs. 3–5.
It is predicted that a crystal with an initial orientation of (-34.5, 135.7, 51.5°) will rotate during 15% simple shear towards an orientation close to that experimentally observed, as illustrated in the TEM micrograph of the crystal presented in Fig. 2a. For this particular crystal, the model predicts essentially one pronounced family of
dislocation sheets, parallel to the (101) crystallographic slip plane, in agreement with the experimental observations (see Fig. 3). Note that a second minor family of dislocation walls, with lower intensity, is partially detected during simple shear. This family has also been detected by Peeters et al. [10]. Two families of dislocation walls initially seem to be generated but it quickly becomes apparent that only one actually comes into existence. This can be explained by a change of slip activity during plastic deformation caused by the grain rotation. If a crystal with an initial orientation of (-27.2, 133.4, 53°), similar to that used by Peeters et al. [10], is considered, our result is clearly improved. Consistently, only the pronounced family of dislocation walls revealed by the TEM micrograph is then predicted (see Fig. 4). Figs. 3–4 reveal that the predicted polarity for the dislocation wall families, parallel to the (101) crystallographic slip plane, is about ten times smaller than their intensity. We note that the polarity corresponds to an accumulation of directionally movable dislocations due to
non-Accepted Manuscript
coplanar slip systems. During the loading process, only one slip system is dominantly activated, and few dislocations are in motion on the other slip system planes at that time. Therefore, the obtained levels of polarized dislocation density are quite realistic. This conclusion is confirmed by comparing Fig. 3 and Fig. 4. Indeed, when we predict the traces of two families of dislocation walls, the polarity of these walls is higher than in the case where we can only identify a single family.
For the second studied crystal, the initial predicted orientation is (-57.5, 138.3, 35.6°). The model generates two pronounced families of dense walls, parallel to the crystallographic planes (101) and (011), in agreement with experimental observations (see Fig. 5). Contrary to the intragranular microstructure developed in the first crystal, the dislocation sheets predicted here are highly polarized. For this initial orientation, the crystal undergoes large rotations during plastic deformation, which promotes the
activation of several slip systems, leading to a higher polarized dislocation density for the families of walls. Note that our results are similar to those of Peeters et al. [10].
3.7.2. Bauschinger shear test
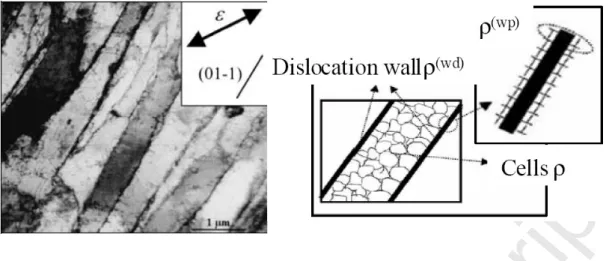
Fig. 6a shows a longitudinal plane view TEM micrograph of a (95.6, 124.3, 53.4°)-oriented grain in a specimen after a reverse shear test of -30%/30% with SD parallel to RD and SPN parallel to TD. A single family of dislocation walls is observed, lying parallel to the (1-10) crystallographic slip plane and roughly parallel to the macroscopic shearing direction.
Fig. 6b shows a longitudinal plane view TEM micrograph of a (43.8, 127.8, -42.4°)-oriented grain in a specimen after a reverse shear test of -30%/30% with SD parallel to RD and SPN parallel to TD. Two pronounced families of dislocation walls are clearly observed, parallel to the (011) and (10-1) crystallographic slip planes.
The model predictions in terms of the heterogeneous dislocation distribution in these crystals can be depicted using the intensity and the polarity of the dislocation walls as functions of the accumulated shear strain (see Figs. 7–8).
As previously, the families of dislocation sheets are correctly predicted for the two crystals (see Figs. 7–8).
According to the model, a crystal with an initial orientation of (92, 124.7, 55.7°) rotates during the 30%-preshear towards the orientation of (99.6, 126.9, 52°), then rotates, during the reverse shear, towards an orientation close to that experimentally observed (see the TEM micrograph of the crystal presented in Fig. 6a). In agreement
Accepted Manuscript
with the experimental observations, only one pronounced family of dense walls is predicted (see Fig. 7), parallel to the (1-10) crystallographic slip plane. Again, the model suggests a second family of walls, with much lower intensity, which is not observed experimentally. This is consistent with the results reported in [10], and is probably due to the phenomenon already described for simple shear. Since the predicted lattice rotation is larger than in [10], we find different initial orientations. The slight drop in immobile dislocation density stored in the family of walls parallel to the (1-10) crystallographic slip plane at the beginning of the reversal of simple shear (see Fig. 7), is due to those slip systems becoming active during the prestrain, but no longer remaining active immediately after the loading is reversed. This family of dislocation sheets cannot be currently generated - i.e., the family essentially becomes a previously generated wall - during certain deformation steps and will thus be slightly annihilated. Moreover, the activation of only one pronounced slip system leads to a low
directionally movable dislocation density (see Fig. 7).
For the second studied crystal, the predicted initial orientation is (43.3, 127.7, -42.8°). The model generates two pronounced families of dislocation sheets, parallel to the crystallographic slip planes (10-1) and (011), in agreement with experimental observations (see Fig. 8). During the prestrain, an intragranular substructure is
predicted, which consists of two families of dislocation sheets, parallel to the (011) and (10-1) crystallographic slip planes. The (10-1) family of walls becomes latent at 25% of shear strain due to an evolution of slip activity. After a sufficient amount of reverse shear strain, this family becomes currently generated and stores dislocations once again. At the end of the reverse test, the predicted dislocation distribution is in agreement with the TEM micrograph depicted in Fig. 6b. In contrast to the first crystal, several slip systems are active, which in turn leads to higher polarity (see Fig. 8). During load reversal, the excess of directionally movable dislocations accumulated at the boundaries of dense walls will move in the opposite direction and disintegrate with polarized dislocations of opposite sign. Consequently, the polarity associated with the two families of dense walls will decrease during the second loading stage, until possible opposite polarization is achieved (see Fig. 8).
3.7.3. Cross test
Fig. 9 shows a longitudinal plane view TEM micrograph of a (33.9, 55.9, 137.4°)-oriented grain in a specimen after a cross test, consisting of 10% tensile deformation in RD followed by 20% simple shear with SD parallel to RD and SPN parallel to TD. Two
Accepted Manuscript
families of dislocation walls can be observed in this grain, but only that parallel to the (011) crystallographic slip plane and the macroscopic shearing direction is clearly identifiable. The traces of a second family of walls, parallel to the (110) crystallographic slip plane, appear to be present as well.
The model predictions for the heterogeneous dislocation distribution in this crystal will be depicted by means of the intensity and the polarity of the dislocation walls as functions of the von Mises equivalent strain (see Fig. 10).
A crystal with a predicted initial orientation of (32.9, 55.9, 137.4°) will rotate
towards the orientation of (33.4, 55.9, 137°) during 10% uniaxial tension. A 20% simple shear loading allows us to obtain an orientation close to that experimentally observed (see the TEM micrograph of the crystal presented in Fig. 9). During uniaxial tensile prestrain, two families of dislocation sheets are predicted (see Fig. 10), parallel to the (110) and (01-1) crystallographic slip planes. The TEM micrograph, shown in Fig. 9, is not sufficient to determine which intragranular substructure was present before the simple shear test. However, it reveals the traces of certain dislocation walls parallel to the (110) crystallographic slip plane. Peeters and co-workers [10] also predicted two families of walls during prestrain, parallel to the (110) and (10-1) crystallographic planes. During the simple shear phase, a new microstructure, which consists of only one pronounced family of walls parallel to the (011) crystallographic plane, replaces the disintegrated former dislocation organization (see Fig. 10). This is in agreement with experimental observations.
3.8. Discussion
The proposed model has been validated on single crystals under different crystallographic orientations and for various loading conditions. These include monotonic tests, i.e., simple shear, as well as two-stage strain paths, i.e., Bauschinger shear tests and cross tests. The results from investigating the evolution of both the intensity and the polarity associated with the families of dislocation walls show that the intragranular substructures observed experimentally are accurately reproduced by our calculations. Although most of the literature results are recovered by the present model, the evolutions of some variables are sometimes found to be different from those
reported by Peeters et al. [10], but are still in agreement with experiments. These differences can very likely be attributed to the way in which we determine crystal rotation, which seems to produce larger rotations with our model.
Accepted Manuscript
4. Self-consistent scale-transition scheme
To derive the overall macroscopic behavior from knowledge of the behavior of individual grains, we adopt a self-consistent scheme. The main lines of the approach are recalled hereafter; the reader may refer to Refs. [16] and [27] for more details. The macroscopic constitutive law linking the macroscopic fields, i.e., the nominal stress rate
N and the macroscopic velocity gradient G, by means of the macroscopic tangent modulus L has the same incremental form as that of the single crystal (see Eq. (1)):
:
N L G . (28)
In a scale-transition scheme, the macroscopic tensor fields are defined as the volume averages of their microscopic counterparts, and they are related to each other by means of fourth-order concentration tensors A and B in order to solve the averaging problem:
: ,
:g x A x G n x B x N. (29)
This allows the macroscopic tangent modulus L to be given in a systematic manner:
1 : : V V dv
L l x A x l x A x . (30)For a polycrystalline aggregate composed of ellipsoidal crystals with different crystallographic orientations, the behavior and mechanical fields of each individual crystal are assumed to be homogeneous. Denoting by gI (respectively lI) the volume average of the velocity gradient (tangent modulus) for a grain I within the
polycrystalline aggregate, and using certain elaborate derivations making use of Green’s tensors [27], we show that the concentration tensor AI related to grain I is given by
1
1 1 : : : I II I II I A I T l L I T l L , (31)where TII is the interaction tensor for grain I , related to Eshelby’s tensor [28] for an
ellipsoidal inhomogeneity. For a polycrystalline aggregate comprising Ng grains of respective volume fraction f I, the one-site self-consistent expression corresponding to
the self-consistent scheme in the sense of Hill [29] can ultimately be obtained as
1 : Ng I I I I f
L l A . (32)Because morphological and crystallographic changes during loading are known to affect the slip activity processes, it is important to take these factors into consideration
Accepted Manuscript
for each crystal. The change of crystallographic orientation is induced by the elastic rotation rate we [16,23]. The Euler angles of a single crystal, which define the crystallographic orientation according to Bunge’s notation [30,31], evolve with the lattice spin we as described in Ref. [18]. For the morphology of the grain, the
morphological orientation evolves with the total rotation rate, and the associated Euler angles have similar evolution equations (see Ref. [18]). These angles define the orientation of the principal coordinate system of the ellipsoid representing the grain with respect to the coordinate system (RD, TD, ND) of the sample. Finally, the evolution of the shape of the grains taken as ellipsoids is due to the total deformation rate, and the evolution equations of the half-axes of the ellipsoid that represents the shape of the grain can be found in [18].
4.1. Simulation of the behavior of polycrystalline aggregates
In this section, the results obtained with the proposed model, henceforth referred to as "model 1", are compared with experimental data. We performed several sequential rheological tests for two steels, namely, a single-phase ferritic steel (IF-Ti) and a ferritic-martensitic dual-phase steel (DP). A necessary preliminary step consists of identifying the following material parameters for these steels:
The immobilization parameter I and the recovery parameter R are determined using a simple shear test.
The immobilization parameter Iwd and the recovery parameters Rwd and ncg
R are characterized based on two cross tests with different amounts of prestrain. The immobilization parameter Iwp and the recovery parameters Rwp,
rev
R , and
2
R are characterized based on two Bauschinger (reverse) shear tests with different amounts of prestrain.
The parameter values for these two steels are reported in Tables 3–4. It is important to note that in the case of the dual-phase steel, all the hardening parameters are taken to be identical for the two phases, except for the initial critical resolved shear stress. Indeed, since the strain hardening modes in martensite are not well known, this choice reduces the number of parameters that need to be identified.
In order to emphasize the impact of the intragranular substructure on the macroscopic behavior, the predictions of the developed model are compared to those obtained using a
Accepted Manuscript
simpler model, without elaborate microscopic modeling, referred to as "model 2"
[17,18]. The parameters for the latter model corresponding to the two investigated steels are listed in Tables 5–6.
Figs. 11–13 show comparisons between experimental data and results obtained with both models during monotonic and sequential loadings for IF-Ti steel and DP steel:
For uniaxial and plane tensile tests, the Cauchy stress component
11 is expressed as a function of the logarithmic strain component
11. For simple and Bauschinger shear tests, the Cauchy stress component
12 is plotted as a function of the shear strain component
2
12. For cross tests, the Cauchy stress component
11 is plotted as a function of the logarithmic strain component
11 during the prestrain. The Cauchy stress component
12 is then represented as a function of the shear strain component12
2
, augmented by the amount of prestrain. For biaxial expansion tests, the Cauchy stress components
11 and
22 are plotted as functions of the logarithmic strain components
11 and
22, respectively.For the IF-Ti steel, Fig. 11 shows that the two models are able to correctly reproduce the stress–strain behavior as far as monotonic loadings are concerned. For two-stage strain paths, however, it is clear that the refined description of the dislocation
arrangement significantly improves the prediction of the macroscopic
softening/hardening transient effects associated with sequential loadings. This also confirms that the intragranular microstructure produced along the first strain path leads to certain consequences that noticeably affect the macroscopic behavior during the subsequent loading sequences. For example, for a cross test, the prestrain-induced microstructure will serve as an obstacle to the dislocation motion on the planes of the new active slip systems and will cause a jump in stress response during the change in slip activity. Also, during a reverse test, strain-hardening stagnation will occur after the reversal of the strain path due to the remobilization of directionally movable
dislocations associated with dense walls and their interaction with the randomly distributed dislocations in the cell interiors.
Simple shear behavior is accurately reproduced with the present model, unlike the corresponding prediction obtained with the simpler model (model 2), which proves to
Accepted Manuscript
saturate too rapidly as the shear strain increases. The discrepancy between simulation and experiment in the context of uniaxial tension is slightly larger with the present model, but it remains quite reasonable on the whole. Note that the parameters for model 2 have been identified using the uniaxial tensile test, which may explain its better agreement with experimental data for this particular loading path. Plane tension is also better predicted using our new model. The intragranular substructure developed during this type of strain path is similar to that observed during simple shear or uniaxial tension. Considering these phenomena in the context of constitutive modeling seems to improve the results obtained with model 1 (see Fig. 11).
The most important improvements contributed by the current model correspond to the cross test; its predictions are in agreement with the experimental observations, while model 2 underestimates the cross effect. The prediction of this effect is noticeably improved through consideration of the heterogeneous dislocation distribution. The results for the Bauschinger tests are equally improved with regard to both the
Bauschinger effect level and the extent of strain-hardening stagnation. In contrast to the results obtained with model 2, the discrepancy between simulations and experiments with respect to the Bauschinger effect does not increase with the amount of prestrain when model 1 is used, although this effect still appears to be underestimated.
Furthermore, the transient strain-hardening stagnation is reproduced and seems to be well correlated with the amount of prestrain. Fig. 12 reveals that taking into account the heterogeneous dislocation distribution has little effect on the macroscopic behavior for this particular biaxial expansion test. This is probably due to the development during this test of the equiaxial cell structure with no clearly oriented walls.
Fig. 13 illustrates the same observations in the case of the DP steel. We draw very similar conclusions once again. In particular, it is clear that the softening/hardening transient effects can be accurately reproduced with our new model. Consideration of the intragranular microstructure improves the results considerably as compared to those predicted by model 2. It is worth noting that the agreement of model 1 with the experimental data is even better for this DP steel than for the above considered IF-Ti steel. This can be attributed in part to the less-pronounced effect of dislocation cells for the DP steel in comparison with the single-phase steel.
In summary, Figs. 11–13 confirm that the proposed model is capable of reproducing the main features of the elastic–plastic behavior of single-phase and dual-phase
Accepted Manuscript
5. Conclusions
In this paper, we proposed an advanced multiscale model with the intended purpose of accurately predicting the main features of the macroscopic stress–strain response for both single-phase and dual-phase steels in the context of changing strain paths. The key element of our formulation is the combination of modeling at the mesoscopic scale, which provides the local elastic–plastic constitutive law, with a careful microscopic description of the intragranular microstructure. This allows us to take into account the evolution of heterogeneous dislocation distribution during strain-path changes. The resulting local constitutive equations are then implemented into a large strain self-consistent scale-transition scheme to derive the macroscopic behavior of polycrystalline aggregates. The performance of this new extended multiscale model is assessed by investigating the impact of the microstructure induced in the context of monotonic and two-stage strain paths on the macroscopic hardening/softening transient effects of multiphase polycrystalline steels.
We first showed, through preliminary analyses on single crystals of IF-steel, that our new multiscale model can reproduce the substructure development observed in TEM micrographs after monotonic and sequential loadings for crystals with different initial crystallographic orientations. Comparisons with previously published constitutive models and experiments on crystals for various loading conditions, i.e., simple shear tests, Bauschinger shear tests, and cross tests, allowed us to validate our model at both micro- and mesoscopic scales. Furthermore, our investigation of the macroscopic stress–strain response of two different materials clearly demonstrates the ability of our integrated self-consistent model to reproduce the main macroscopic softening/hardening transient effects in the context of strain-path changes for both single-phase and dual-phase polycrystalline steels. Comparisons with experiments and with a simplified micromechanical model, which does not account for intragranular substructure description, emphasize the important role of the dislocation microstructure and the associated improvements in terms of prediction of both cross and Bauschinger effects.
Acknowledgements
This research has been performed within a project funded by ArcelorMittal Group. The authors are grateful to ArcelorMittal Research Division for financial support and for having provided experimental data.
Accepted Manuscript
References
[1] C. Teodosiu, Z. Hu, in: S.F. Shen, P.R. Dawson (Eds.), Simulation of Materials Processing: Theory, Methods and Applications (Proc. of Numiform’95), Balkema, Rotterdam, 1995, pp. 173–182.
[2] Z. Hu, E.F. Rauch, C. Teodosiu, Int. J. Plasticity 8 (1992) 839–856.
[3] S. Hiwatashi, A. Van Bael, P. Van Houtte, C. Teodosiu, Comp. Mat. Sci. 9 (1997) 274–284.
[4] P. Van Houtte, K. Mols, A. Van Bael, E. Aernoudt, Texture Microstructure 11 (1989) 23–39.
[5] D. Muller, X. Lemoine, M. Berveiller, J. Kratochvil, Solid State Phenom. 35-36 (1993) 393–398.
[6] X. Lemoine, M. Berveiller, D. Muller, Mater. Sci. Forum 157-162 (1994) 1821– 1826.
[7] L. Langlois, M. Berveiller, Int. J. Plasticity 19 (2003) 599–624.
[8] H. Mughrabi, in: O. Brulin, R.K.T. Hsieh (Eds.), Continuum Models of Discrete Systems 4, Stockholm, 1981, pp. 241–257.
[9] B. Peeters, M. Seefeldt, C. Teodosiu, S.R. Kalidindi, P. Van Houtte, E. Aernoudt, Acta Mater. 49 (2001) 1607–1619.
[10] B. Peeters, B. Bacroix, C. Teodosiu, P. Van Houtte, E. Aernoudt, Acta Mater. 49 (2001) 1621–1632.
[11] G.I. Taylor, J. Inst. Metals 62 (1938) 307–324.
[12] R.J. Asaro, J.R. Rice, J. Mech. Phys. Solids 25 (1977) 309–338. [13] R.J. Asaro, J. Appl. Mech. 50 (1983) 921–934.
[14] D. Peirce, J. Mech. Phys. Solids 31 (1983) 133–153.
[15] D. Pierce, R.J. Asaro, A. Needleman, Acta Metall. 31 (1983) 1951–1976. [16] T. Iwakuma, S. Nemat-Nasser, Proc. Roy. Soc. Lond. A 394 (1984) 87–119. [17] J.P. Lorrain, T. Ben Zineb, F. Abed-Meraim, M. Berveiller, Int. J. Form. Processes 8 (2005) 135–158.
Accepted Manuscript
[18] G. Franz, F. Abed-Meraim, J.P. Lorrain, T. Ben Zineb, X. Lemoine, M. Berveiller, Int. J. Plasticity 25 (2009) 205–238.
[19] P. Franciosi, A. Zaoui, Int. J. Plasticity 7 (1991) 295–311.
[20] A.S. Keh, S. Weissmann, in: G. Thomas, J. Washburn (Eds.), Electron Microscopy and Strength of Crystal, 1963, pp. 231–300.
[21] F. Ronde-Oustau, B. Baudelet, Acta Metall. 25 (1977) 1523–1529. [22] J.V. Fernandez, J.H. Schmitt, Philos. Mag. A 48 (1983) 841–870.
[23] E.V. Nesterova, B. Bacroix, C. Teodosiu, Metall. Mater. Trans. A 32 (2001) 2527– 2538.
[24] E.F. Rauch, J.H. Schmitt, Mater. Sci. Eng. A 113 (1989) 441–448.
[25] B. Peeters, S.R. Kalidindi, P. Van Houtte, E. Aernoudt, Acta Mater. 48 (2000) 2123–2133.
[26] U.F. Kocks, J. Eng. Mater. Technol. 98 (1976) 76–85.
[27] P. Lipinski, M. Berveiller, E. Reubrez, J. Morreale, Arch. Appl. Mech. 65 (1995) 291–311.
[28] J. Eshelby, Proc. Roy. Soc. Lond. A 241 (1957) 376–396. [29] R. Hill, J. Mech. Phys. Solids 13 (1965) 89–101.
[30] H.J. Bunge, Mathematische Methoden der Texturanalyse, Akademie-Verlag, Berlin, 1969.
Accepted Manuscript
Table captions
Table 1. Families of dislocation walls.
Table 2. Material model parameters, according to Peeters and co-workers [9,10]. Table 3. Identified parameters of model 1 for the IF-Ti steel.
Table 4. Identified parameters of model 1 for the DP steel. Table 5. Identified parameters of model 2 for the IF-Ti steel. Table 6. Identified parameters of model 2 for the DP steel.
Accepted Manuscript
Table 1
Families of dislocation walls.
active slip system direction family of walls [111] ou [11-1] (1-10) [111] ou [1-11] (10-1) [111] ou [-111] (01-1) [-111] ou [1-11] (110) [-111] ou [11-1] (101) [1-11] ou [11-1] (011)
Accepted Manuscript
Table 2
Material model parameters, according to Peeters and co-workers [9,10].
I R [m] Iwd Rwd[m] Iwp Rwp[m] 2.2 x10⁻² 8.5 x10⁻¹⁰ 9.4 x10⁻¹ 2.6 x10⁻⁸ 5 x10⁻² 3.8 x10⁻⁹
Rncg[m] Rrev[m] R2[m] f c0[110] [MPa] c0[112] [MPa]
Accepted Manuscript
Table 3
Identified parameters of model 1 for the IF-Ti steel.
I R [m] Iwd Rwd[m] Iwp Rwp[m] 4.5 x10⁻² 2.5 x10⁻⁹ 1.8 x10⁻¹ 2 x10⁻⁹ 4.5 x10⁻² 2 x 10⁻⁹
Rncg[m] Rrev[m] R2[m] f c0[110] [MPa] c0[112] [MPa]
Accepted Manuscript
Table 4
Identified parameters of model 1 for the DP steel.
Ferrite (900 crystallographic orientations)
I R [m] Iwd Rwd[m] Iwp Rwp[m] 4.4 x10⁻² 3 x10⁻⁹ 7.7 x 10⁻¹ 2.5 x10⁻⁹ 4.4 x10⁻² 2.5 x10⁻⁹
Rncg[m] Rrev[m] R2[m] f c0[110] [MPa] c0[112] [MPa]
5 x10⁻¹⁰ 1 x10⁻⁹ 1 x10⁻⁸ 0.2 180 180
Martensite (100 crystallographic orientations)
I R [m] Iwd Rwd[m] Iwp Rwp[m] 4.4 x10⁻² 3 x10⁻⁹ 7.7 x 10⁻¹ 2.5 x10⁻⁹ 4.4 x10⁻² 2.5 x10⁻⁹
Rncg[m] Rrev[m] R2[m] f c0[110] [MPa]
Accepted Manuscript
Table 5
Identified parameters of model 2 for the IF-Ti steel.
c0[110] [MPa] c0[112] [MPa] g0 yc[m] Dmoy[m]
Accepted Manuscript
Table 6
Identified parameters of model 2 for the DP steel.
Ferrite (900 crystallographic orientations)
c0[110] [MPa] c0[112] [MPa] g0 yc[m] Dmoy[m]
180 180 120 2.4 x10⁻⁹ 10 x10-6 Martensite (100 crystallographic orientations)
c0[110] [MPa] g0 yc[m] Dmoy[m]
Accepted Manuscript
Figure captions
Fig. 1. (a) Longitudinal plane view TEM micrograph of a grain in an IF-steel specimen
after 20% uniaxial tension in RD (after Peeters et al. [9]). (b) Schematic representation of the heterogeneous dislocation microstructure.
Fig. 2. Longitudinal plane view TEM micrographs (after Peeters et al. [10]): (a) of a
(-27.7, 133.5, 51.7°)-oriented grain in a 15% sheared specimen with SD parallel to RD and SPN parallel to TD, and (b) of a (-41.6, 135.2, 38.7°)-oriented grain in a 30% sheared specimen with SD parallel to RD and SPN parallel to TD.
Fig. 3. Evolution of the intensity and polarity of the dislocation sheets in a crystal with
initial orientation (-34.2, 135.7, 51.5°) during the simple shear test described in Fig. 2a.
Fig. 4. Evolution of the intensity and polarity of the dislocation sheets in a crystal with
initial orientation (-27.2, 133.4, 53°) during the simple shear test described in Fig. 2a.
Fig. 5. Evolution of the intensity and polarity of the dislocation sheets in a crystal with
initial orientation (-57.5, 138.3, 35.6°) during the simple shear test described in Fig. 2b.
Fig. 6. Longitudinal plane view TEM micrographs (after Peeters et al. [10]): (a) of a
(95.6, 124.3, 53.4°)-oriented grain in a specimen after a reverse shear test of -30%/30% with SD parallel to RD and SPN parallel to TD, and (b) of a (43.8, 127.8, -42.4°)-oriented grain in a specimen after a reverse shear test of -30%/30% with SD parallel to RD and SPN parallel to TD.
Fig. 7. Evolution of the intensity and polarity of the dislocation sheets in a crystal with
initial orientation (92, 124.7, 55.7°) during the reverse shear test described in Fig. 6a.
Fig. 8. Evolution of the intensity and polarity of the dislocation sheets in a crystal with
initial orientation (43.3, 127.7, -42.8°) during the reverse shear test described in Fig. 6b.
Fig. 9. Longitudinal plane view TEM micrograph of a (33.9, 55.9, 137.4°)-oriented
grain in a specimen after a cross test, consisting of 10% tensile deformation in RD followed by 20% simple shear with SD parallel to RD and SPN parallel to TD (after Peeters et al. [10]).
Fig. 10. Evolution of the intensity and polarity of the dislocation sheets in a crystal with
Accepted Manuscript
Fig. 11. Comparisons between models and experiments pertaining to the stress–strain
behavior of an IF-Ti steel for different strain paths performed perpendicular to RD (PT stands for plane tension, UT for uniaxial tension, SS for simple shear, BS for
Bauschinger shear tests at 10%, 20%, and 30% of shear prestrain, UT+SS for cross test).
Fig. 12. Comparisons between models and experiments for the stress–strain behavior of
an IF-Ti steel during biaxial expansion 1/4 (i.e., the prescribed stress component ratio is
22 11 4
), with direction 1 parallel to RD.
Fig. 13. Comparisons between models and experiments for the stress–strain behavior of
a DP steel during different strain paths performed perpendicular to RD (UT stands for uniaxial tension, SS for simple shear, BS for Bauschinger shear tests at 10%, 20%, and 30% of shear prestrain, UT+SS for cross test).
Accepted Manuscript
Fig. 1. (a) Longitudinal plane view TEM micrograph of a grain in an IF-steel specimen after
20% uniaxial tension in RD (after Peeters et al. [9]). (b) Schematic representation of the heterogeneous dislocation microstructure.
Accepted Manuscript
Fig. 2. Longitudinal plane view TEM micrographs (after Peeters et al. [10]): (a) of a (-27.7,
133.5, 51.7°)-oriented grain in a 15% sheared specimen with SD parallel to RD and SPN parallel to TD, and (b) of a (-41.6, 135.2, 38.7°)-oriented grain in a 30% sheared specimen with SD parallel to RD and SPN parallel to TD.
Accepted Manuscript
Fig. 3. Evolution of the intensity and polarity of the dislocation sheets in a crystal with initial
orientation (-34.2, 135.7, 51.5°) during the simple shear test described in Fig. 2a. Figure(s)
Accepted Manuscript
Fig. 4. Evolution of the intensity and polarity of the dislocation sheets in a crystal with initial
orientation (-27.2, 133.4, 53°) during the simple shear test described in Fig. 2a. Figure(s)
Accepted Manuscript
Fig. 5. Evolution of the intensity and polarity of the dislocation sheets in a crystal with initial
orientation (-57.5, 138.3, 35.6°) during the simple shear test described in Fig. 2b. Figure(s)
Accepted Manuscript
Fig. 6. Longitudinal plane view TEM micrographs (after Peeters et al. [10]): (a) of a (95.6,
124.3, 53.4°)-oriented grain in a specimen after a reverse shear test of -30%/30% with SD parallel to RD and SPN parallel to TD, and (b) of a (43.8, 127.8, -42.4°)-oriented grain in a specimen after a reverse shear test of -30%/30% with SD parallel to RD and SPN parallel to TD.
Accepted Manuscript
Fig. 7. Evolution of the intensity and polarity of the dislocation sheets in a crystal with initial
orientation (92, 124.7, 55.7°) during the reverse shear test described in Fig. 6a. Figure(s)
Accepted Manuscript
Fig. 8. Evolution of the intensity and polarity of the dislocation sheets in a crystal with initial
orientation (43.3, 127.7, -42.8°) during the reverse shear test described in Fig. 6b. Figure(s)
Accepted Manuscript
Fig. 9. Longitudinal plane view TEM micrograph of a (33.9, 55.9, 137.4°)-oriented grain in a
specimen after a cross test, consisting of 10% tensile deformation in RD followed by 20% simple shear with SD parallel to RD and SPN parallel to TD (after Peeters et al. [10]). Figure(s)
Accepted Manuscript
Fig. 10. Evolution of the intensity and polarity of the dislocation sheets in a crystal with initial
orientation (32.9, 55.9, 137.4°) during the cross test described in Fig. 9. Figure(s)
![Fig. 2. Longitudinal plane view TEM micrographs (after Peeters et al. [10]): (a) of a (-27.7, 133.5, 51.7°)-oriented grain in a 15% sheared specimen with SD parallel to RD and SPN parallel to TD, and (b) of a (-41.6, 135.2, 38.7°)-oriented grain in a 30%](https://thumb-eu.123doks.com/thumbv2/123doknet/7285397.207844/36.892.132.765.109.372/longitudinal-micrographs-peeters-oriented-specimen-parallel-parallel-oriented.webp)


![Fig. 6. Longitudinal plane view TEM micrographs (after Peeters et al. [10]): (a) of a (95.6, 124.3, 53.4°)-oriented grain in a specimen after a reverse shear test of -30%/30% with SD parallel to RD and SPN parallel to TD, and (b) of a (43.8, 127.8, -42.4](https://thumb-eu.123doks.com/thumbv2/123doknet/7285397.207844/40.892.132.759.105.363/longitudinal-micrographs-peeters-oriented-specimen-reverse-parallel-parallel.webp)