Science Arts & Métiers (SAM)
is an open access repository that collects the work of Arts et Métiers Institute of
Technology researchers and makes it freely available over the web where possible.
This is an author-deposited version published in: https://sam.ensam.eu Handle ID: .http://hdl.handle.net/10985/8921
To cite this version :
Nicolas MASLOV, David BROSSET, Christophe CLARAMUNT, JeanFrederic CHARPENTIER -A flexible decision-aid system for sites selection and technology options for a marine energy system - In: 3rd Renewable Power Generation (RPG) Conference 2014, Italy, 2014-09 - 3rd Renewable Power Generation (RPG) Conference 2014 - 2014
A flexible decision-aid system for sites selection and technology
options for a marine energy system
N. Maslov*, D. Brosset, C. Claramunt, J. F. Charpentier
Naval Academy Research Institute, Brest, France *Corresponding author: nicolas.maslov@ecole-navale.fr
Keywords: marine energy; GIS; multi-criteria analysis; site evaluation; decision-aid system.
Abstract
The aim of the paper is to introduce a flexible system whose objective is to help industrials and decision-makers to efficiently install a marine energy farm in a suitable area and to facilitate expertise between stakeholders. We introduced a three-step approach which allows to select marine farm sites and suitable technological solutions. The system developed is based on the combination of Geographic Information System (GIS), a multi-criteria analysis (MCA) process and an optimisation algorithm. The whole approach is illustrated by a case study applied to an installation of a set of tidal turbines in a maritime area in North West France.
1 Introduction
Oceans recover more than 70% of the earth surface and are known as a huge renewable energy source. Due to the desire to reduce fossil energy dependence for producing energy with a lower environmental impact and, to satisfy an increasing energy needs, the exploitation of ocean potentiality gained steadily a growing interest in the world energy market [1]. Various marine converters have been developed in order to produce energy from the different sources provide by oceans and seas. Whatever the source considered, wind, wave, tidal current or thermal and salinity gradient, the main goal, when a project is planned, is to extract more power of the resource while minimizing cost, environmental and social impact. Many factors/constraints have to be taken into account when a marine energy farm is planned to be installed, the objective of the approach presented in this paper is to facilitate interactions between engineers and decision-makers at the initial design level.
The developed decision-aid system allows to search for the best marine area, taking into account social acceptance, technology limitations and environment characteristics. The objective of this system is to identify the most pertinent technology and farm configuration for the most relevant site. In order to achieve this goal, a methodology based on the combination of Geographic Information System (GIS), a multi-criteria analysis (MCA) process and an optimisation algorithm is proposed.
The combination of GIS and MCA is mostly dedicated to the identification of the best location. The suitable site has to
minimize the geographical constraints. These constraints arise from the technological/cost limits and/or from the selected marine area. In particular, human activities are taken into account in order to reflect the social acceptance dimension. An optimization process evaluates the optimal farm configuration, adequate technologies and the main components of the design. We introduce an objective function which is composed by two criteria: quantity of produced energy in the system life and cost of the project. The optimisation process offers a set of options for the best technology choice and design.
Overall, the methodology integrates three criteria: the global cost of the project, quantity of energy produced and social acceptance. The developed model and system are modular and the principles behind can be extended to take into account additional criteria. The model developed so far considers the most relevant parameters identified, while decision-makers can also adjust the respective importance of the parameters identified according to their specific constraints and requirements.
The approach is currently oriented toward marine current turbine but the methodology can be extended to other marine energies. The approach might be for instance applied to offshore wind turbine with some adaptations.
The rest of the paper is organized as follows. Section 2 introduces the methodology developed, and the main criteria used by the approach. Section 3 develops the case study oriented to the installation of a set of tidal turbines. This case study is applied to the “Raz de Sein” zone, area located in the North West of France which is well-known for its high tidal current velocity. Finally section 4 concludes the paper and draws some perspectives
2 Methodology
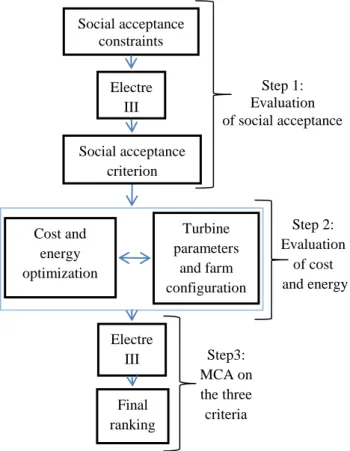
Many decision making approaches have been applied for renewable energy planning and MCA methods have proved their abilities to manage socio-economics scenarios [2]. The aim of the proposed approach is not only to find the best implantation site for marine energy farm, but also to suggest the most appropriate technologies for a given site in terms of cost and efficiency. The proposed approach combines GIS, MCA and an optimization algorithm. The methodology can be devised into three parts (Figure 1).
The MCA method retained is Electre III. Electre III has been chosen for its ability to solve ranking problems and its capacity to take into account the uncertain and imprecise component of user preferences using indifference and
preference thresholds (i.e., fuzzification of decision processes). Electre III first allows to rank different zones in a given area according to the social acceptance criterion. The optimization process is applied using a genetic algorithm that allows to evaluate the best cost and energy produced according to the converter and site characteristics. The choice of such algorithm is well adapted to solve optimization problems which provide relatively high number of variables and combinations [10]. Genetic algorithms have been already used for the design of wind turbine [9]. Finally, the MCA algorithm of Electre III is again applied for the final ranking that takes into account the criteria identified.
Figure 1: Methodology principles. 2.1 Social acceptance evaluation (step 1)
The insertion of a new maritime activity in a regulated space can generate conflicts with other uses. Overall, socio-ecological constraints are complex, heterogeneous, dynamic and prone to nonlinear and often abrupt changes [3]. The potential sources of conflicts are principally other human activities which can generate a spatial/temporal overlap. They include many different classes of activity (Figure 2). These possible sources of conflict are grouped under the criteria of social acceptance which is in fact a general constraint to take into account not only at sea for many engineering projects. Regarding marine renewable energy, the conflicts of interest often identified concern maritime routes, natural protected and fishing areas, military zones. Some areas such as major ship lanes, pipelines, and cable routes can be excluded from consideration as they constitute prohibited area [4]. The
assumption made by our method is that these main constraining activities can act as a preliminary filter of the site search. Other activities may be considered as more flexible in the sense that degrees of freedom exist for a potential overlap with renewable energy. The overlap of all the constraint maps allows to spatially distribute the study area into sub-areas [5]. The aggregation method Electre III [6] is used to rank these sub-areas according to the preference given to each constraint. The rank value describes the degree of social acceptance for each of these sub-areas
Figure 2: Sea activities.
2.2 Cost and energy produced evaluation (step 2)
Two models have been developed for the evaluation of the total cost and the quantity of produced energy. These models integrate several components resulting from current research and technological advances with a degree of accuracy suitable for the integration of these parameters in the optimization process.
The energy assessment model is first composed by an estimated resource model that depends on the location. For marine current turbine, the current velocity can be predicted for each hour thanks to the model developed by the French National Hydrography and Oceanographic Service (SHOM) [7]. A relation that depends on the tidal coefficient and the hourly velocity at neap and spring tides evaluates the current velocity for a given place.
The energy model is completed in a second step by the integration of a performance model. This model takes into account the efficiency of the marine converter components related to the technology choice, and an estimation of the system downtimes which is based on the downtime statistical rates of each components of the whole energy chain. The main components taken into account by this approach are: the turbine, gearbox, generator, power converter and transmission. The choice of technology focuses on the type of turbine (horizontal or vertical axis turbine, with or without yaw system and pitch control), gearbox or direct drive transmission, generator/converter type (PMSG, DFIG). The cost model takes into account the farm cost and the cost of installation/dismantling and maintenance operations. These costs depend on the farm configuration (technology used, Electre III Final ranking
Step3: MCA on the three criteria Cost and energy optimization Turbine parameters and farm configuration Social acceptance criterion Electre III Social acceptance constraints Step 2: Evaluation of cost and energy criteria Step 1: Evaluation of social acceptance
number of machines, converter design) and on the geographic location (depth, distance from ports and networks). For maintenance cost evaluation, a model based on a statistical breakdown of components (which depend on technological choice) is proposed [8].The optimization of the marine turbine is performed using a genetic algorithm. Pareto frontier is also used to order the set of the solutions corresponding to the two objective functions, energy produced and cost. 2.3 Criteria ranking (step 3)
Cost, energy produced and social acceptance are the three final criteria considered by the decision-aid process. The multi-criteria analysis method, Electre III, is applied to this step. Electre III takes into account decision-makers preferences using a weighting process, preference and indifference thresholds. The objective of the values given to the weights applied to the different criteria is to decrease the number of technological choices.
3 Case study
Two places in the the Iroise Sea, North West of France, are well-known for their high marine current velocity, “Raz de Sein” and “Fromveur pass” near the Ouessant Island. The case study considers a planning process of marine current turbines installation in the “Raz de Sein area”. This location is located between the Sein Island and “Pointe du Raz”. Figure 3 shows these locations where current velocity surveys were carried out and the velocity is higher than 1 ms−1 at least during 30% of the time for a given year.
As for many areas close to the cost, this location is subject to high-density human activities, and particularly for fishing activities. In order to find the most appropriate areas that minimize the conflicts that might arise between sea users, the first step of the application of our modeling approach is to classify the study area in different zones according to the social acceptance criteria.
3.1. Social acceptance evaluation using Electre III
In order to evaluate the social acceptance criteria, a strategy similar to the one proposed by [5] is applied to this case study. The geographical constraints are restricted to professional fishery activities, which are the principal human activity in the “Raz de Sein”. Different kinds of fishery practices have been identified through regulations and seabed properties [11]. Even if these locations are approximated, as they do not take into account the time/seasonal dimension of some fishery activities, they give some useful information on the geographical breakdown of these activities. In this example, different fishery activities maps have been overlapped, as illustrated in Figure 4. In particular, four categories outline four different classes of constraints: longlines and floating lines, net, trawling and dredge, and ground line fishery activities areas.
Figure 3: Study area.
Figure 4: Example of fishery activities map: floating line areas.
At this step, the study area is spatially dsitributed in several sub-areas characterised by several constraint values corresponding to the different fishery activities. Using Electre III, an aggregation of these constraint values is performed. Applying the Electre III process, different parameters can be adapted by the decision-makers as well as the weight given to different fishery activities. The outcome of the ranking defined according to the social acceptance areas of the four overlapped constraints is shown by Figure 5.
Figure 5: Classification according to fishing activities. 3.2 Cost and energy estimation
The study area is, at this step, spatially distributed into several zones which are characterized by a social acceptance value (i.e., their rank). Prior to the application of the optimization process, an intermediate step is performed. This consists in generating a map derived from an overlay of the social acceptance map with other geographical constraints which are involved in the estimation of the cost and energy. These additional constraints include for instance the bathymetry, marine currents values or seafloor geological characteristics. In the specific case of this study, the bathymetry and current areas overlap the social acceptance map, that is, the combination of these maritime and social maps ranks the regions considered. Figure 6 presents the ranking of the sub-areas in the region considered, and where sub-sub-areas with lower depths have not been taken into account.
Figure 6: Final ranking.
Overall, the final map generates 180 sub-areas. At this step, the study area is aggregated into homogenous part taking into account the geographical constraints. These constraints are the social acceptance criteria and the two parameters involved in the estimation of the cost and energy produced (i.e., bathymetry and current location). These zones are considered as potential sites to receive turbines. In order to evaluate the cost and energy produced, some additional characteristics are attached to each sub-area: their area, distance to the harbor (Brest) and distance to the electric grid. The area parameter
NTmax evaluates the maximum number of turbines which can
be installed per sub-area. This measure depends on the turbine radius R. The maximal radius for a turbine Rmax is evaluated
as a function depending of the depth and surface and bottom margin, that is, 2 Rmax≤ depth-margins. For instance, a top
margin of 5m is suggested in order to allow small boat navigation and to minimize turbulence and swell effects. Bottom clearance of 5m is recommended as a minimum height to avoid damage by materials moving at the seabed and to minimize the hydrodynamic effects related to the boundary layer [12].
Once all installation parameters are defined, the optimization process is performed and the genetic algorithm is applied. As previously mentioned, the evaluation of the energy produced and cost of the system are based on the performance of the extracting system depending of the design, choice of components and technologies used. In the approach developed, the following parameters and their corresponding variation domain and variation steps have been retained for the optimization process:
- the turbine considered types (TT) are: vertical axis (VA), horizontal axis (HA) with or without yaw.
- the rotor radius (R) varies between 2.5 m and Rmax with a
step of 0.5 m.
- the drive train configuration (DT) can be: Direct-drive PMSG or DFIG + gearbox
- the rating power (Pn) of DT varies from 0.1 to 3 MW with a step of 0.1 MW
- the number of turbines (NT) varies from one to NTmax
The turbine type parameter has been introduced in order to fully harness marine current depending of its orientation distribution in a given location. In this approach, for a VA turbine, the turbine capture angle is estimated to 20 degrees and its power coefficient is evaluated to 0.45. The capture angle is defined as the angle of cone centered in the turbine axis within which the current can be harnessed. For an HA turbine, the capture angle and the power coefficient are respectively fixed to 360 degrees and 0.35. That means that in the case of the HA turbine, a requirement is to find the best orientation along the main direction when the turbine is installed. The yaw system proposed for the HA turbine can solve this problem, but implies an increase of project cost due to the component and maintenance costs, and the risk of a higher failure rate.
For the drive train associations (DT), two solutions are considered. These different associations are proposed in order to illustrate the compromise between a robust expensive generator/power electronics system (PMSG) and a cheaper
one which needs more maintenance (DFIG). In the case study, the proposed options are: 1) Full power IGBT back to back converter with PMSG and 2) DFIG system where the cost of the power electronics is strongly reduced (converter is only sized to 1/3 of Pn), but that needs a gearbox which is one of the components having the highest failure probability and which needs a high level of maintenance.
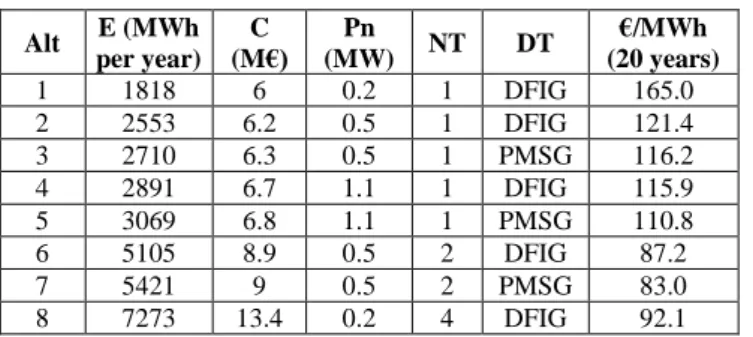
An illustration of some of the results provided by the genetic algorithm is given by Table 1. These results correspond to a sub-area which the current distribution is shown in Figure 7. This potential zone is characterized by an area of 125,880 m2 and a mean depth of 32 m. The distance of this zone from Brest harbor and from the fictive grid connection point are 47 km and 11 km, respectively. Alt E (MWh per year) C (M€) Pn (MW) NT DT €/MWh (20 years) 1 1818 6 0.2 1 DFIG 165.0 2 2553 6.2 0.5 1 DFIG 121.4 3 2710 6.3 0.5 1 PMSG 116.2 4 2891 6.7 1.1 1 DFIG 115.9 5 3069 6.8 1.1 1 PMSG 110.8 6 5105 8.9 0.5 2 DFIG 87.2 7 5421 9 0.5 2 PMSG 83.0 8 7273 13.4 0.2 4 DFIG 92.1
Table 1: Results of the genetic algorithm optimization. Alternative (Alt); energy produced (E), cost (C), nominal power (Pn).
All the alternatives given by the genetic algorithm are solutions based on HA turbines with a radius of 11 m. The choice of the HA turbine can be easily explained by the relative symmetric distribution of the current in this area. Due to a depth of 32m and the two margins (top and bottom) of 5m taken into account, it appears that the rotor radius tends to take the entire space allocated. It can be also observed that the cost of the energy decreases when the number of turbines increases, due to equipment sharing effects.
Figure 7: Current distribution.
3.3 Ranking according to the three criteria
At this step the genetic algorithm has provided, for each sub-area, a set of turbine solutions that can be considered as alternatives. This process has generated 2,265 possible solutions for 180 sub-areas. Each of these alternatives is characterized by its produced energy, its cost and the social acceptance level of the area to which it belongs.
Electre III is used again, and applied to the three criteria characterizing the alternatives. The different parameters used by the MCA are shown in Table 2. The importance according to each criteria is associated to a weight chosen by the decision-maker. In this case, low-cost alternatives have been preferred, by grading the highest weight to the cost criterion. In Electre III, the fuzzy dimension of a decision-based process is introduced using different thresholds (i.e., indifference, preference and veto). These thresholds are used to compare for each criterion each pair of alternatives. For instance, if the energy indifference threshold is fixed to 10 MWh; this roughly corresponds to the annual energy needed by a 70 m2 house. That means that if, the difference of the energy is less than 10 MWh, these two alternatives are considered as equivalent under this criterion. If the energy preference threshold is fixed to 300 MWh, that means that if the difference of the energy is higher than 300 MWh for these two alternatives, one alternative is strongly preferred to the other one under this criterion. Moreover, when the difference between these two alternatives under one criterion is between the indifference and preference thresholds, a linear interpolation is performed.
The veto threshold insures that a very bad performance of one criterion is not compensated by good performance of another criteria.
constraints Weight Preference threshold Preference threshold Veto threshold Energy 1 10 MWh 300 MWh 3000 MWh Cost 3 0 0.1 (M€) 1 (M€) Acceptance 1 0 1 3
Table 2: Parameter values for the MCA.
Using Electre III, the 2265 possible alternatives are ranked from 1 to 1376. For a given sub-area, the best alternative is the one having the lowest rank among the alternatives belonging to the same zone. Figure 8 illustrates the classification of the study areas, according to each best alternative, based on the three criteria considered. In Figure 8, the four most suitable areas are labelled by a letter from A to
D (A being the best one). The characteristics of the best
alternatives and their ranks are given in Table 3. For the second best zone, namely B, the best alternative is ranked as the third. This means that A contains the second ranked alternative. A similar observation can be formulated for C. A gap of three ranks exists between B and C. That means that there are two alternatives belonging to A or B that can be taken into consideration before considering the best alternative of the zone C.
SA Rank E (MWh per year) C (M€) Pn (MW) NT/NT max R (m) TT A 1 2710 6.3 0.5 1/5 11 HA B 3 2860 6.5 1.1 1/4 11 HA+yaw C 6 7426 11.9 0.6 3/10 12 HA D 7 3221 7.3 2.1 1/7 11 HA+yaw
Table 3: areas ranking and turbine characteristics. Sub-area (SA); energy produced (E), cost (C), nominal power (Pn).
Figure 8: Final ranking.
4 Conclusion
This paper introduces an approach whose objective is to find the most suitable sites and marine farm preliminary design. The system developed integrates GIS, multi-criteria analysis and an optimization algorithm to build a decision-aid tool dedicated to decision-makers and stakeholders. The proposed method ranks a whole region into different homogenous sub-areas taking into account several physical, geographical and social constraints. In the case study developed, a set of optimal technological solutions has been explored for each sub-area, and a ranking associated to the best solution according to the three criteria has been performed. For illustration purposes, a scenario giving the priority to a low-cost project has been chosen. But, thanks to its modularity, the method developed can be adapted to other scenarios in order to reflect decision-makers’ choices.
Three criteria have been modeled and taken into consideration in the decision process developed. These criteria can be improved in different ways. First, the location of the turbines into each sub-area is a direction to explore in order to present an optimal layout increasing the efficiency of the marine farm. Secondly, the social acceptance has been currently restricted to fishery activities, but other human activities may
also raise conflicts. Water-based activities and ship corridors are examples that can lead to a more precise segmentation of the whole area. For all of these activities, a model including the seasonal variation can enrich the whole approach. Thirdly, the cost estimation is currently based on the extrapolation of offshore wind turbine current technological knowledge. Therefore, the parameters used in the model can also be modified to reflect the technological evolution of marine current turbines. Other criteria, such as environmental constraints are still to be considered in further work.
References
[1] D. L. O'Sullivan, W. L. Anthony Lewis. “Generator selection and comparative performance in offshore oscillating water column ocean wave energy converters”, Energy Conversion, IEEE Transactions, 26, pp 603-614, (2011).
[2] S. D. Pohekar, M. Ramachandran. Application of multi-criteria decision making to sustainable energy planning—a review. Renewable and Sustainable Energy
Reviews, 8, pp. 365-381, (2004).
[3] O.R. Young, et al. McLeod, Solving the crisis in ocean governance: Place-based management of marine ecosystems. Environ. Sci. Policy Sustain. Dev., 49, pp. 20–32, (2007).
[4] A. Henderson. Offshore Wind Energy—Ready to Power a Sustainable Europe. EU Concerted Action on Offshore Wind Energy in Europe, 2001.
[5] S. Chakhar. Cartographie Décisionnelle Multicritère: Formalisation et Implémentation Informatique. Ph.D. Thesis, University of Paris Dauphine, Paris, France, (2006).
[6] B. Roy. ELECTRE III: Un algorithme de classements fondé sur une représentation floue des préférences en présence de criteres multiples. Cahiers du CERO, 20, pp. 3–24, (1978).
[7] S. Benelghali, M.E.H. Benbouzid, J.F. Charpentier. Comparison of PMSG and DFIG for Marine Current Turbine Applications. In Proceedings of the 2010 XIX International Conference on Electrical Machines, (2010).
[8] J. Ribrant, L. Bertling. Survey of failures in wind power systems with focus on Swedish wind power plants during 1997-2005. Power Engineering Society General Meeting, IEEE, pp. 1–8, (2007).
[9] T. Diveux, P. Sebastian, D. Bernard, J.R. Puiggali, J.Y. Grandidier. Horizontal axis wind turbine systems: Optimization using genetic algorithms. Wind Energy, 4, pp. 151–171, (2001).
[10] D.T. Pham, P.T.N. Pham. Artificial intelligence in engineering. Int. J. Mach. Tools Manuf. 1999, 39, 937– 949.
[11] M. Le Tixerant, F. Gourmelon, C. Tissot, D. Brosset. Modelling of human activity development in coastal sea areas. J. Coast. Conserv., 15, pp. 407–416, (2011). [12] C. Legrand. Assessment of Tidal Energy Resource:
Marine Renewable Energy Guides; European Marine