What CoRoT tells us about
δ
Scuti stars
Existence of a regular pattern and seismic indices to characterize stars
Eric Michel1, , Marc-Antoine Dupret2, Daniel Reese1, Rhita-Maria Ouazzani3, Jonas Debosscher4, Antonio García Hernández5,6, Kevin Belkacem1, Reza Samadi1, Sébastien Salmon2, Juan Carlos Suarez6, and Sebastia Barceló Forteza7,8
1Observatoire de Paris, LESIA, UMR8109, Université Pierre et Marie Curie, Université Paris Diderot, PSL 2Institut d’Astrophysique et Geophysique, University of Liège, Belgium
3Stellar Astrophysics Centre, Department of Physics and Astronomy, Aarhus University, Ny Munkegade 120, DK-8000 Aarhus C, Denmark
4Instituut voor Sterrenkunde, KU Leuven, Celestijnenlaan 200B, 3001, Leuven, Belgium
5Instituto de Astrofísica e Ciências do Espaço, Universidade do Porto, CAUP, Rua das Estrelas, PT4150-762 Porto, Portugal 6Dept. Física Teórica y del Cosmos. University of Granada. 18071. Granada, Spain
7Instituto de Astrofísica de Canarias, 38200 La Laguna, Tenerife, Spain
8Departamento de Astrofísica, Universidad de La Laguna, 38206 La Laguna, Tenerife, Spain
Abstract. Inspired by the so appealing example of red giants, where going from a handful of stars to thousands revealed the structure of the eigenspectrum, we inspected a large homogeneous set of around 1860 δ Scuti stars observed with CoRoT. This unique data set reveals a common regular pattern which appears to be in agreement with island modes featured by theoretical non-perturbative treatments of fast rotation. The comparison of these data with models and linear stability calculations suggests that spectra can be fruitfully characterized to first order by a few parameters which might play the role of seismic indices for δ Scuti stars, as ∆ν and νmaxdo for
red giants. The existence of this pattern offers an observational support for guiding further theoretical works on fast rotation. It also provides a framework for further investigation of the observational material collected by CoRoT ([1]) and Kepler ([2]). Finally, it sketches out the perspective of using δ Scuti stars pulsations for ensemble asteroseismology.
1 Introduction
δScuti stars constitute a large class of pulsating stars rep-resentative of chemically normal intermediate mass stars on and near the main sequence (see eg [3], [4]). Their seismic exploitation however meets major difficulties of-ten refered to as ’the mode identification problem’, ’the fast rotation treatment’, and ’the selection effects’. These various expressions refer to two main difficulties. First, δScuti stars, as chemically normal A and early F stars are characterized by a large rotation rate ([5]) and the theo-retical modelling of their pulsation spectra cannot rely on classical perturbative approaches ([6],[7]). Then, although we understand the process responsible for their pulsational instability, we have very little insight about the process re-sponsible for the amplitude limitation (see however recent studies by [8] and [9]) and thus no clue about how am-plitudes are distributed between modes and for different stars.
However, we do know a couple of things about these stars. First, there is increasing evidence that periodicities or regular spacings can be found in δ Scuti spectra ([10],
e-mail: Eric.Michelatobspm.fr
[11], [12]) and recently, [13] demonstrated that this spac-ing is a good proxy of the mean density just as the large separation ∆ν is for solar-like pulsators.
Then, linear stability calculations provide reliable re-sults ([14]) and it is appealing to use them to characterize stars in terms of mass range or evolution stage (see e.g. [15] for stars in clusters and [16] in the case of pre-main sequence δ Scuti stars).
In the present paper, we use a large set of homoge-neous spectra observed with CoRoT ([17]) to revisit these questions and see what CoRoT data tell us about δ Scuti stars.
2 The observational sample and the
determination of f
min, f
maxand a
max.
The automated supervised classification of variable stars in the CoRoT programme (ASCVC hereafter, [18]) brings about 1860 objects classified as δ Scuti stars with a prob-ability higher than 80%. In comparison, catalogues be-fore the space-photometry era gathered about 700 objects ([19]), among which a large fraction had been discovered by large surveys like the Hipparcos ([20]), OGLE ([21])and MACHO ([22]) projects. The present CoRoT sample is thus very valuable in terms of number of objects and also in terms of homogeneity.
We computed the Fourier spectrum for each of these light-curves and we set to zero-amplitude the parts of the spectra possibly hampered by intrumental/environmental artefacts induced by the orbital period (see [23]). It con-sists in narrow intervals around the frequency of the orbital period plus its harmonics, each of them associated with a few daily aliases as it can be seen in figure6. For each spectrum, we also exclude from our study the part below fLcut = 25 µHz (also set to zero-amplitude) in order to
avoid the influence on our analysis of possible power of instrumental or environmental origin at low frequency.
We define a limit amplitude criterion for peaks to be considered. Here we take the maximum between 10 times the mean amplitude level and the amplitude of the highest peak divided by 8. This last constraint aims at avoiding artefacts of large amplitude peaks convolved by the obser-vational window.
Then, we determine for each spectrum the range of detected signal, noted [ fmin,fmax], as the frequency range
encompassing all peaks satisfying the previous amplitude criterion.
We also use these spectra to produce an index charac-terizing the amplitude of the oscillations. We considered two versions of this index. One is simply the amplitude of the highest peak. The second is the square root of the quadratic sum of amplitudes of all peaks satisfying our amplitude criterion. Interestingly, the results were found to vary at most by a factor two from one version to the other. In the present work, all results for amaxrefer to the
square root of the quadratic sum, which we expect to be more stable a measurement and more representative of the energy involved in pulsation.
The results are presented in figure 1 and their inter-pretation in the light of theoretical models is discussed in Sect.4.
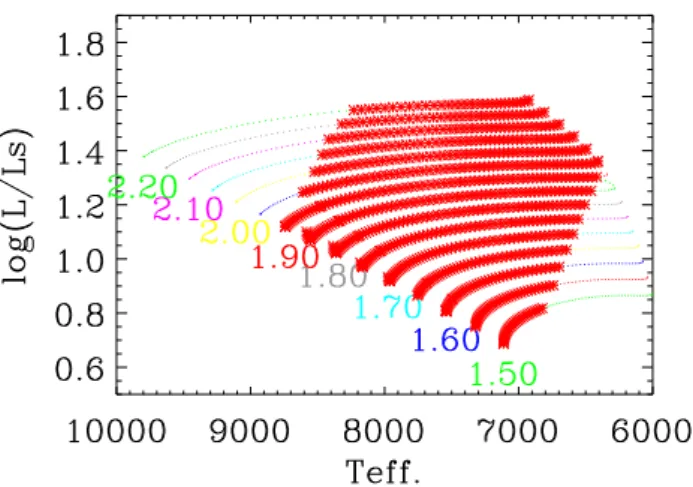
Figure 1: Diagram fmin_ fmaxfor the set of CoRoT stars described
in the text. Oblique lines indicate equal frequency width fmax− fmin. The values mentioned on the y-axis indicate both the fmax
value for a horizontal line and the fmax− fminwidth for an oblique
line. Values of amaxare given by the colour code.
3 Theoretical estimates of f
minand f
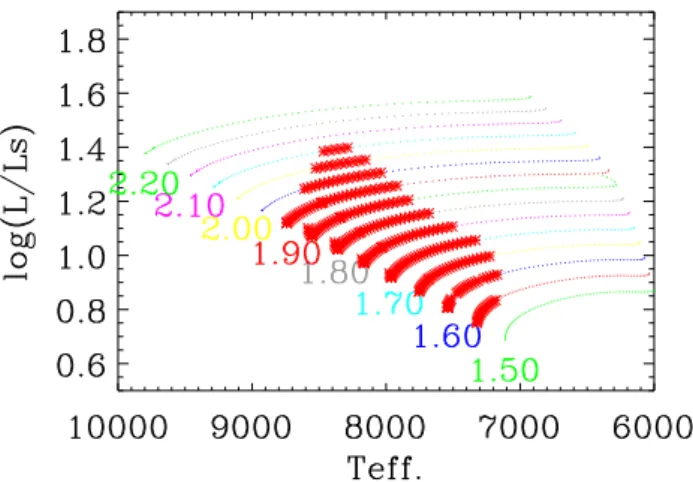
max We used a grid of theoretical models representative of the whole δ Scuti stars instability strip for the main sequence evolution stage (see figure 2). This grid is the one used and described in [14]. The models have been computed with the code CLES ([24]). The physics of the models is standard and the only specific aspects of interest at the level of the present study are: the use of overshooting with αov = 0.2Hpand the mixing length parameter which hasbeen set to the solar calibrated value 1.8. The metallic-ity (Z=0.02) had been chosen as representative of the so-lar one in [14]. Here again, the change for a more up-to-date value would not change significantly our results. The linear stability of the modes has been obtained following ([14], [25]).
Figure 2: Hertzsprung-Russell diagram featuring models de-scribed in the text. Models showing at least one unstable mode are marked by red star symbols delimiting the theoretical insta-bility strip. For each sequence, mass is indicated in solar units.
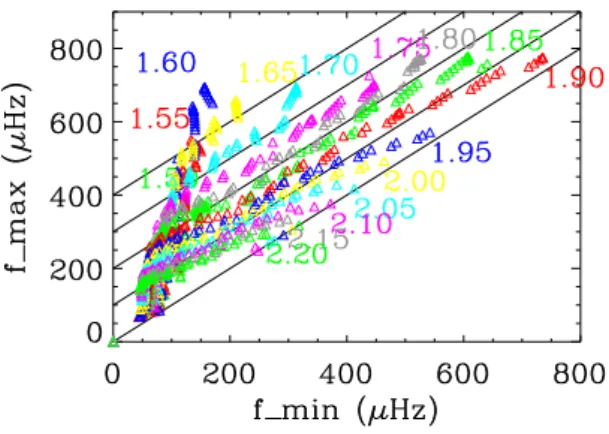
These linear stability calculations are used to derive theoretical counterparts of the fmin and fmax values
ob-tained for observed stars in Sect. 2. They have been de-termined on modes of degree l = 0, 1, 2 and are illustrated in figure3.
When looking at figure3, it is clear that, for sequence of models of given mass, the position in the fmin_ fmax
di-agram changes under two effects. One is the decrease of mean density (or the decrease of ∆ν0∝ (GM/R3)1/2) with
evolution. The second is associated with the gradual de-crease of the radial orders of unstable modes, as the star crosses the instability strip from the blue to the red border, as described in Ref Dupret 2004. Both effects globally induce a decrease of fmin and fmax with age on the main
sequence.
It is also worth noticing that, evolution sequences en-tering the instability strip through the so-called blue bor-der (i.e. masses higher than 1.9M ) correspond, in the
fmin_ fmax diagram, to sequences starting on the ( fmin =
fmax) central axis, i.e. with a very narrow frequency range
of unstable modes.
On the contrary, evolution sequences starting on the ZAMS in the instability strip (i.e. masses between 1.5 and
and MACHO ([22]) projects. The present CoRoT sample is thus very valuable in terms of number of objects and also in terms of homogeneity.
We computed the Fourier spectrum for each of these light-curves and we set to zero-amplitude the parts of the spectra possibly hampered by intrumental/environmental artefacts induced by the orbital period (see [23]). It con-sists in narrow intervals around the frequency of the orbital period plus its harmonics, each of them associated with a few daily aliases as it can be seen in figure6. For each spectrum, we also exclude from our study the part below fLcut = 25 µHz (also set to zero-amplitude) in order to
avoid the influence on our analysis of possible power of instrumental or environmental origin at low frequency.
We define a limit amplitude criterion for peaks to be considered. Here we take the maximum between 10 times the mean amplitude level and the amplitude of the highest peak divided by 8. This last constraint aims at avoiding artefacts of large amplitude peaks convolved by the obser-vational window.
Then, we determine for each spectrum the range of detected signal, noted [ fmin,fmax], as the frequency range
encompassing all peaks satisfying the previous amplitude criterion.
We also use these spectra to produce an index charac-terizing the amplitude of the oscillations. We considered two versions of this index. One is simply the amplitude of the highest peak. The second is the square root of the quadratic sum of amplitudes of all peaks satisfying our amplitude criterion. Interestingly, the results were found to vary at most by a factor two from one version to the other. In the present work, all results for amaxrefer to the
square root of the quadratic sum, which we expect to be more stable a measurement and more representative of the energy involved in pulsation.
The results are presented in figure1 and their inter-pretation in the light of theoretical models is discussed in Sect.4.
Figure 1: Diagram fmin_ fmaxfor the set of CoRoT stars described
in the text. Oblique lines indicate equal frequency width fmax− fmin. The values mentioned on the y-axis indicate both the fmax
value for a horizontal line and the fmax− fminwidth for an oblique
line. Values of amaxare given by the colour code.
3 Theoretical estimates of f
minand f
max We used a grid of theoretical models representative of the whole δ Scuti stars instability strip for the main sequence evolution stage (see figure 2). This grid is the one used and described in [14]. The models have been computed with the code CLES ([24]). The physics of the models is standard and the only specific aspects of interest at the level of the present study are: the use of overshooting with αov = 0.2Hpand the mixing length parameter which hasbeen set to the solar calibrated value 1.8. The metallic-ity (Z=0.02) had been chosen as representative of the so-lar one in [14]. Here again, the change for a more up-to-date value would not change significantly our results. The linear stability of the modes has been obtained following ([14], [25]).
Figure 2: Hertzsprung-Russell diagram featuring models de-scribed in the text. Models showing at least one unstable mode are marked by red star symbols delimiting the theoretical insta-bility strip. For each sequence, mass is indicated in solar units.
These linear stability calculations are used to derive theoretical counterparts of the fmin and fmax values
ob-tained for observed stars in Sect. 2. They have been de-termined on modes of degree l = 0, 1, 2 and are illustrated in figure3.
When looking at figure3, it is clear that, for sequence of models of given mass, the position in the fmin_ fmax
di-agram changes under two effects. One is the decrease of mean density (or the decrease of ∆ν0∝ (GM/R3)1/2) with
evolution. The second is associated with the gradual de-crease of the radial orders of unstable modes, as the star crosses the instability strip from the blue to the red border, as described in Ref Dupret 2004. Both effects globally induce a decrease of fmin and fmaxwith age on the main
sequence.
It is also worth noticing that, evolution sequences en-tering the instability strip through the so-called blue bor-der (i.e. masses higher than 1.9M ) correspond, in the
fmin_ fmax diagram, to sequences starting on the ( fmin =
fmax) central axis, i.e. with a very narrow frequency range
of unstable modes.
On the contrary, evolution sequences starting on the ZAMS in the instability strip (i.e. masses between 1.5 and
Figure 3: Diagram fmin_ fmax, as in figure1, but for sequences
of models illustrated in figure2and described in the text. The colours stand for sequences of models of a given mass.
1.9M ) correspond, in the fmin_ fmaxdiagram, to sequences
starting at high fmax− fmin values, i.e. with a larger
fre-quency range of unstable modes and thus farther from the ( fmin =fmax) central axis.
Finally, we can also notice that, with the evolution, all sequences tend to converge at low fminand fmaxin the
di-agram, those going out of the instability strip through the red border corresponding to sequences terminating on the ( fmin =fmax) central axis.
We take as a work hypothesis that the rotation will not impact drastically these theoretical estimates of fmin and
fmaxvalues. Rotational splitting is expected to extend the
observed range of observed peaks by an amount which is difficult to estimate precisely in the present state of our knowledge, but should be, in the worst case, of the order of a few times the rotation frequency, i.e. a few times 10 to 20 µHz for the fastest rotating objects. This is not negli-gible, but if this extension remains below 50 µHz for most of the stars, the fmin_ fmaxdiagram remains discriminent in
terms of evolution stage and mass range, as can be seen in figure3.
4 Comparison of observational and
theoretical f
min_ f
maxdiagrams
When comparing figure1and figure3in the light of pre-vious remarks, we notice a few differences and similari-ties. The set of observed stars shows components in the fmin_ fmax diagram which are not present for the models.
The main difference consists in a vertival ridge observed at low fmin (below 50 µHz) in figure1. This
accumula-tion ridge could be due to an edge effect induced by the processing of spectra described in Sect.2, when we fix the fLcut value to prevent our analysis from the influence of
possible low frequency noise. However, we should keep in mind that this ridge is also the place where we should expect hybrid δ Scuti-γ Doradus stars. In addition to the modes characterizing δ Scuti stars, these objects present low-frequency pulsation modes not considered unstable in
our models. A closer inspection of these spectra will be necessary to explore this possibility.
The second component presented by the observed set of stars and not by the models is much less important in numbers. It appears as a cloud of points around the up-per left corner of figure1, i.e. stars with fmin values
bel-low 200 µHz and fmaxvalues between 500 and 900 µHz.
As it reads from the oblique lines in figure1, this corre-sponds to extremely large estimates of frequency range value ( fmax− fmin >500 µHz). The inspection of several
spectra suggests that, to a large extent, these values could be due to the poor handling of particularly severe window-artefacts by the data processing presented in Sect.2. This is supported by the presence of a significant fraction of spectra with high amaxvalues among those points.
Beside this, the fmin_ fmax diagram for observed stars
and the one for models look in reasonably good agree-ment, with a scarce distribution of points at high fminand
fmaxvalues, where evolution sequences are highly spread
in mass and age in figure3, and a denser concentration of points at low values, where the evolution sequences tend to converge.
4.1 Amplitude of the oscillations versus evolution. It is worth noticing that the distribution of amax shows a
clear gradient (from 0.1 to 40 part-per-thousand, ppt here-after) with increasing amplitude values toward low values of fminand fmax. As we already commented, according to
the theoretical diagram, this domain of the fmin_ fmax
dia-gram is expected to host rather evolved stars.
The fact that evolved δ Scuti stars tend to show higher amplitudes than main sequence ones has been observed for long (see e.g. [4]), but to our knowledge, this trend has never been observed with such a resolution in amplitude and on such a large sample of objects. In the case of Kepler data, [26] considered about 1570 objects, but a large frac-tion of them (∼1150) were observed in the so-called long cadence mode, i.e. with a 30 minutes sampling time which is not suited to address frequencies higher than 270 µHz. These data will thus be very helpful to study δ Scuti stars, but mostly evolved ones.
4.2 Evidence of a regular frequency pattern in early main sequence δ Scuti stars.
Models off the main sequence are not produced here, but we have inspected several such sequences, and they are al-ways found in the domain of low fminand fmax. Even with
αov=0 (no overshooting), which corresponds to the
short-est extension of the main sequence, post-main sequence models seem to remain below the fmax=400 µHz limit.
We now consider stars with fmax > 400 µHz, i.e. for
which, according to models, fmin and fmax values
corre-spond unambiguously to main sequence models, whatever the amount of overshooting considered. As illustrated in figure4, we also avoid spectra with dubious values as dis-cussed in Sect.2. The domain of the HR diagram corre-sponding to this selection in the case of models presented here is illustrated in figure5.
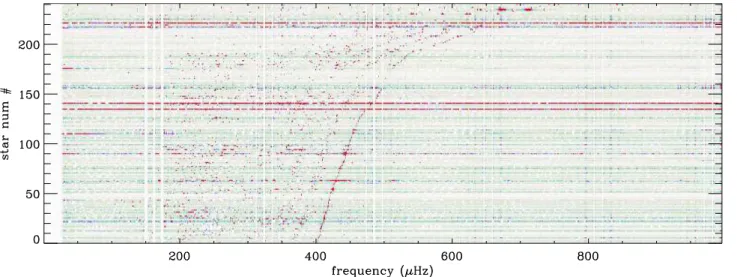
For this set of about 200 stars, we build an image pre-sented in figure6, where each amplitude spectrum is a line where amplitude is limited to an arbitrary value athr (here
athr = 0.2ppt) and coded in grey scale. The full image
thus presents more than 200 spectra, sorted by increasing fmaxvalue from the bottom to the top.
In figure6, we distinguish a few ridges approximately parallel to the ridge drawn by peaks associated with fmax
values. These ridges separated by a few tens of µHz im-mediately recall the quasiregular pattern of axisymmetric island modes as described by nonperturbative calculation of fast rotators ([27] and [28]). They also recall the various detection of spacings of the order of the large separation in δScuti stars ([13],[11])
The pattern associated with these ridges has to be com-mon to a sufficient fraction of our stellar sample to show up in figure6. This suggests that this quasiregular pattern of peaks has to be, to some extent, independent of rotation, which necessarily varies from one star to another.
Axisymmetric modes are good candidates to explain this pattern as we will show hereafter.
An appealing idea is that the eigenspectra of axisym-metric modes of the different stars could be, at first order, homologous and thus distributed according to a common pattern of peaks, just multiplied by a different value of the large separation (or mean density).
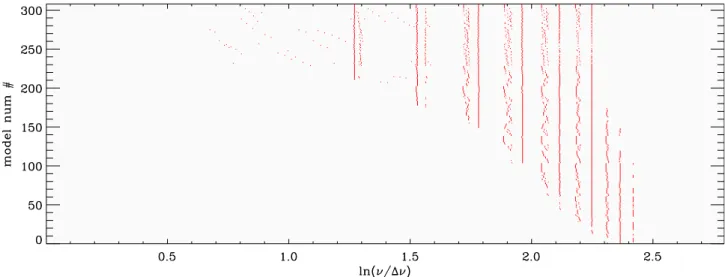
In order to test a bit further this idea, we rescaled the (observational) spectra, taking in abscissae the logarithm of frequency instead of the frequency itself. If our hy-pothesis is correct, the rescaled eigenspectra should show a similar pattern, just shifted by an amount depending on (the logarithm of) the individual large separation value. These rescaled spectra are presented in figure7where they have been shifted according to their individual fmaxvalue.
Here the sequence of ridges is more visible even if the pat-tern remains blured at low abscissae.
We treated the same way the theoretical spectra asso-ciated with the set of models shown in figure 5(models satisfying the same criterion fmax > 400 µHz than our
subsample of stars). Here again, we considered only un-stable axisymmetric (m=0) l=0,1,2 modes. The result is presented in figure8.
The figure7and figure8show great similarities with a few clear ridges near zero in abscissae followed by a less clear pattern. In fact, we have to pay attention to the fact that all these stars do not have the same range of unstable radial orders and this makes the superposition of the spec-tra less clear. This is demonsspec-trated in figure9, where the theoretical spectra this time are normalized by ∆ν instead of fmax. The ridges are much clearer now. This shows
that (for models without rotation) a common pattern exists and is not too much distorted by the structural changes of models in the early main sequence.
In order to illustrate the anticipate impact of rotation on this comparison, we added at the bottom of figure 8
(between line 10 and 18), the pattern obtained for axisym-metric (˜l=0) island modes (see [29]) in 9 models based on the Self-Consistent Field (SCF) method ([30]). These models are ZAMS 2M , ranging from 0 to 80% of the
break-up rotation rate. These eigenfrequencies are shown to illustrate the effect of rotation on the pattern, but these modes are not necessary unstable.
We see that the regular pattern is preserved to a good extent over this large range of rotation. In fact, at low radial order, the distribution of the modes appears even more regular than the one of models without rotation.
To conclude with this point, it seems important to stress that the spectra considered in this study obviously show numerous peaks outside of the common quasiregu-lar pattern revealed by figure 6or figure7. On the other hand, these figures do not suggest either that the modes as-sociated to this pattern are systematically expressed (with detectable amplitude). However these results suggests that this pattern is characteristic of the eigenspectra of chemi-cally normal early main sequence stars.
Figure 4: Same as in figure1but with purple lines marking the selection of the set of early main sequence objects with fmax >
400 µHz and fmax/fmin<4.5, as discussed in Sect.4.2.
Figure 5: Same as in figure2but here only unstable models from the selection described in Sect.4.2and illustrated in figure4are marked by red symbols.
5 Conclusions
We used a homogeneous set of about 1860 stellar light curves collected with CoRoT for stars classified as δ Scuti
For this set of about 200 stars, we build an image pre-sented in figure6, where each amplitude spectrum is a line where amplitude is limited to an arbitrary value athr (here
athr = 0.2ppt) and coded in grey scale. The full image
thus presents more than 200 spectra, sorted by increasing fmaxvalue from the bottom to the top.
In figure6, we distinguish a few ridges approximately parallel to the ridge drawn by peaks associated with fmax
values. These ridges separated by a few tens of µHz im-mediately recall the quasiregular pattern of axisymmetric island modes as described by nonperturbative calculation of fast rotators ([27] and [28]). They also recall the various detection of spacings of the order of the large separation in δScuti stars ([13],[11])
The pattern associated with these ridges has to be com-mon to a sufficient fraction of our stellar sample to show up in figure6. This suggests that this quasiregular pattern of peaks has to be, to some extent, independent of rotation, which necessarily varies from one star to another.
Axisymmetric modes are good candidates to explain this pattern as we will show hereafter.
An appealing idea is that the eigenspectra of axisym-metric modes of the different stars could be, at first order, homologous and thus distributed according to a common pattern of peaks, just multiplied by a different value of the large separation (or mean density).
In order to test a bit further this idea, we rescaled the (observational) spectra, taking in abscissae the logarithm of frequency instead of the frequency itself. If our hy-pothesis is correct, the rescaled eigenspectra should show a similar pattern, just shifted by an amount depending on (the logarithm of) the individual large separation value. These rescaled spectra are presented in figure7where they have been shifted according to their individual fmaxvalue.
Here the sequence of ridges is more visible even if the pat-tern remains blured at low abscissae.
We treated the same way the theoretical spectra asso-ciated with the set of models shown in figure 5 (models satisfying the same criterion fmax > 400 µHz than our
subsample of stars). Here again, we considered only un-stable axisymmetric (m=0) l=0,1,2 modes. The result is presented in figure8.
The figure7and figure8show great similarities with a few clear ridges near zero in abscissae followed by a less clear pattern. In fact, we have to pay attention to the fact that all these stars do not have the same range of unstable radial orders and this makes the superposition of the spec-tra less clear. This is demonsspec-trated in figure9, where the theoretical spectra this time are normalized by ∆ν instead of fmax. The ridges are much clearer now. This shows
that (for models without rotation) a common pattern exists and is not too much distorted by the structural changes of models in the early main sequence.
In order to illustrate the anticipate impact of rotation on this comparison, we added at the bottom of figure 8
(between line 10 and 18), the pattern obtained for axisym-metric (˜l=0) island modes (see [29]) in 9 models based on the Self-Consistent Field (SCF) method ([30]). These models are ZAMS 2M , ranging from 0 to 80% of the
break-up rotation rate. These eigenfrequencies are shown to illustrate the effect of rotation on the pattern, but these modes are not necessary unstable.
We see that the regular pattern is preserved to a good extent over this large range of rotation. In fact, at low radial order, the distribution of the modes appears even more regular than the one of models without rotation.
To conclude with this point, it seems important to stress that the spectra considered in this study obviously show numerous peaks outside of the common quasiregu-lar pattern revealed by figure 6or figure7. On the other hand, these figures do not suggest either that the modes as-sociated to this pattern are systematically expressed (with detectable amplitude). However these results suggests that this pattern is characteristic of the eigenspectra of chemi-cally normal early main sequence stars.
Figure 4: Same as in figure1but with purple lines marking the selection of the set of early main sequence objects with fmax >
400 µHz and fmax/fmin<4.5, as discussed in Sect.4.2.
Figure 5: Same as in figure2but here only unstable models from the selection described in Sect.4.2and illustrated in figure4are marked by red symbols.
5 Conclusions
We used a homogeneous set of about 1860 stellar light curves collected with CoRoT for stars classified as δ Scuti
Figure 6: Each horizontal line of this image is an grey scale coded amplitude spectrum of one of the stars belonging to the set of early main sequence stars selected as described in Sect.4.2and illustrated in figure4. Each spectrum is truncated in amplitude to values lower than a common limit value (here 2.10−4). The spectra clearly show thin vertical dark ridges resulting from setting to zero-amplitudes
parts of the spectra associated with the orbital period and its harmonics, plus day-aliases around them as explained in Sect.2.
Figure 7: Same as in figure6but abscissae of the spectra have been normalized by fmaxand converted in logarithm as described in the
text. In addition, spectra have been ordered by increasing fmax/fminvalue from the bottom to the top. The upper part of the image has
been extended to host a few additional lines showing (also in grey scale) the mean of all individual spectra.
stars with a probability higher than 80% by the automated supervised classification of variable stars in the CoRoT archive.
We have characterized these spectra in terms of range of observed frequencies, defining two parameters, fminand
fmax. The distribution of our sample of stars in a fmin_ fmax
diagram appears to be consistent with the one obtained from a grid of theoretical models and linear stability calcu-lations. This suggests that fmin_ fmaxvalues could be used
to characterize a specific mass range or evolution stage. Based on this criterion, we have selected stars that we consider to be on the early main sequence. We have shown that their spectra reveal a common pattern modulated by individual large separation values. The existence of reg-ularities in the spectra of δ Scuti stars has already been demonstrated by several studies. It has even been
demon-strated that this spacing is compatible with the classical large separation index used for solar-type pulsators and that rotation does not hamper the use of this index. Here the ridges we find for a large sample of stars confirm these results, but in addition, we show on a large set of objects that these regularties are due to a regular pattern of con-secutive peaks which is compatible with patterns expected for axisymmetric island modes as suggested by recent non-perturbative modelling of fast rotating stars ([31]).
We still need to improve our knowledge and parametri-sation of this pattern in synergy with further theoretical work on fast rotation. This study obviously would bene-fit from being extended to an even larger set of stars. The extension of this work to Kepler data is not expected to change considerably the case of the early main sequence stage since the high frequencies characterizing this domain
Figure 8: Same as in figure7(except for the 20 bottom raws), but for the set of models shown in figure 5, i.e. models satisfying the same criterion fmax > 400 µHz than the subsample of stars considered in figure7. The 20 bottom raws are dedicated to ˜l=0
axisymmetric modes of models with rotation value going from zero to 80% of the breakup rotation rate, as described in Sect.4.2.
Figure 9: Same as in figure8, but here the theoretical spectra are normalized by ∆ν instead of fmax.
are not accessible with the sampling time of long cadence data which constitute the essential of kepler data. How-ever, in the difficult part of the fmin_ fmax diagram
corre-sponding to evolved δ Scuti stars, the Kepler data might be of great help.
This suggests that fmin and fmax as well as large
sep-aration values might be used as seismic indices to char-acterize stars and this opens the perspective for ensemble seismology using δ Scuti stars.
Acknowledgements
The CoRoT space mission, launched on December 27th 2006, has been developed and is operated by the Centre National d’Etudes Spatiales (CNES), with contributions from Austria, Belgium, Brazil, the European Space Agency (RSSD and Science Programme), Germany and Spain. We acknowl-edge the support from the EC Project SpaceInn (FP7-SPACE-2012-312844). EM, KB, RS and DR acknowledge the
support from the Programme de Physique Stellaire (PNPS). AGH acknowledges support from Fundação para a Ciên-cia e a Tecnologia (FCT, Portugal) through the fellowship SFRH/BPD/80619/2011. JCS acknowledges funding support from Spanish public funds for research under project ESP2015-65712-C5-5-R (MINECO/FEDER), and under Research Fellow-ship program Ramon y Cajala (MINECO/FEDER).
References
[1] A. Baglin, M. Auvergne, P. Barge, M. Deleuil, C. Catala, E. Michel, W. Weiss, COROT Team, Sci-entific Objectives for a Minisat: CoRoT, in The CoRoT Mission Pre-Launch Status - Stellar Seis-mology and Planet Finding, edited by M. Fridlund, A. Baglin, J. Lochard, L. Conroy (2006), Vol. 1306 of ESA Special Publication, p. 33
[2] W.J. Borucki, D. Koch, G. Basri, N. Batalha, T. Brown, D. Caldwell, J. Caldwell, J.
Christensen-Figure 8: Same as in figure7(except for the 20 bottom raws), but for the set of models shown in figure 5, i.e. models satisfying the same criterion fmax > 400 µHz than the subsample of stars considered in figure 7. The 20 bottom raws are dedicated to ˜l=0
axisymmetric modes of models with rotation value going from zero to 80% of the breakup rotation rate, as described in Sect.4.2.
Figure 9: Same as in figure8, but here the theoretical spectra are normalized by ∆ν instead of fmax.
are not accessible with the sampling time of long cadence data which constitute the essential of kepler data. How-ever, in the difficult part of the fmin_ fmax diagram
corre-sponding to evolved δ Scuti stars, the Kepler data might be of great help.
This suggests that fmin and fmax as well as large
sep-aration values might be used as seismic indices to char-acterize stars and this opens the perspective for ensemble seismology using δ Scuti stars.
Acknowledgements
The CoRoT space mission, launched on December 27th 2006, has been developed and is operated by the Centre National d’Etudes Spatiales (CNES), with contributions from Austria, Belgium, Brazil, the European Space Agency (RSSD and Science Programme), Germany and Spain. We acknowl-edge the support from the EC Project SpaceInn (FP7-SPACE-2012-312844). EM, KB, RS and DR acknowledge the
support from the Programme de Physique Stellaire (PNPS). AGH acknowledges support from Fundação para a Ciên-cia e a Tecnologia (FCT, Portugal) through the fellowship SFRH/BPD/80619/2011. JCS acknowledges funding support from Spanish public funds for research under project ESP2015-65712-C5-5-R (MINECO/FEDER), and under Research Fellow-ship program Ramon y Cajala (MINECO/FEDER).
References
[1] A. Baglin, M. Auvergne, P. Barge, M. Deleuil, C. Catala, E. Michel, W. Weiss, COROT Team, Sci-entific Objectives for a Minisat: CoRoT, in The CoRoT Mission Pre-Launch Status - Stellar Seis-mology and Planet Finding, edited by M. Fridlund, A. Baglin, J. Lochard, L. Conroy (2006), Vol. 1306 of ESA Special Publication, p. 33
[2] W.J. Borucki, D. Koch, G. Basri, N. Batalha, T. Brown, D. Caldwell, J. Caldwell, J.
Christensen-Dalsgaard, W.D. Cochran, E. DeVore et al., Science 327, 977 (2010)
[3] M. Breger, δ Scuti stars (Review), in Delta Scuti and Related Stars, edited by M. Breger, M. Montgomery (2000), Vol. 210 of Astronomical Society of the Pa-cific Conference Series, p. 3
[4] E. Rodríguez, M. Breger, A&A,366, 178 (2001) [5] F. Royer, M. Gebran, R. Monier, S. Adelman,
B. Smalley, O. Pintado, A. Reiners, G. Hill, A. Gul-liver, A&A,562, A84 (2014), 1401.2372
[6] F. Lignières, M. Rieutord, D. Reese, A&A,455, 607 (2006), astro-ph/0604312
[7] D. Reese, F. Lignières, M. Rieutord, A&A,455, 621 (2006), astro-ph/0605503
[8] S. Barceló Forteza, E. Michel, T. Roca Cortés, R.A. García, A&A,579, A133 (2015), 1506.00543 [9] D.M. Bowman, D.W. Kurtz, M. Breger, S.J.
Mur-phy, D.L. Holdsworth, MNRAS, 460, 1970 (2016), 1605.03955
[10] A. García Hernández, A. Moya, E. Michel, J.C. Suárez, E. Poretti, S. Martín-Ruíz, P.J. Amado, R. Garrido, E. Rodríguez, M. Rainer et al., A&A, 559, A63 (2013), 1307.2739
[11] M. Paparó, J.M. Benk˝o, M. Hareter, J.A. Guzik, ApJS,224, 41 (2016), 1603.09161
[12] M. Breger, L. Balona, P. Lenz, J.K. Hollek, D.W. Kurtz, G. Catanzaro, M. Marconi, A.A. Pamyatnykh, B. Smalley, J.C. Suárez et al., MNRAS, 414, 1721 (2011), 1012.4373
[13] A. García Hernández, S. Martín-Ruiz, M.J.P.F.G. Monteiro, J.C. Suárez, D.R. Reese, J. Pascual-Granado, R. Garrido, ApJL, 811, L29 (2015), 1509.01111
[14] M.A. Dupret, A. Grigahcène, R. Garrido, M. Gabriel, R. Scuflaire, A&A,414, L17 (2004)
[15] E. Michel, M.M. Hernández, G. Houdek, M.J. Goupil, Y. Lebreton, F. Pérez Hernández, A. Baglin, J.A. Belmonte, F. Soufi, A&A,342, 153 (1999) [16] K. Zwintz, L. Fossati, T. Ryabchikova, D.
Guen-ther, C. Aerts, T.G. Barnes, N. Themeßl, D. Lorenz, C. Cameron, R. Kuschnig et al., Science 345, 550
(2014), 1407.4928
[17] A. Baglin, I.1 The general framework (2016), p. 5 [18] J. Debosscher, L.M. Sarro, M. López, M. Deleuil,
C. Aerts, M. Auvergne, A. Baglin, F. Baudin, M. Chadid, S. Charpinet et al., A&A, 506, 519 (2009)
[19] E. Rodríguez, M.J. López-González, P. López de Coca, A&AS,144, 469 (2000)
[20] M.A.C. Perryman, The HIPPARCOS Catalogue Contents, in Hipparcos - Venice ’97, edited by R.M. Bonnet, E. Høg, P.L. Bernacca, L. Emiliani, A. Blaauw, C. Turon, J. Kovalevsky, L. Lindegren, H. Hassan, M. Bouffard et al. (1997), Vol. 402 of ESA Special Publication, pp. 1–4
[21] A. Udalski, A. Olech, M. Szymanski, J. Kaluzny, M. Kubiak, M. Mateo, W. Krzeminski, K.Z. Stanek, Acta Astron.,47, 1 (1997), astro-ph/9704228 [22] C. Alcock, R.A. Allsman, D.R. Alves, T.S. Axelrod,
A.C. Becker, D.P. Bennett, K.H. Cook, K.C. Free-man, M. Geha, K. Griest et al., ApJ,536, 798 (2000) [23] M. Auvergne, P. Bodin, L. Boisnard, J.T. Buey, S. Chaintreuil, G. Epstein, M. Jouret, T. Lam-Trong, P. Levacher, A. Magnan et al., A&A, 506, 411 (2009), 0901.2206
[24] R. Scuflaire, S. Théado, J. Montalbán, A. Miglio, P.O. Bourge, M. Godart, A. Thoul, A. Noels, Ap&SS,316, 83 (2008), 0712.3471
[25] A. Grigahcène, M.A. Dupret, M. Gabriel, R. Garrido, R. Scuflaire, A&A,434, 1055 (2005)
[26] L.A. Balona, W.A. Dziembowski, MNRAS,417, 591 (2011)
[27] D. Reese, F. Lignières, M. Rieutord, A&A,481, 449 (2008), 0801.4630
[28] R.M. Ouazzani, I.W. Roxburgh, M.A. Dupret, A&A, 579, A116 (2015), 1505.01088
[29] F. Lignières, B. Georgeot, A&A, 500, 1173 (2009), 0903.1768
[30] K.B. MacGregor, S. Jackson, A. Skumanich, T.S. Metcalfe, ApJ,663, 560 (2007), 0704.1275 [31] D.R. Reese, K.B. MacGregor, S. Jackson, A.
Sku-manich, T.S. Metcalfe, A&A, 506, 189 (2009), 0903.4854