Three Essays on the Economics of Air Transportation
Thèse
Laingo Manitra Randrianarisoa
Doctorat en Économique Philosophiæ doctor (Ph.D.)
Québec, Canada
Three Essays on the Economics of Air Transportation
Thèse
Laingo Manitra Randrianarisoa
Sous la direction de:
Carlos Ordás Criado, Directeur de recherche Denis Bolduc, Codirecteur de recherche Philippe Barla, Codirecteur de recherche
Résumé
Cette thèse est constituée de trois essais en économie du transport aérien. Le premier essai, intitulé "Effects of Corruption on Efficiency of the European Airports", établit un lien entre la corruption et l’efficacité opérationnelle des aéroports européens. Plusieurs États ont privatisé et commercialisé leurs aéroports publics dans le but d’améliorer l’efficacité de leurs opérations. Cependant, un niveau élevé de corruption dans le pays pourrait compromettre la réalisation de cet objectif. La littérature économique suggère que l’exposition à la corruption peut interférer dans l’allocation des ressources, surtout lorsqu’il s’agit de grandes infrastructures. En utilisant des données sur 47 aéroports européens observés au cours de la période de 2003 à 2009 et un indicateur de corruption provenant de "International Country Risk Guide", nous montrons que la corruption a des effets négatifs sur l’efficacité des aéroports et l’ampleur des impacts dépend des structures de propriété et de gestion des aéroports (public, privé et mixte). En particulier, la corruption réduit l’efficacité des aéroports privés. Ces derniers deviennent même moins efficaces que les aéroports publics lorsque l’environnement est fortement corrompu. Nous concluons que la privatisation n’améliore pas nécessairement la performance des aéroports lorsque la corruption est élevée.
Le deuxième essai, intitulé "Flexible Estimation of an Airport Choice Model : The Case of Quebec Airports", analyse les déterminants de choix des voyageurs entre un aéroport régional et une plate-forme de correspondance aéroportuaire au Québec. Parmi les modèles les plus populaires, nous explorons le logit à coefficients fixes et variables, le logit additif généralisé et les estimateurs de probabilités conditionnelles de noyaux pour variables continues et discrètes. Les modèles empiriques utilisent les résultats d’une enquête sur la qualité des services aux aéroports réalisée auprès des passagers embarquant à l’un des deux aéroports principaux de Québec en 2010. Les résultats économétriques soulignent l’importance de la fréquence de vol et de l’accessibilité à l’aéroport dans le choix des voyageurs. Le prix du service, la raison du déplacement ainsi que la destination et l’horaire du vol paraissent aussi pertinents. Bien que les modèles logistiques testés ont des fondements théoriques basés sur les modèles d’utilité aléatoire, les tests économétriques d’adéquation de la forme fonctionnelle rejettent ces modèles. Les estimateurs de noyaux offrent une alternative flexible pour capturer des non-linéarités et des effets d’interaction entre les variables explicatives qui échappent aux modèles logistiques.
Le troisième essai, intitulé "When Hotelling Meets Vickrey − Spatial Differentiation and Ser-vice Timing in the Airline Industry", développe un modèle de concurrence duopolistique entre deux aéroports desservis chacun par un transporteur. Les transporteurs offrent un seul vol vers une même destination. L’interaction entre les aéroports et les transporteurs est modélisée à l’aide d’un jeu séquentiel à trois étapes. Dans un premier temps, les aéroports fixent (si-multanément) la taxe aéroportuaire chargée aux transporteurs et annoncent la plage horaire disponible pour le vol. Ensuite, les transporteurs fixent chacun l’heure de leur vol. À la dernière étape, les transporteurs décident du prix du voyage. Les voyageurs, répartis sur un espace géo-graphique linéaire de taille fixe et dotés de préférences hétérogènes pour les heures de départ, choisissent le couple aéroport-transporteur en fonction du prix du billet d’avion, du coût de déplacement vers les infrastructures et du coût de déshorage (coût monétaire de partir avant ou après l’heure préférée). Ce cadre d’analyse est utilisé pour explorer l’impact de l’emplacement géographique des aéroports et de l’horaire du vol sur les taxes aéroportuaires, les prix du billet d’avion, la demande des voyageurs et les profits. Les résultats montrent qu’un aéroport qui bénéficie d’une meilleure localisation géographique charge une taxe aéroportuaire plus élevée que son concurrent et que son transporteur profite également de cet avantage en localisation pour accroître ses prix vis-à-vis du transporteur concurrent. Lorsque les coûts opérationnels des transporteurs ne dépendent pas de l’heure de départ, ils fixent un horaire identique et la concurrence pour attirer les voyageurs se fait exclusivement par les prix des billets. Si leurs coûts varient selon l’heure de départ, les transporteurs différencient en général leur horaire, et cela même lorsque ces coûts horaires sont identiques entre transporteurs. La différenciation des temps de départ permet aux aéroports et aux transporteurs de se concurrencer en horaire, ce qui peut réduire ou renforcer l’avantage géographique.
Abstract
My thesis is composed of three essays on the economics of air transportation. My first essay, entitled "Effects of Corruption on Efficiency of the European Airports", analyzes the effect of corruption on airport productive efficiency in Europe. Many governments have privatized and commercialized their airports in order to improve efficiency of their operations. However, this objective may not be achieved if the business-operating environment is very corrupt. According to the economics literature, corruption may be a hindrance to efficiency, especially when it comes to large infrastructures. Using an unbalanced panel data of 47 major European airports from 2003 to 2009 and the corruption measure provided by International Country Risk Guide (ICRG), we show that corruption has a negative impact on airport operating efficiency and the effect depends on the ownership form (private, public and mixed). Airports under mixed public-private ownership with private majority achieve lower levels of efficiency when located in more corrupt countries. They even operate less efficiently than fully and/or majority government owned airports in highly corruption environment. We conclude that privatization may not lead to efficiency gains in countries that suffer from higher levels of corruption.
My second essay, entitled "Flexible Estimation of an Airport Choice Model: The Case of Quebec airports", explores the determinants of passengers’ choice between a primary hub and a secondary airport in Quebec. Among the most popular models, we explore fixed- and random-coefficients logistic models along with two flexible alternatives including an additive logistic model and a kernel-based conditional density with continuous and discrete variables. Using an original dataset from the 2010 Airport Service Quality survey conducted in Quebec airports, we show that flight frequency, access time and access mode to airports, among others, are the main factors of airports’ choice across all specifications. Airfare, the reason for travel, flight destination and departure times also appear to have significant impacts. While the logistic models have strong theoretical foundations based on the random utility models, the recent kernel-based tests reject these specifications. The nonparametric kernel estimators provide flexible tools to capture non linearities and interactions effects between selected explanatory variables without imposing shape constraints on the conditional probability.
Timing in the Airline Industry", investigates rivalry between transport facilities in a model that includes two sources of horizontal differentiation: geographical location and departure time. We explore how both sources influence facility fees and the price of the service offered by downstream carriers. The interactions between the facilities and their carriers are repre-sented as a sequential three-stage game in fees, departure times and fares with simultaneous choices at each stage. Travellers’ cost includes a fare, a transportation cost to the facility and a schedule delay cost, which captures the monetary cost of departing earlier or later than desired. One carrier operates at each facility and schedules a single departure time. We show that duopolistic competition drives to an identical departure time across carriers when their operational cost does not vary with the time of day, but generally leads to distinct service times when this cost depends on the time of the day. When a facility possesses a location advantage, it can set a higher fee and its downstream carrier can charge a higher fare. Depar-ture time differentiation allows the facilities and their carrier to compete along an additional differentiation dimension that can reduce or strengthen the advantage in location.
Contents
Résumé iii Abstract v Contents vii List of Tables ix List of Figures x Acknowledgments xii Avant-propos xiv Introduction 11 Effects of Corruption on Efficiency of the European Airports 4
1.1 Introduction. . . 4 1.2 Literature Review. . . 7 1.3 Methodology . . . 9 1.4 Data description . . . 11 1.5 Description of variables . . . 13 1.6 Empirical results . . . 17 1.7 Robustness checks . . . 23 1.8 Conclusion of Essay 1 . . . 30
2 Flexible Estimation of an Airport Choice Model: The Case of Quebec Airports 32 2.1 Introduction. . . 32 2.2 Literature Review. . . 35 2.3 Methodology . . . 39 2.4 Data . . . 45 2.5 Empirical results . . . 50
2.6 Comparison of model goodness-of-fit . . . 64
2.7 Conclusion of Essay 2 . . . 65
3 When Hotelling meets Vickrey Spatial differentiation and service timing in the airline industry 67 3.1 Introduction. . . 68
3.2 The Model . . . 71 3.3 Numerical Results . . . 94 3.4 Conclusion of Essay 3 . . . 102 Conclusion 104 Appendix A 107 A. 1 Descriptive statistics . . . 107 Appendix B 108 B. 1 Derivations assuming T0 ≤ T1 . . . 108 B. 2 Derivations assuming T0 ≥ T1 . . . 112
B. 3 Nash equilibrium in fares . . . 114
B. 4 Derivations related to the minimization of social costs . . . 115
B. 5 Substituting the equilibrium fees in carriers’ equilibrium fares and markups 116 B. 6 Covered market condition in terms of model parameters . . . 117
List of Tables
1.1 List of airports . . . 12
1.2 Descriptive statistics of the variables used in the airport efficiency analysis . . . 13
1.3 Corruption Indices of the sample of countries - 2009 . . . 15
1.4 Residual (or net) variable factor productivity (rvfp) efficiency scores . . . 18
1.5 Estimation results using pooled OLS and Random Effects (RE) models. . . 22
1.6 Estimation results using additional control variables . . . 24
1.7 Estimation results using alternative corruption indices . . . 26
1.8 Estimation results using different ownership categories . . . 27
1.9 Estimation results using different set of sample . . . 29
2.1 Variables used in the choice models . . . 47
2.2 Descriptive Statistics . . . 49
2.3 Estimation results of the fixed- and random-coefficients logistic model . . . 51
2.4 Average marginal effects from the fixed-coefficients logit . . . 54
2.5 Likelihood Ratio and Wald tests: Fixed v.s Random-Coefficients logit . . . 56
2.6 Estimates of the continuous variables from Generalized Additive Models . . . . 56
2.7 Estimates of the discrete explanatory variables of Generalized Additive Models 57 2.8 Results of the nonparametric specification tests . . . 58
2.9 Bandwidths for the kernel estimator . . . 60
2.10 Statistics of Pseudo-R2 . . . . 64
2.11 Classification table for different cut-offs . . . 65
3.1 Market Equilibrium and Social Optimum . . . 96
List of Figures
2.1 Partial regression plots of the continuous explanatory variables . . . 60
2.2 Partial regression plots of the discrete explanatory variables . . . 62
2.3 Interaction effects of airfare and access time according to flight purpose (leisure/business) and flight destination (domestic/international) using nonparametric Kernel es-timator . . . 63
3.1 Consumer’s schedule delay cost and the time line . . . 73
3.2 Indifferent consumer along the geographic line . . . 74
3.3 Indifferent consumer along the time line . . . 75
3.4 Effect of a positive change of h on ˆπ∗ i. . . 82
3.5 A specific case of carriers’ linear time cost functions K(Ti) . . . 85
3.6 Carrier fares, profits as a function of h when service times are equal . . . 97
3.7 Carriers profits and service timing . . . 98
3.8 Carriers’ fares and profits and advantage in location when service times are strongly differentiated . . . 99
3.9 Nash Equilibria in service time and reaction functions for the carrier-rivalry game 100 B. 1.1ΦU(T) when t ∼ U[0, 24]. . . . 111
To my parents, Jean and Christine
Acknowledgments
I would like to express my deepest gratitude to my advisor Carlos Ordás Criado for his excellent guidance, his encouragements and his time. Carlos allowed me to pursue this thesis under his supervision without any constraints while always being positive and generous. He also introduced me to the exciting research area of transportation economics, for which I cannot thank him enough. I am also very thankful to my co-advisor Philippe Barla for his sound advice and his invaluable comments on all aspects of my work. I am so grateful that Denis Bolduc accepted to supervise my work and warmly welcomed me into the Airport Research Chair with much generosity. My many thanks also go to Vincent Boucher, Michel Roland and Christos Constantatos for their participation in evaluating my work and providing helpful suggestions.
During my Ph.D. program, I had an incredible opportunity to spend a few months at the University of British Columbia. While there, I was warmly received by Prof. Tae Oum and the ATRS research team, whose courtesy and hospitality made me feel very welcome and productive. So many thanks to Tae and his research team. I am also particularly grateful to Prof. André de Palma from ENS Cachan for his valuable contribution and for sharing his expertise to improve several sections of this dissertation.
I wish to thank the Airport Research Chair, Centre de Recherche en économie de l’Environnement, de l’Agroalimentaire, des Transports et de l’Énergie (CREATE) and the Department of Eco-nomics of Université Laval for providing social, academic, and financial support. I also owe a great debt to all the faculty members and administrative staff of the Department of Economics for their outstanding work and for always being helpful. A special thank you to Markus Her-rmann for his support and good advice throughout these years of Ph.D., to Sylvain Dessy for the opportunity he gave to me to pursue the doctoral program at Université Laval and for en-couraging me to pursue my research ideas, and to Martine Guay for her outstanding assistance. I would especially like to thank Paule Duchesneau for her kindness and her support.
I wish to extend my heartfelt thanks to Maria Adelaida and Safa Ragued for our constructive and fruitful academic and non-academic discussions; to Isaora Dialahy for generously devoting his time to help me with Mathematica. I also thank my colleagues with whom I shared offices and coffee along with the members of the Airport Research Chair. Knowing that
I can always count on friends and family gave me the strength and courage to overcome every academic challenge. For that, I kindly thank Maude, Emmanuelle, Nicholas-James, Sarah, Nasro, Mélissa, Steph, Constantinos and Spiros, with whom I shared joys and doubts during my academic journey. I do not forget friends and family from Madagascar for their encouragement. No words of mine can express my gratitude to Tiana and Jony for their hospitality and for always being by my side during my doctoral studies.
Last but not least, I cannot thank enough my family for their support and their love. My Dad taught me how to be patient and persevere and gave me thoughtful advice to cheer me up. Thank you, Dad. Thanks also to Pandry for his serenity and kindness that I truly admire. Thank you to Manja for his moral support and for helping me to find the right path in any moments of doubt.
Avant-propos
Les chapitres de la présente thèse sont constitués d’un article publié et de deux documents de travail, qui sont en cours de rédaction dans le but de les soumettre à des revues scientifiques avec comité de lecture.
Le chapitre 1 est un article réalisé avec mon co-directeur Denis Bolduc, les professeurs Tae Oum et Jia Yan ainsi que Dr. Yap Yip Choo. Cet article intitulé "Corruption Effects on Efficiency of the European Airports", dont je suis la principale auteure, a été publié dans le journal scientifique avec comité de lecture Transportation Research Part A: Policy and Practice, Volume 79, September 2015, Pages 65−83.
Le deuxième chapitre est un article réalisé avec mon directeur de thèse, Carlos Ordás Criado. Je suis l’auteure principale de cet article. Le troisième chapitre est un article co-écrit avec mon directeur de thèse, Carlos Ordás Criado, et le professeur André de Palma.
Introduction
In the 1970s and 1980s, many governments around the world embraced the international trend towards airline deregulation and airport privatization. Starting with the three airports in Lon-don area (Heathrow, Gatwick, and Stansted) in 1987, many airports in Europe, New Zealand and Australia have already been or are in the process of being privatized.1 In the US, airports
are still owned by states but operations of some commercial airports are transferred to either a branch of government (mostly municipal or metropolitan government) or an airport or port authority set up by government. As for Canada, government set up local not-for-profit corpo-rations − airport authorities − to manage major airports. The main goal of privatization and management restructuring of airports is to increase efficiency of their operations, as higher efficiency contributes significantly to regional development, by reducing travel costs of con-sumers and boosting employment.2 Besides, some evidence suggest that privatized airports
exhibit higher efficiency than the public ones (Oum et al.,2006,2008).
Since the 2000s economists have been arguing that corruption may interfere in the allocation of resources and then affect efficiency of infrastructures. Svensson (2005) and Dal Bó and Rossi (2007) agree that efficiency losses due to corruption are particularly damaging when it affects large infrastructures. In the aviation industry, Yan and Oum (2014) conclude that corruption engenders input misallocation and reduces productivity of publicly-owned airports. If there exists a negative link between airport efficiency and corruption, efficiency gains from privatization may not be guaranteed in a high corruption environment. The first chapter of this dissertation attempts to empirically test whether this negative relationship between efficiency and corruption exists for European airports, and evaluate if the corruption effects depend upon different forms of airport management and ownership (private, public and mixed). From this study, we offer additional empirical evidence on the effect of corruption on airport efficiency, by using a sample of European airports observed over the 2003 − 2009 period and
1
The majority (or minority) stakes of a large number of airports have been sold to private owners. For example, the majority stakes in Copenhagen Kastrup International Airport, Vienna International Airport, and Rome’s Leonardo Da Vinci Airport have been sold to private owners.
2Brueckner(2003) studied the link between airline traffic and urban economic development and shows that
a 10% increase in passenger enplanements in a metropolitan area boosts the employment in service-related industries by approximately 1%. This result implies that an airport expansion that would generate a 50% increase in traffic would raise service-related employment in the metropolitan area by 185 000 jobs.
the corruption index provided by International Country Risk Guide (ICRG). The empirical results suggest that airport efficiency is affected by corruption, but the effect depends upon the ownership form. As expected, private airports are more efficient than the public ones, when the country-level corruption is low. However, they operate less efficiently than public airports in a high corruption environment. We conclude that efficiency gains from privatization may be cancelled out by the negative effects of corruption.
The airline deregulation and airport privatization have also promoted development of regional airports, and created opportunity for competition between medium regional and large airline-hub airports. Despite the wide range of studies on airport competition, rivalry between regional and main airports has attracted less attention in the economics literature. The second chapter of this dissertation uses state-of-art estimation methods to explore the determinants of the choice between a regional and the closest airline-hub airports, and quantify their impacts on the conditional choice probability. As previous literature mostly uses the family of random utility models based on logistic specifications to analyze airport competition (see for example Pels et al.(2000,2003);Ishii et al.(2009)), we empirically test whether the functional forms of the logistic models are correctly specified, and further explore more flexible estimation methods including Generalized Additive models (GAM) and fully nonparametric kernel estimators. Using an original dataset from the 2010 Airport Service Quality (ASQ) survey in Quebec Jean Lesage (YQB) and Montreal Pierre-Elliot Trudeau (YUL) international airports, we show that the choice of a regional facility is strongly linked to the access time and access mode to the airport, flight frequency, departure time, flight destination, reason of flight and passengers’ characteristics such as age and gender. Results of the specification tests based on the methods proposed by Fan et al. (2006) and Li and Racine (2013) suggest that both fixed- and random-coefficients logit and GAM models are misspecified from an econometric viewpoint. We report the results of alternative fully nonparametric kernel estimators by means of plotting 3-dimensional devices to give a representation of the interaction effects between continuous and discrete regressors on the conditional probability, often ignored in the literature.
The third chapter of this dissertation discusses strategic interactions between large airline-hub and medium regional airports in a duopolistic market. Empirical evidence suggests that demand for services at an airport is strongly linked to the price of the service offered, access time and cost to the airport and flight departure/arrival times (Pels et al.(2000,2003);Ishii et al. (2009); Brey and Walker (2011)). Theoretical researchers often borrow the Hotelling
(1929) framework to study the pricing mechanism of facilities and downstream carriers when travellers’ transportation costs exist (Basso and Zhang (2007)) and to analyze competition in scheduling times (van der Weijde et al.(2014)) while they use theVickrey (1969) framework to model consumers’ value of time and scheduling delay cost.3 The third chapter of this
disser-3
tation attempts to bringHotelling(1929) andVickrey(1969) frameworks together to analyze pricing and scheduling decisions of rival carriers and facilities. The model incorporates both spatial differentiation and service timing. It also considers important characteristics of the aviation industry that most of the previous literature have neglected: a captive market, which captures the difference between large and small/medium airports, and the vertical relation-ship between carriers and airports. In the analysis we consider a three-stage sequential game with multiple agents (airports, airlines and consumers). In the first stage, profit-maximizing airports receive commercial revenues and set the aeronautical fees to be charged to carriers. In the second stage, two cases are studied: (i) when departure times are exogeneously set and carriers compete in fares and (ii) when departure times are simultaneously chosen prior to fares and carriers compete in both departure times and fares. In the last stage, consumers with heterogeneous desired departure times decide whether or not to travel and if so, which facility they depart. The results confirm that without any differentiation, the aeronautical charges and fares are proportional to the facilities’ and carriers’ marginal costs. When an airport possesses a location advantage, it can set a higher aeronautical fee and its downstream carrier can charge a higher fare. We also find that duopolistic competition drives to iden-tical departure times across carriers when their operational does not vary with the time of day, but generally leads to distinct service times when this cost depends on the time of the day. Differentiation in departure times allows the airports and their carriers to compete in an additional dimension that can reduce or strengthen location advantage. Minimizing the social costs requires a captive market that corresponds to the third of the total market, and differentiated departure times if the time costs are ignored.
Chapter 1
Effects of Corruption on Efficiency of
the European Airports
Abstract
The effect of corruption on airport productive efficiency is analyzed using an unbalanced panel data of major European airports from 2003 to 2009. We first compute the residual (or net) variable factor productivity using the multilateral index number method and then apply robust cluster random effects model in order to evaluate the importance of corruption. We find strong evidence that corruption has negative impacts on airport operating efficiency; and the effects depend on the ownership form of the airport. The results suggest that airports under mixed public-private ownership with private majority achieve lower levels of efficiency when located in more corrupt countries. They even operate less efficiently than fully and/or majority government owned airports in high corruption environment. We control for economic regulation, competition level and other airports’ characteristics. Our empirical results survive several robustness checks including different control variables, three alternative corruption measures: International Country Risk Guide (ICRG) corruption index, Corruption Perception Index (CPI) and Control of Corruption Index (CCI). The empirical findings have important policy implications for management and ownership structuring of airports operating in countries that suffer from higher levels of corruption.
Keywords: Corruption effect; European airport operating efficiency; Residual (or net) variable factor productivity; Ownership form; Random effects model
1.1
Introduction
This paper investigates the relationship between airport efficiency and corruption in Europe. The determinants of airport efficiency have been largely analyzed in the literature. Studies found that ownership forms (Oum et al., 2006; Assaf and Gillen, 2012; Adler and Liebert,
2014), the level of competition (Chi-Lok and Zhang,2009;Malighetti et al.,2009), economic regulation (Assaf and Gillen,2012;Adler and Liebert, 2014) and institutional arrangements (Oum et al., 2008), among others, affect the performance and productivity of airports. The impacts of corruption on airport cost efficiency have received limited attention.
To our knowledge, the study by Yan and Oum (2014) appears to be the only one that in-vestigates the effects of corruption on productivity and input allocation of airports. Using the case of major commercial US airports, their findings reveal that corruption negatively in-fluences airport productivity: in more corrupt environments airports become less productive and tend to use more contracting-out to replace in-house labor. Nonetheless, their empirical analyses are limited to the US airports, which have limited forms of governance. US airports are owned and operated either by a branch of government (mostly municipal or metropolitan government) or through an airport or port authority set up by government. In this study, we extend the analysis of Yan and Oum(2014) to include different forms of airport manage-ment and ownership, including mixed public-private ownership with private minority, mixed public-private ownership with private majority and fully private ownership.
In recent years, the private-sector participation in airport management and/or ownership has become a worldwide trend. Starting from the seven major airports in UK including Heathrow, Gatwick and Stansted airports in 1987, many airports in Europe are fully or partially privatized and/or in the process of being privatized.1 The main goal of airport privatization is to allow
for easier access to private sector financing and investment, and to improve operating efficiency (Oum et al.,2006). We argue that privatized airports operating in corrupt environments may not achieve higher levels of efficiency because the incentives for managers to pursue efficiency goals are lower. Furthermore, private sector managers have more autonomy to change the allocation of inputs compared with bureaucrats, then they may focus on deriving personal benefits.
Our research is motivated by the literature on the effects of corruption on firm performance, and the empirical findings of Yan and Oum (2014)2 and Dal Bó and Rossi (2007)3 on the
negative correlation between corrupt environments and firm productivity. Corruption, which is defined as the misuse of public resources for private gains (Svensson, 2005) is a major source of economic inefficiency, as it diverts scarce resources from their most productive use. Furthermore, corruption is found to divert firms’ managerial efforts from productive activities to rent-seeking activities including political connection building (Fisman and Svensson,2007;
Svensson, 2003; Clarke and Xu, 2004; Dal Bó and Rossi, 2007). This study attempts to
1
For example, majority stakes in Copenhagen Kastrup, Vienna International, and Rome’s Leonardo Da Vinci Airports have been sold to private owners.
2
Yan and Oum(2014) argue that in corrupt environments, bureaucrats have no strong incentives to pursue mandated tasks, leading to a loss of productivity for publicly owned airports.
3
Dal Bó and Rossi(2007) argue that corrupt countries are strongly associated with more inefficient firms (public and private) in the sense that firms employ more inputs to produce a given level of output.
contribute to both the literature on the influence of corruption on economic performance at the micro level and the literature on the efficiency of airports.
We use airports located in Europe to investigate our research question. The corruption levels of European organizations are relatively lower compared with the rest of the world; however evidence shows that corruption remains a major concern in the European countries. Empirical findings of Hessami (2014) suggest that corruption in the broad sense of use of government office for private benefit is an issue in OECD countries and is not limited to low-income countries. Furthermore, the OECD (2014) reports that bribes are not just a problem for developing world: bribes are being paid to officials from countries at all stages of economic development. The report also reveals that bribes are usually paid to win public contracts from western organizations and most bribe payers and takers are from wealthy countries.
The airport industry in Europe is not free from corruption scandals; for instance, the New York Times reported that a $183 million airport project in Spain has become a symbol of the "wasteful spending that has sunk Spain deep into the recession and the banking crisis".4
Corruption was also exposed in the reconstruction of Terminal 2 at Germany’s Frankfurt Airport in 1996.5 More recently in 2014, bribery scandals hit the airport of Berlin Brandenburg
(BER); bribes were suspected to have been paid by firms wanting to secure airport contracts.6
We use an unbalanced panel data set consisting of 47 major airports from 27 European coun-tries during the 2003-2009 period to empirically investigate the impacts of corruption on oper-ating efficiency. Our main corruption measure is the country-level International Country Risk Guide (ICRG) corruption index.7 The residual (or net) variable factor productivity purchased
from the Air Transport Research Society (ATRS) is used as measure of airport operating effi-ciency. We find that corruption lowers airport managerial efficiency; and the impacts depend on the airport ownership form. Our results confirm the previous findings that privately owned airports, including majority and fully private ownership, are generally more efficient than ma-jority and/or fully government owned airports. However, privately owned airports operate less efficiently than their publicly owned counterparts in high corruption environment. We control for the form of regulation prevalent across European airports, levels of competition, airport characteristics, and potential shocks that may affect airport efficiency during the 2003-2009 period. Our empirical results withstand several robustness checks including different control
4
The management of the airport of Castellón has been questioned since the airport has not received a single scheduled flight since its inauguration in 2011. See The New York Times (July 19, 2012): "In Spain, a symbol of ruin at an airport to Nowhere"
5
See The Financial Times (July 2, 1996): "German Airport Corruption Probe Deepens: Five Jailed and 20 Companies under Investigation" and Reuters Business Report (September 25, 1996): "German corruption wave prompts action", reported inRose-Ackerman(1999).
6For more information, see The Local: Germany’s news in English (May 28, 2014): "Bribery probe hits
Berlin’s scandal airport".
7Similar as in Dal Bó and Rossi (2007), we use the ICRG corruption index as our main measure of
corruption. The index possesses the advantages of transitivity compared with other indices including World Bank corruption index and/or Transparency International corruption index.
variables, three alternative corruption measures: International Country Risk Guide (ICRG) corruption index, Corruption Perception Index (CPI) and Control of Corruption Index (CCI) and change in the ownership categories.
1.2
Literature Review
Corruption influences economic performance at both macro and micro levels. The impacts of corruption on economic performance at the macro level are considered in Shleifer and Vishny (1993); Mauro (1995); Ades and Di Tella (1999); Wei (2000); Habib and Zurawicki
(2002); Sanyal and Samanta (2008); Halkos and Tzeremes (2010). These studies reveal that corruption negatively affects investment and economic growth.
With respect to the effect of corruption on firm-level performance,Murphy et al.(1990,1993) show that corruption generates social losses because it props up inefficient firms and drives the allocation of talent, technology and capital away from the socially most productive uses.
Dal Bó and Rossi(2007) investigate the role of corruption among the determinants of the effi-ciency of electricity distribution firms. Their theoretical model states that corruption increases the factor requirements of firms, as it diverts managerial effort away from factor coordination. They empirically find that more corruption in the country is strongly associated with more inefficient firms, and the magnitude of the effects of corruption is considerable. Fisman and Svensson (2007) empirically find that firm growth is negatively correlated to both rate of tax-ation and bribery. Their results reveal that corruption delays the development process to a much greater extent than taxation. Wren-Lewis (2013) confirms these findings, but argues that the participation of an independent regulatory agency reduces the correlation between corruption and efficiency.
For the aviation industry, Yan and Oum (2014) theoretically investigate the effects of local government corruption on the cost of providing public goods, and find that the impact of cor-ruption is contingent on the governance structure and institutional arrangements of airports. Based on US commercial airports, they empirically confirm their theoretical predictions that corruption lowers airport productivity and increases the ratio of non-labor variable input to labor input of airports. The differences in the effects of corruption between airport authorities and airports managed by local government are due to the internal organization structure such as decision-making and managers’ autonomy to allocate resources. As a result, governance restructuring, which consists of transferring airport management from a local government to an airport authority may not necessarily lead to efficiency gains in corrupt environments.
Yan and Oum (2014) limit their analysis to the US commercial airports. The US airports are subject to specific governance structure; they are mostly owned, managed and operated by local governments either as government branches or via airport authorities. Since the first privatization of British Airports Authority in 1987, airport governance restructuring
has proliferated elsewhere in the world. The goal of our paper is to extend and confirm the findings of Yan and Oum (2014) to include other forms of ownership and governance. Airports in Europe are chosen to test the impact of corruption on efficiency of fully and partially privatized airports.
Literature on airport efficiency identifies three different performance and productivity analysis methods for airports. These approaches include productivity Index Number method, Data Envelopment Analysis (DEA) and Stochastic Frontier Analysis (SFA). The multilateral index number method, the consistency of which with neoclassical theory of the firm first established by Caves et al. (1982), uses total factor productivity (TFP) as measure of efficiency. TFP is defined as the ratio of output index to input index, and is easy to compute if firms use single inputs to provide single outputs. However, airports utilize multiple inputs such as labor, capital, and other resources to produce multiple services for both airlines and passengers. Similar as in Oum et al. (2006) and Obeng et al. (1992), the multilateral index number method proposed by Caves et al. (1982) can be used to aggregate inputs and outputs.8 In
the past, many studies includingHooper and Hensher(1997) andNyshadham and Rao(2000) have used TFP approach to evaluate airport performance.
Data envelopment analysis (DEA) is a non-parametric frontier method firstly proposed by
Charnes et al. (1978). Based on linear programming method, DEA evaluates efficiency scores for firms (or Decision Marking Units) relative to an efficiency frontier, which is formed by enveloping the data on the frontier. While DEA assumes the continuity and convexity of the production possibility set, it allows for using physical measures of capital inputs such as terminal size, number and/or length of runway as approximation of capital inputs.9 Some
applications of DEA to the aviation industry can be found in Gillen and Lall (1997); Adler and Berechman (2001);Martín-Cejas (2002);Abbott and Wu(2002);Pels et al.(2001,2003);
Barros and Sampaio (2004).
Stochastic Frontier Analysis (SFA) is a parametric approach that uses regression equation to assess efficiency. Firstly developed byAigner et al. (1976) and Meeusen and Van den Broeck
(1977), SFA explains output as a function of inputs and a stochastic disturbance, which consists of two parts: a stochastic inefficiency and a traditional "noise term". For the case of estimating production (cost) function the former is always negative (positive). Similar to DEA, SFA assumes the continuity and convexity of the production possibility set. SFA further assumes a particular form of inefficiency distribution and involves a specification of frontier function, which enables it to conduct hypothesis tests and distinguish the sources of efficiency growth. Tsionas (2003); Pestana Barros (2009); Marques and Barros (2010); Brissimis et al.
(2010); Suzuki et al. (2010) are among the many SFA applications. Liebert and Niemeier 8
TFP assumes that firms are under constant returns to scale and are allocatively efficient. However, TFP requires input and output prices and quantities that are not always available.
9
(2010) provide an interesting review of all three approaches. The TFP approach is chosen for the purposes of this study.
1.3
Methodology
To investigate the effect of corruption on airport efficiency, a two-stage procedure is used. The first stage considers the multilateral index number approach to evaluate the residual (or net) variable factor productivity (rvfp) − our measure of airport operating efficiency. The second stage specifies a regression analysis that explains airport efficiency as a linear function of corruption index and a set of business environmental factors.
1.3.1 Residual (or net) variable factor productivity (rvfp)
The residual (or net) variable factor productivity (rvfp) computed by Air Transport Research Society (ATRS, 2011) is used as measure of airport true managerial efficiency. To obtain the residual (or net) variable factor productivity (rvfp), we first compute the variable factor productivity (vfp) index, which is defined as the ratio of aggregate outputs to aggregate inputs. Since airports utilize multiple inputs to produce multiple outputs, we apply the multilateral index number method, devised by Caves et al. (1982) to aggregate the inputs and outputs. The number of aircraft movements (ATMs), passenger volumes and non-aeronautical revenues are considered to aggregate outputs.10 It is noteworthy that demand for non-aeronautical
services is closely related and complementary to that for aeronautical services (Oum et al.,
2006). Moreover, the non-aeronautical revenues account for a large and increasing portion of airport revenues.11 Thus, we need to include non-aeronautical revenues among aggregate
outputs in order to circumvent serious bias in measuring airport operating efficiency.
With respect to inputs, airports utilize multiple resources including labor input, purchased goods and materials, and purchased services (outsourcing and contracting out) to produce multiple services for airlines and passengers. Labor input is defined as the full-time equivalent number of employees directly paid for by the airport operators. The outsourced services for goods, services, and materials purchased directly by an airport are combined with all other inputs to form a so-called "soft-cost input". We note that our efficiency measure does not consider capital inputs. It is almost impossible to assess capital inputs and expenditures accurately on a comparable basis. Besides, capital costs are usually quasi-fixed during a long-term period while the vfp accounts for a short and/or medium term period.
10Air cargo services are generally handled by airlines, third-party cargo handling companies and others,
which lease space and facilities from airports. Air cargo services are not considered as a separate output in this research, as airports derive a very small percentage of their income from direct service related to air cargo
11
On average, the non-aeronautical activities including concessions, car parking, and numerous other services account for about half of the total airport’s revenue in our sample.
The residual (or net) variable factor productivity (rvfp) is obtained by using a regression analysis, which consists of removing the effects of factors that cannot be controlled by airport managers at least in the short to medium term from the vfp index. These factors include the percentage of international passengers, cargo share, capacity constraint, average aircraft size, airport size and different macroeconomic shocks. The residual of the variable factor productivity index is deemed as more accurate for this research.
1.3.2 Econometric model
In the econometric section, we estimate a model that explains airport efficiency, measured by the residual (or net) variable factor productivity (rvfp) as a linear function of a set of potential business environmental variables. These variables include the country-level corruption index of the airport (CIit), the airport’s ownership form (OF0it), an interaction between ownership
and corruption, and a set of control variables (Xit). When the data structure is a sample of
airports observed over several time periods (a panel dataset), the regression equation reads: rvf pit= α + λCIit+ OF0itβ + (CIit× OF0it)γ + X
0
itδ + εit (1.1)
where rvfpit represents the residual (or net) variable factor productivity of airport i at time
t. CIit corresponds to the country-level corruption index (CI) of airport i at time t and OF0it
the ownership form. We include an interaction between the corruption index and ownership form, (CIit× OF0it) to capture the effects of corruption under different types of ownership.
X0it denotes a set of control variables that potentially affect airport efficiency in addition to corruption, including the form of economic regulation that is prevalent across Europe, the level of competition across gateways and within the catchment area, whether the airport is used as airline hub and/or international gateway, whether the airport belongs to a group from a managerial perspective, and gross domestic product (GDP) per capita. Another set of controls including indicators of institutional quality variables, a proxy of openness to trade and a measure of the importance of government in the economy are added to test the robustness of our results.12 ε
it refers to an independent and identically distributed error term over the
airport i and time t dimensions; α is the regression’s intercept. The parameters λ, β, γ, δ represent the marginal effects of the explanatory variables.
Given the panel structure of the equation, we estimate both pooled Ordinary Least Squares (OLS) and airport/time-specific random effects (RE) models. The pooled OLS model assumes common intercepts and slopes across airports and periods, and it produces consistent estimates when the data are poolable.13 The random effects (RE) model assumes the intercept α as being
a random component. When appropriate, the RE estimator is usually better at capturing the
12
These variables are largely recognized in the literature as having a strong relationship with corruption.
13
Checking the poolability assumption requires a sample size that allows running individual time-series regressions or cross-sectional yearly regressions, seeHsiao(1986, Chapter 2) . In our case, the lack of degrees of freedom prevented us to perform individual time-series regressions.
individual and time heterogeneity and it can strongly improve the fit as compared to the pooled OLS model. Our econometric analysis also applies statistical tests that check the violation of fundamental hypotheses of the standard regression model (heteroscedasticity, autocorrelation and cross-sectional dependencies), which alters inference. We apply the required corrections when needed. Other tests are also conducted to compare the competing models and select the most appropriate one from a statistical viewpoint.
1.4
Data description
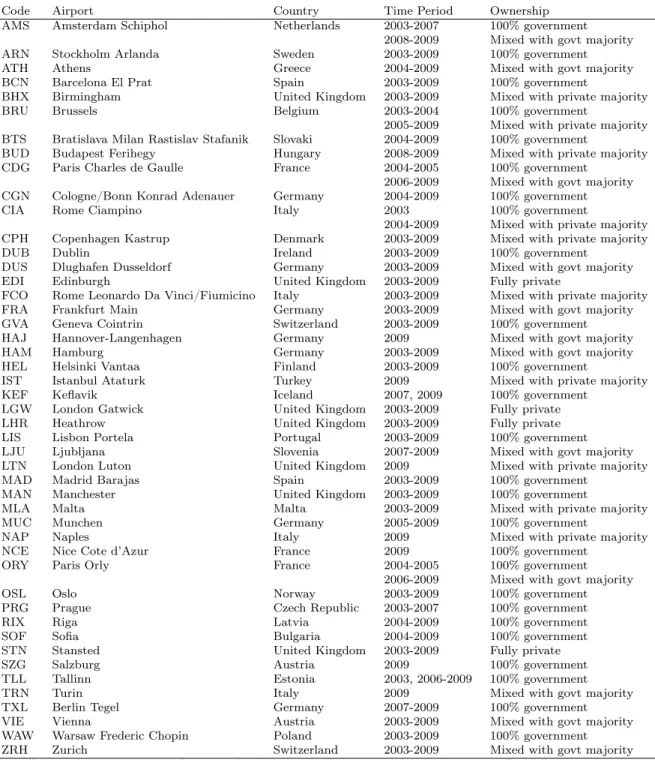
We compile data from 47 airports located in 27 European countries during the 2003-2009 pe-riod. The airport data comes from various sources including the International Civil Aviation Organization (ICAO), Airport Council International (ACI), International Air Transport As-sociation (IATA) and airport annual reports. Some of the data was obtained directly from the airports. Table 1.1lists the airports included in the sample as well as the form of ownership that governs each airport during the 2003-2009 period.
Among the sample of 47 airports during the 2003-2009 period, 5 were fully private, 7 were owned and/or operated by mixed public-private enterprises with private majority, 9 were owned and/or operated by mixed public-private enterprises with government majority, and 21 were owned and/or operated or by 100% government (or public corporations). Five airports including Amsterdam Schipohl (AMS), Brussels (BRU), Rome Ciampino (CIA), Paris Charles de Gaulle (CDG) and Paris Orly (ORY) have experienced ownership and management restruc-turing during the period of concern. These airports were traditionally fully owned, managed and operated by governments. The majority of stakes of Rome Ciampino and Brussels air-ports were sold to private sector interests in 2004 and 2005, respectively. The management and ownership of Paris Charles de Gaulle, Paris Orly and Amsterdam Schiphol airports were transferred to mixed private-public enterprises with government majority in 2006, 2006 and 2008, respectively.
Table 1.1 – List of airports
Code Airport Country Time Period Ownership
AMS Amsterdam Schiphol Netherlands 2003-2007 100% government
2008-2009 Mixed with govt majority
ARN Stockholm Arlanda Sweden 2003-2009 100% government
ATH Athens Greece 2004-2009 Mixed with govt majority
BCN Barcelona El Prat Spain 2003-2009 100% government
BHX Birmingham United Kingdom 2003-2009 Mixed with private majority
BRU Brussels Belgium 2003-2004 100% government
2005-2009 Mixed with private majority
BTS Bratislava Milan Rastislav Stafanik Slovaki 2004-2009 100% government
BUD Budapest Ferihegy Hungary 2008-2009 Mixed with private majority
CDG Paris Charles de Gaulle France 2004-2005 100% government
2006-2009 Mixed with govt majority
CGN Cologne/Bonn Konrad Adenauer Germany 2004-2009 100% government
CIA Rome Ciampino Italy 2003 100% government
2004-2009 Mixed with private majority
CPH Copenhagen Kastrup Denmark 2003-2009 Mixed with private majority
DUB Dublin Ireland 2003-2009 100% government
DUS Dlughafen Dusseldorf Germany 2003-2009 Mixed with govt majority
EDI Edinburgh United Kingdom 2003-2009 Fully private
FCO Rome Leonardo Da Vinci/Fiumicino Italy 2003-2009 Mixed with private majority
FRA Frankfurt Main Germany 2003-2009 Mixed with govt majority
GVA Geneva Cointrin Switzerland 2003-2009 100% government
HAJ Hannover-Langenhagen Germany 2009 Mixed with govt majority
HAM Hamburg Germany 2003-2009 Mixed with govt majority
HEL Helsinki Vantaa Finland 2003-2009 100% government
IST Istanbul Ataturk Turkey 2009 Mixed with private majority
KEF Keflavik Iceland 2007, 2009 100% government
LGW London Gatwick United Kingdom 2003-2009 Fully private
LHR Heathrow United Kingdom 2003-2009 Fully private
LIS Lisbon Portela Portugal 2003-2009 100% government
LJU Ljubljana Slovenia 2007-2009 Mixed with govt majority
LTN London Luton United Kingdom 2009 Mixed with private majority
MAD Madrid Barajas Spain 2003-2009 100% government
MAN Manchester United Kingdom 2003-2009 100% government
MLA Malta Malta 2003-2009 Mixed with private majority
MUC Munchen Germany 2005-2009 100% government
NAP Naples Italy 2009 Mixed with private majority
NCE Nice Cote d’Azur France 2009 100% government
ORY Paris Orly France 2004-2005 100% government
2006-2009 Mixed with govt majority
OSL Oslo Norway 2003-2009 100% government
PRG Prague Czech Republic 2003-2007 100% government
RIX Riga Latvia 2004-2009 100% government
SOF Sofia Bulgaria 2004-2009 100% government
STN Stansted United Kingdom 2003-2009 Fully private
SZG Salzburg Austria 2009 100% government
TLL Tallinn Estonia 2003, 2006-2009 100% government
TRN Turin Italy 2009 Mixed with govt majority
TXL Berlin Tegel Germany 2007-2009 100% government
VIE Vienna Austria 2003-2009 Mixed with govt majority
WAW Warsaw Frederic Chopin Poland 2003-2009 100% government
ZRH Zurich Switzerland 2003-2009 Mixed with govt majority
Note: "Mixed with govt majority" denotes "Mixed public-private with government majority" and "Mixed with private majority" denotes "Mixed public-private with private majority".
1.5
Description of variables
1.5.1 Variables in the efficiency analysis
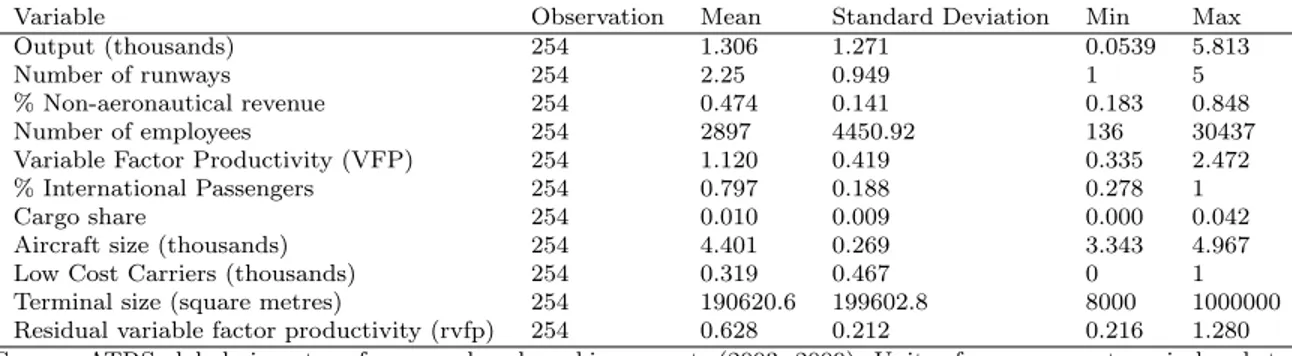
Details on the variables used for the efficiency analysis are summarized in Table 1.2. The output variables include the number of aircraft movements (ATMs), passenger volumes and non-aeronautical revenues. As for input variables, labor input, purchased goods and materials and purchased services (outsourcing and contracting out) are considered.
Table 1.2 – Descriptive statistics of the variables used in the airport efficiency analysis
Variable Observation Mean Standard Deviation Min Max
Output (thousands) 254 1.306 1.271 0.0539 5.813
Number of runways 254 2.25 0.949 1 5
% Non-aeronautical revenue 254 0.474 0.141 0.183 0.848
Number of employees 254 2897 4450.92 136 30437
Variable Factor Productivity (VFP) 254 1.120 0.419 0.335 2.472
% International Passengers 254 0.797 0.188 0.278 1
Cargo share 254 0.010 0.009 0.000 0.042
Aircraft size (thousands) 254 4.401 0.269 3.343 4.967
Low Cost Carriers (thousands) 254 0.319 0.467 0 1
Terminal size (square metres) 254 190620.6 199602.8 8000 1000000
Residual variable factor productivity (rvfp) 254 0.628 0.212 0.216 1.280
Source: ATRS global airport performance benchmarking reports (2003- 2009). Units of measurement are in brackets.
1.5.2 Variables in the econometric analysis
Measures of corruption
Corruption, our main variable of interest, is defined as the misuse of public office for private gain (Svensson, 2005). We consider three indices of corruption drawn from three different sources: the corruption index computed by International Country Risk Guide (ICRG), Cor-ruption Perception Index (CPI) provided by Transparency International and the Control of Corruption Index (CCI) delivered by the World Bank.14 All three indices are survey-based.
The ICRG corruption index captures the likelihood and the expectations that government officials will demand special payment in the form of "bribes connected with import and export licenses, exchange controls, tax assessment, police protection, or loans". Drawn from indica-tors assembled by panels of inte rnational experts, it evaluates corruption mainly within the political system. ICRG corruption index allows for comparison across countries and over time, therefore it is particularly well suited to our main objective. Besides, the ICRG corruption index is widely used in the economics literature (see for example, Knack and Keefer (1995),
14
This analysis focuses on country-level corruption. The subjective indices, which are derived from fully convincing methodology, provide satisfactory country coverage during the 2003-2009 time period. In addition, the corruption perception surveys are relatively well suited to compare countries in terms of corruption because the sources all aim at measuring the degree of corruption, using identical methodology. Mauro(1995) and
Dal Bó and Rossi (2007)). The original index ranges between zero (highly corrupt) and six (highly clean); so a higher corruption index corresponds to a less corrupt country.
Both CPI and CCI are composite indices. While CPI looks at corruption in the public sector, CCI considers corruption in both public and private sectors. CPI corresponds to the average of ratings reported by a number of perception-based sources and business surveys15 carried
out by a variety of independent and reputable institutions. However, CCI is drawn from a large set of data sources including a diverse variety of survey institutes, think tanks, and non-governmental and international organizations. Contrary to ICRG corruption index, CCI and CPI lack "transitivity". Their country rankings can change substantially as one adds or drops one or more countries from the sample.16 The original CPI scores countries on a scale from
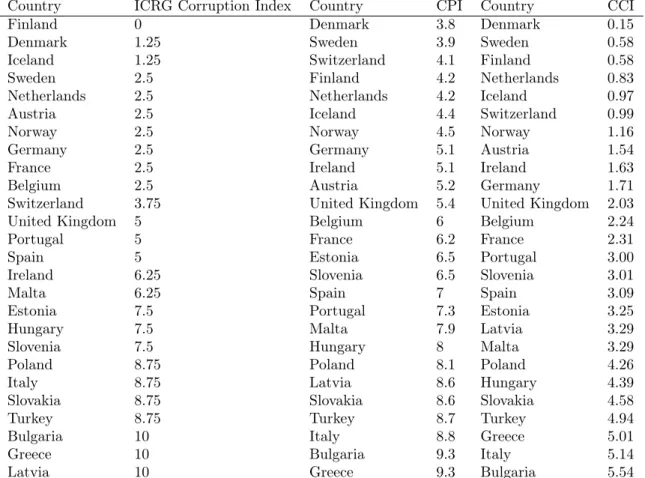
zero (highly corrupt) to ten (highly clean) while the original CCI scores range from -2.5 (highly clean) to 2.5 (highly corrupt). Since it is not meaningful to compare original scores generated by each source, the corruption scores are rescaled between 0 and 10 by setting the value for the most corrupt country at 10 and the least corrupt country at 0. Table 1.3 compares the three alternative corruption indices in 2009.
The country rankings and corruption scores are compared across the three sources. Regardless of the methodology used, Finland, Denmark, Sweden, the Netherlands and Iceland are the cleanest countries in our sample whereas Bulgaria, Greece, Italy, Turkey and Slovakia are the most corrupt countries. The country rankings in the top and bottom ranges of the scores are quite robust with respect to the methodology. By contrast, the country rankings in the middle ranges including Italy, Ireland and Poland rankings are more sensitive to the source used. Nonetheless, the three corruption indices are highly correlated with each other.17 The
correlation between CCI and CPI is the highest, indicating that both indices yield rather similar country rankings.
Ownership form
The applied literature has established the influence of the ownership form on airports’ operat-ing efficiency. We explore this findoperat-ing for European airports by includoperat-ing the ownership form of airport i at time t in the model. We observe 4 types of ownership in our sample of airports including (1) fully private ownership (2) mixed public-private ownership with private major-ity (above 50%) (3) mixed public-private ownership with government majormajor-ity (above 50%) (4) 100% government or public corporation ownership. However, due to the limited data, we
15
The surveys include questions relative to the misuse of public power for private benefits such as bribery by public officials, kickbacks in public procurement, embezzlement of public funds.
16For more details on the methodology used by World Bank and Transparency International to compute
CCI and CPI scores, readers can refer to http://www.worldbank.org and http://www.transparency.org. We note that Transparency International has improved its methodologies to compute CPI index since 2012 in order to allow for comparison over times.
17The correlation coefficients between ICRG index and CPI, ICRG index and CCI and CCI and CPI are
Table 1.3 – Corruption Indices of the sample of countries - 2009
Country ICRG Corruption Index Country CPI Country CCI
Finland 0 Denmark 3.8 Denmark 0.15
Denmark 1.25 Sweden 3.9 Sweden 0.58
Iceland 1.25 Switzerland 4.1 Finland 0.58
Sweden 2.5 Finland 4.2 Netherlands 0.83
Netherlands 2.5 Netherlands 4.2 Iceland 0.97
Austria 2.5 Iceland 4.4 Switzerland 0.99
Norway 2.5 Norway 4.5 Norway 1.16
Germany 2.5 Germany 5.1 Austria 1.54
France 2.5 Ireland 5.1 Ireland 1.63
Belgium 2.5 Austria 5.2 Germany 1.71
Switzerland 3.75 United Kingdom 5.4 United Kingdom 2.03
United Kingdom 5 Belgium 6 Belgium 2.24
Portugal 5 France 6.2 France 2.31
Spain 5 Estonia 6.5 Portugal 3.00
Ireland 6.25 Slovenia 6.5 Slovenia 3.01
Malta 6.25 Spain 7 Spain 3.09
Estonia 7.5 Portugal 7.3 Estonia 3.25
Hungary 7.5 Malta 7.9 Latvia 3.29
Slovenia 7.5 Hungary 8 Malta 3.29
Poland 8.75 Poland 8.1 Poland 4.26
Italy 8.75 Latvia 8.6 Hungary 4.39
Slovakia 8.75 Slovakia 8.6 Slovakia 4.58
Turkey 8.75 Turkey 8.7 Turkey 4.94
Bulgaria 10 Italy 8.8 Greece 5.01
Greece 10 Bulgaria 9.3 Italy 5.14
Latvia 10 Greece 9.3 Bulgaria 5.54
Notes: ICRG Corruption Index is the International Country Risk Guide’s corruption indicator (average over 12 months). CPI is the Corruption Perception Index computed Transparency International and CCI compute the Control of Corruption Index by the World Bank. ICRG, CPI and CCI scores are rescaled so that each index ranges between 0 and 10, with a higher score indicating higher corruption and a lower score indicating lower corruption.
combine fully private ownership and mixed public-private ownership with private majority.18
Thus, we categorize ownership forms according to: (1) mixed public-private ownership with private majority (including fully private) (2) mixed public-private ownership with government majority (above 50%) (3) 100% government or public corporation ownership. Ownership forms are modelled with the help of dummy variables. We denote mixed public-private ownership with private majority as the reference category. We further enquire whether corruption has an effect that potentially depends on the ownership form by including interaction terms between corruption and ownership dummy variables.
18
Seven of our sampled airports are owned and operated by mixed enterprises with private majority (50%) and five are fully privatized airports.
Economic regulation and competition
Previous research has found that competition and economic regulation, individually or jointly affect airport efficiency (Chi-Lok and Zhang,2009;Malighetti et al.,2009;Scotti et al.,2012;
Adler and Liebert,2014). Regarding economic regulation, airports in Europe are traditionally subject to rate of return or cost-based regulation. More recently there has been a trend towards implementing a form of incentive regulation - the price-cap regulation- when airports are privatized or semi-privatized (Gillen and Niemeier, 2006). Both cost-based and price cap regulations can be set under a single or dual till regime.19 FollowingAdler and Liebert(2014),
we classify the forms of airport economic regulation according to (1) no ex-ante regulation (2) single-till cost-plus regulation (3) dual-till cost-plus regulation (4) single-till price-cap regulation (5) dual-till price-cap regulation (6) charges set by airports (single and dual till). The proxy of airport competition is defined in line with Adler and Liebert (2014). The variable is based on the number of commercial airports with at least 150 000 passengers per annum within a catchment area of 100 km around the airport. Two levels of competition are considered: strong and weak. An airport is assumed to be facing weak competition at the regional level if there is no more than one additional airport within the catchment area, and strong competition if there are at least two additional airports within the catchment area. In addition, a hub airport that serves as a regional or international gateway is classified as facing strong competition, regardless of its local catchment area. Due to the lack of information, we are not able to account for different product diversification strategies such as low cost carrier traffic. As Adler and Liebert (2014) pointed out, this measure of competition only indicates an upper level of likely competition across airports.
Airport characteristics
We include a set of control variables that capture the major characteristics of our sample of airports. These variables consist of the status of the airport as a hub and/or international gateway20, whether the airport belongs to a group from a managerial perspective, and the gross
domestic product (GDP) per capita. The controls are included in the model with the help of dummy variables. GDP per capita would capture time and country-specific macroeconomic factors such as productivity shocks. Details on variables used in the econometric analysis are summarized in Table 1 in the Appendix A.
19Czerny (2006) discusses the key difference between single-till and dual-till regulation. He argues that
with single-till the price-cap is set in anticipation of the revenues from aeronautical and commercial services. The dual-till approach, in contrast, tries to separate out the two airport business branches, particularly by attributing specified portions of airports’ costs to aeronautical and commercial branches.
20
Hub airports may possess advantages in terms of efficiency because of their size and location, therefore we include a dummy variable to capture the status of the airport as an international and/or regional hub.
1.6
Empirical results
The first part consists of a discussion on airport efficiency results. In the second part, we analyze the impacts of corruption and other factors on the airport operating efficiency.
1.6.1 Estimates from the efficiency analysis
This study uses the residual (or net) variable factor productivity as a measure of airport operating efficiency. Efficiency scores of the sample of airports are listed in Table 1.4.
The scores vary from 0.216 (the least efficient) to 1.28 (the most efficient). The average efficiency score goes from 0.616 in 2003 to 0.613 in 2009, with around 42% of all airports categorized as relatively efficient. Except for Brussels airport (BRU), none of the airports in the sample consistently improved their efficiency over time. Between 2003 and 2009, Brussels increased its score from 0.639 to 0.906. The private sector participation in the management and ownership of Brussels airport in 2005 may contribute to consistently maintain its improvement in terms of efficiency.
Amsterdam (AMS), Dublin (DUB), Stockholm (ARN) and Helsinki (HEL) airports enhanced their efficiencies between 2003 and 2004, but consistently exhibit an efficiency decrease between 2004 and 2009. By contrast, Paris Charles de Gaulle (CDG), Rome Fiumicino (FCO), Gatwick (LGW), Manchester (MAN), Paris Orly (ORY), Stansted (STN), Vienna (VIE) and Warsaw (WAW) airports appear to have relatively constant efficiency scores between 2003 and 2009. For some airports including Amsterdam, Paris Charles de Gaulle and Paris Orly, the minor participation of private sectors in the airport management and ownership does not necessarily lead to efficiency gains. Copenhagen airport (CPH) is found as the most efficient airport among the sample of European airports between 2003 and 2009, with an average operating efficiency of 1.007. The top performers during the 2003-2009 period include Istanbul (IST), Oslo (OSL), Barcelona (BCN) and Madrid (MAD), with average efficiency scores of 0.985, 0975, 0.936 and 0.924, respectively. The airports of Cologne-Bonn (CGN), Munich (MUC), Berlin (TXL), Bratislava (BTS), Riga (RIX) and Sofia (SOF), by contrast, appear to be the least relatively efficient airports in the sample, with average scores less than 0.4. Cologne-Bonn suffers from excess airside capacities despite the extensive cargo operations resulting from its position as the European hub for Germanwings, FedEx Express and UPS Airlines (Adler and Liebert,2014).
1.6.2 Econometric results
Statistical tests show that the Random Effect (RE) model is the most appropriate, and its Pooled OLS counterpart delivers similar results without providing efficiency gains in the
es-Table 1.4 – Residual (or net) variable factor productivity (rvfp) efficiency scores Airport 2003 2004 2005 2006 2007 2008 2009 AMS 0.763 0.921 0.827 0.758 0.743 0.720 0.651 ARN 0.789 0.984 0.641 0.643 0.694 0.509 0.426 ATH - 1.244 0.715 0.774 0.719 0.769 1.059 BCN 0.828 1.051 0.959 0.924 1.101 1.032 0.655 BHX 0.948 0.655 0.713 0.668 0.643 0.646 0.675 BRU 0.639 0.670 0.783 0.790 0.803 0.888 0.906 BTS - 0.329 0.402 0.341 0.309 0.359 0.391 BUD - - - 0.578 0.457 CDG - 0.735 0.720 0.694 0.834 0.769 0.709 CGN - 0.284 0.297 0.309 0.284 0.306 0.328 CIA 0.932 0.779 0.794 0.802 0.849 0.684 0.691 CPH 0.872 0.931 0.817 1.280 1.128 0.984 1.040 DUB 0.497 0.855 0.793 0.745 0.746 0.696 0.618 DUS 0.573 0.506 0.433 0.395 0.402 0.402 0.406 EDI 0.486 0.582 0.560 0.544 0.668 0.851 0.750 FCO 0.630 0.583 0.547 0.663 0.712 0.607 0.626 FRA 0.393 0.496 0.471 0.421 0.450 0.398 0.352 GVA 0.715 0.749 0.783 0.847 0.824 0.944 0.903 HAJ - - - 0.727 HAM 0.350 0.495 0.496 0.503 0.474 0.503 0.508 HEL 0.520 0.610 0.600 0.558 0.494 0.431 0.391 IST - - - 0.985 KEF - - - - 0.326 - 0.627 LGW 0.565 0.639 0.596 0.492 0.635 0.562 0.518 LHR 0.548 0.612 0.550 0.390 0.519 0.419 0.416 LIS 0.569 0.596 0.700 0.741 0.726 0.966 0.663 LJU - - - - 0.540 0.611 0.657 LTN - - - 0.658 MAD 0.772 0.980 0.936 0.889 1.116 1.073 0.704 MAG 0.541 0.544 0.477 MAN 0.511 0.746 0.518 0.512 0.577 0.515 0.511 MLA 0.443 0.505 0.557 0.536 0.514 0.561 0.587 MUC - - 0.339 0.345 0.324 0.330 0.310 NAP - - - 0.654 NCE - - - 0.849 ORY - 0.445 0.365 0.419 0.547 0.502 0.473 OSL 0.760 0.709 0.963 1.067 1.059 1.150 1.116 PRG 0.432 0.425 0.822 0.511 0.490 - -RIX - 0.216 0.325 0.388 0.432 0.382 0.462 SOF - 0.322 0.375 - - 0.422 0.401 STN 0.670 0.747 0.710 0.587 0.649 0.642 0.619 SZG - - - 0.502 TLL 0.436 - - 0.477 0.472 0.475 0.568 TRN - - - 0.609 TXL - - - - 0.389 0.329 0.314 VIE 0.490 0.503 0.527 0.537 0.495 0.536 0.557 WAW 0.387 0.487 0.456 0.454 0.483 0.422 0.355 ZRH 0.732 0.784 0.786 0.891 0.858 0.892 0.961
timates.21 We notice in Table 1.5 that the RE model explains a much higher share of the
total variance of the dependent variable (R Squared) than the pooled OLS regression, and its Adjusted R Squared is much larger as well. Therefore, the RE model is superior in terms of within-sample goodness-of-fit. The Fisher tests accept the absence of time-fixed effects in both pooled OLS and RE models, indicating that no common significant shocks have affected the efficiency of European airports during the period of scrutiny.22
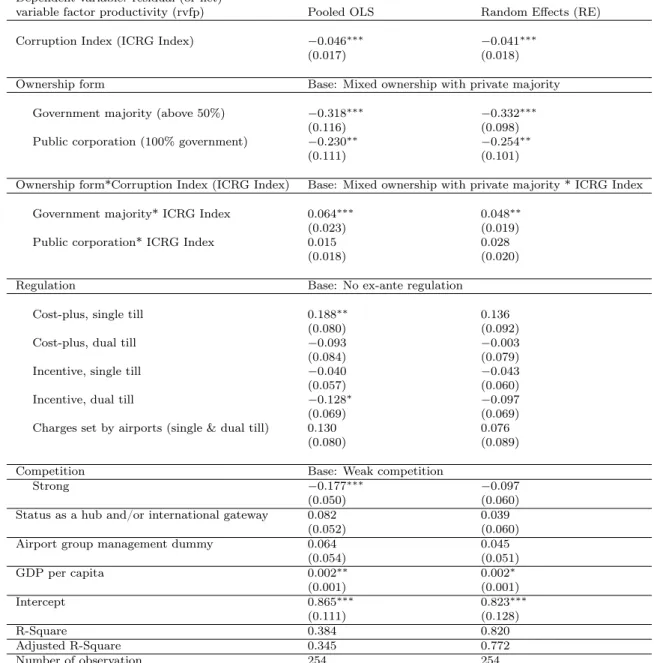
We report the estimation results from the pooled OLS model in column (2) of Table 1.5and the ones from the RE model in column (3). The estimation results from the RE model are used as the basis for our analysis. Given that both models display strong heteroscedasticity and autocorrelation in the residuals, robust standard errors are stated in parenthesis.23
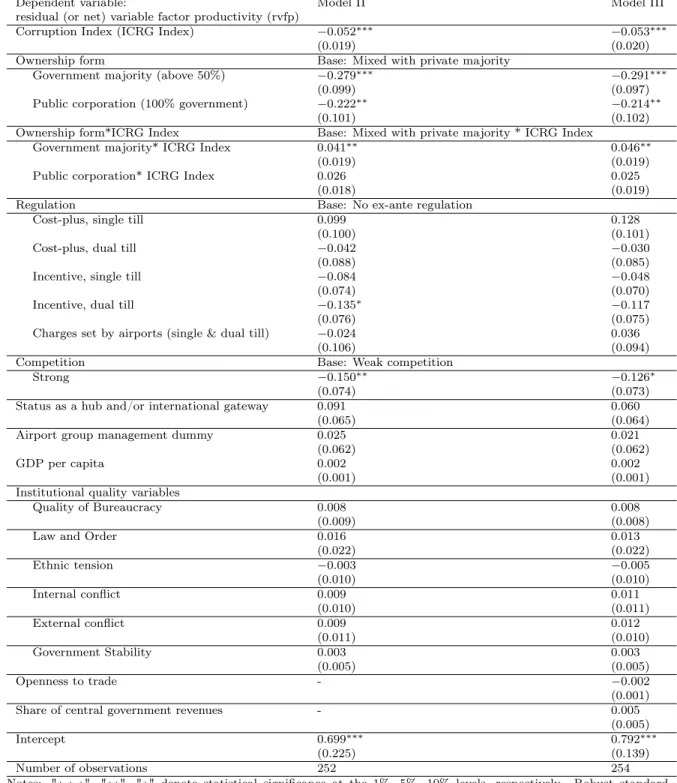
First, we notice that the partial effects of the main variables of interest - corruption, ownership and the interaction terms between corruption and ownership - are highly significant in the RE model and that the signs and magnitudes remain rather robust in the pooled OLS model. Given that the influence of corruption on airport operating efficiency depends on the ownership form, we ran a regression of rvfp on the corruption index, the ownership dummies and the business environmental factors without including the interaction terms in the regression. We found no significant effects of corruption on rvfp.24 This stresses the importance of accounting
for the interactions to uncover the effect of corruption on airport efficiency.
As shown in Table 1.5, the impact of corruption on airports’ efficiency is negative, and its effect is significant at the 1% level in both RE and pooled OLS specifications. This result suggests that corruption has a negative impact on airport efficiency under mixed public-private ownership with private majority (the default ownership category). Privately owned airports located in less corrupt countries operate more efficiently than the ones situated in more corrupt countries. An increase in one point25 in the corruption index decreases the residual (or net)
variable factor productivity of 0.04 units. This negative influence of corruption on efficiency is consistent with previous literature in other sectors (see for exampleDal Bó and Rossi(2007)). Indeed, corruption is found to lower productivity through a diversion of managerial efforts away from running productive activities. In a high corruption environment, airport managers would have more incentives to use bribes when they channel resources to establish lobbies and connections. Then, poor governance and culture of cronyism in highly corrupt countries spur managers of privately owned airports to focus less on airport productivity objectives, leading
21The Lagrangian Multiplier test for random effects displays a statistic of Fisher value of 161.32 and
asso-ciated p-value of 0.000, indicating that Random effects model is preferred to Pooled OLS.
22The statistics of Fisher (and their associated p-value) for Pooled OLS and RE models are 1.58 (0.174) and
6.91(0.329), respectively indicating that we cannot reject the null hypothesis that year effects are insignificant.
23We employ cluster-robust standard errors as recommended byWooldridge(2002). 24
We do not report here the estimation results for the sake of parsimony.
25
We need to be careful in the interpretation of these results. As pointed out byMauro(1995), when using perception indexes, it is not clear if the difference between the corruption grade of one and two is the same as between 4 and 5.