HAL Id: hal-01369500
https://hal.archives-ouvertes.fr/hal-01369500
Submitted on 23 Sep 2016
HAL is a multi-disciplinary open access
archive for the deposit and dissemination of
sci-entific research documents, whether they are
pub-lished or not. The documents may come from
teaching and research institutions in France or
abroad, or from public or private research centers.
L’archive ouverte pluridisciplinaire HAL, est
destinée au dépôt et à la diffusion de documents
scientifiques de niveau recherche, publiés ou non,
émanant des établissements d’enseignement et de
recherche français ou étrangers, des laboratoires
publics ou privés.
Remote Heartbeat Detection Using Microwave System
from Four Positions of a Normally Breathing Patient
Sarah El-Samad, Dany Obeid, Gheorghe Zaharia, Sawsan Sadek, Ghaïs El
Zein
To cite this version:
Sarah El-Samad, Dany Obeid, Gheorghe Zaharia, Sawsan Sadek, Ghaïs El Zein. Remote Heartbeat
Detection Using Microwave System from Four Positions of a Normally Breathing Patient.
Inter-national Journal on Communications Antenna and Propagation, Praise Worthy Prize, 2016, 6 (3),
�10.15866/irecap.v6i3.9281�. �hal-01369500�
International Journal on Communications Antenna and Propagation (IRECAP)
Remote Heartbeat Detection Using Microwave System from
Four Positions of a Normally Breathing Patient
Sarah El-Samad
1, 2, Dany Obeid
3, Gheorghe Zaharia
1, Sawsan Sadek
3, Ghaïs El Zein
1Abstract
– This paper presents a microwave system for the detection of the cardiopulmonaryactivity.Measurements are performed at different operational frequencies and from different sides of a healthy subject who is breathing normally while sitting at 1 meter from the system. Simultaneously with the microwave system, a PC-based electrocardiograph is used in order to validate the heartbeat rate detection. Cardiopulmonary signals are processed using wavelet transforms in order to extract the heartbeat signal. The obtained results upon using the proposed system show the ability of detecting the cardiopulmonary signals at four sides of the subject, and the signal processing techniques show high accuracy in extracting the heartbeat signal and the heartbeat rate.
Keywords:
Doppler radar, Electrocardiograph, Heartbeat rate, Microwave system, Noncontact detectionI.
Introduction
Contactless monitoring of vital signs is needed in medical surveillance applications and in healthcare [1], especially for burn patients where the use of the traditional electrodes to measure vital signals like cardiopulmonary signals is not possible. Due to the microwave sensitivity toward tiny movements, radar has been employed as a noninvasive monitoring system of human cardiopulmonary activity [2].
Several radar types are used for the vital signs detection like ultra-wideband (UWB) radars, frequency modulated continuous wave (FMCW) radars, and continuous wave (CW) Doppler radars. Each of these radar technologies can measure the Doppler shift and has its own advantages and disadvantages. UWB radar can detect range and breathing rate for one or more persons [3]. FMCW radar allows measuring distance of the detected subject [4], and can detect motion, but accuracy is a critical issue. It requires a 1.5 GHz bandwidth to achieve 10 cm resolution; hence they cannot meet the requirement of vital sign monitoring or small gesture classification. Recently, a technique based on coherent phase detection of the FMCW signal has partially solved this problem [4].
Although CW Doppler radar cannot detect range, it has been widely used due to its high precision in displacement’s measurement [2]. In addition, it is relatively immune to stationary clutter interference [5]. Various RF architectures have been proposed in the literature [6]. Each of them shows its specific advantage in certain environments. The first architecture is homodyne architecture. It is designed to eliminate the null detection problem of a single-channel Doppler radar.
The second one is the heterodyne architecture; it has the advantage over the homodyne architecture by its robustness against DC offset. The third one is the double side band; it is useful when designing vital sign radars operating at high frequencies such as millimeter wave or above.
On the other hand, several processing techniques are applied to isolate multiple subjects and clutter noise like blind source separation (BSS), passive RF tags [6] and curvelet transform [7]. Others are used to separate heartbeat from cardiorespiratory signals based on band-pass filters [8, 9] continuous-wavelet filters and ensemble empirical mode decomposition (EEMD) [10] and LMS adaptive harmonic cancellation algorithm [11]. Previous studies have shown the ability of detecting the heartbeat activity from the front side of the patient only. However, in practical cases, the patient can turn while sleeping. Also, detecting life signs for earthquake victims should be at any side of the person.
In this work, the heartbeat rate has been extracted at different frequencies from four positions for a person who breathes normally. To overcome the clutter and accuracy problems, CW Doppler radar is used. In order to validate the proposed measurement system and the selected signal processing technique, measurements were performed simultaneously with a PC-based electrocardiograph.
The rest of this paper is organized as follows: Section II describes the measurement system. Section III presents the signal processing techniques. Obtained results are summarized and discussed in Section IV. Finally, Section V gives some concluding remarks.
S. El-Samad, D. Obeid, G. Zaharia, S. Sadek, G. El Zein
II. Measurement System
For a Doppler radar, a continuous wave signal reflected from a target will be modulated by the target movement [3]. Indeed, based on the Doppler theory, a static target having a quasi-periodic movement will reflect a transmitted signal with its phase modulated by the target’s position and velocity [13]. When the target is a person’s chest, the reflected signal will contain information about the chest’s displacement; hence, it contains information for both breathing and heart beating. The relationship between the chest displacement x(t) and the phase variation (t) of S21 is:
∆Ɵ(𝑡) =4𝜋∆𝑥(𝑡)𝜆 (1)
where is the wavelength of the transmitted signal [14]. Theoretically, while holding the breath, the heartbeat activity causes a chest-wall motion between 0.2 and 0.5 mm. When breathing normally, a breach causes chest-wall motion between 4 and 12 mm. At rest, the frequency corresponding to breathing rate varies between 0.1 and 0.3 Hz, while the frequency corresponding to heartbeat rate varies 1 and 4 Hz [14]. For children over 3 years and adult people, the heartbeat frequency varies between 1 and 2 Hz.
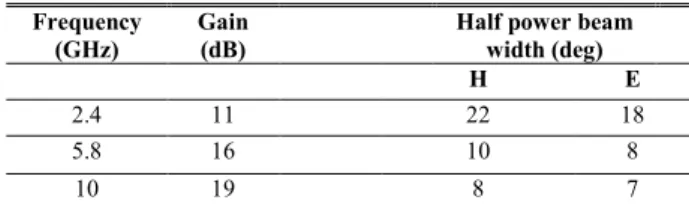
The heartbeat and respiration rates are extracted from the cardiopulmonary signal obtained upon using the proposed system. This system consists of a Vector Network Analyzer (VNA) (Agilent N5230A 4-Port) that operates at frequencies up to 20 GHz, and two horn antennas. The horn antennas used in this experiment are the Q-par Angus Ltd (model number WBH2-18HN/S) operating between 2 and 18 GHz. Their characteristics are summarized in Table I.
TABLEI ANTENNA CHARACTERISTICS Frequency (GHz) Gain (dB)
Half power beam width (deg)
H E
2.4 11 22 18
5.8 16 10 8
10 19 8 7
The overall system including the VNA, the antennas, and the PC-based ECG are presented in Fig. 1.
Fig. 1. Measurement setup
Using a VNA provides many advantages that allow: tuning both the operational frequency and the transmitted power, setting the sampling frequency of the signal and the measurement duration, and measuring several parameters including the time variation of the phase as well as the magnitude of the S parameters.
The proposed system has advantages over other systems by its ability of tuning the transmitted power and emitted signal frequency when performing measurements for the same person under test. Thus, the minimal transmitted power and the optimal operational frequency can be determined. Determining the minimal power is important for the safety of the patient and minimizes the risk of high radiation exposure. In addition, determining the optimal operational frequency helps obtaining the most accurate results for the final system. The frequencies of the transmitted CW signal chosen for this study are: 2.4 GHz (ISM S-band), 5.8 GHz (ISM C-band) and 10 GHz (X-C-band). The person under test is a 54-year-old sitting at a distance of 1m from the system and breathing normally. This distance is chosen as the measurement could be performed in a hospital room or in a medical office. In addition, from a technical point of view, this distance must not be increased in order to receive a signal with a large signal to noise ratio, able to ensure good accuracy of measurement results. The radiated power of the antenna depends on the transmitted power measured at the input of the transmit antenna and the gain of the antenna, as given in equation 2:
Pr (dBm) = Pt (dBm) + G (dB) (2) where Pr is the radiated power, Pt is the transmitted power, and G is the gain of the antenna. The radiated power is fixed at 0 dBm in order to limit the possible impact on the health patient and the medical staff. Therefore, using (2) and the antenna gain values given in Table I, the power of the transmitted signal is -11 dBm at 2.4 GHz, -16 dBm at 5.8 GHz and -19 dBm at 10 GHz. Table II summarizes the characteristics of the measurement setup.
TABLEII
CHARACTERISTICS OF THE MEASUREMENT SETUP
Characteristics Value Sweep time 30 s Measurement points 20,000 points Sampling frequency 666.7 Hz Radiated power 0 dBm
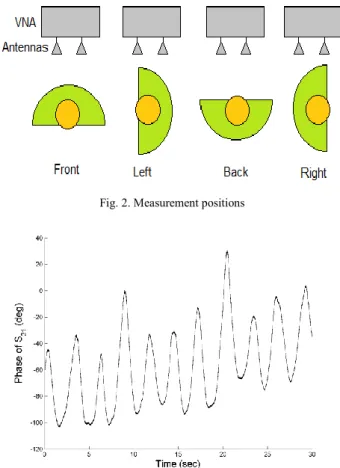
Each measurement lasts 30 seconds and is performed at four sides of the person under test: Front, Back, Left and Right sides. Fig. 2 represents all measurement’s
positions.
To validate the proposed system, radar system measurements are performed simultaneously with ECG measurements.
S. El-Samad, D. Obeid, G. Zaharia, S. Sadek, G. El Zein
Fig. 3 presents an example of the phase variation (deg) of S21 measured at 5.8 GHz and for a radiated power of 1 mW from the front side of the person. It shows 11 peaks over 30 seconds of observation window. These peaks are mainly due to the breathing frequency, which corresponds to about 0.33 Hz.
Fig. 2. Measurement positions
Fig. 3. Phase variation of S21 due to respiration and heart activity
measured at 5.8 GHz from the front side of the subject
III. Processing Techniques
As breathing causes larger chest-wall motion than heart beating, the phase variations of S21 will be larger for the former. Thus, an advanced signal processing technique is required in order to extract the heartbeat signal from the cardiopulmonary signal. According to the literature, several methods of signal processing show the ability of extracting the heartbeat signal from the measured cardiopulmonary signal such as classic filtering, fast Fourier transform (FFT) [9], short time Fourier transform (STFT) and wavelet transform. Classic filters are widely applied for the heartbeat extraction, but the variation of the heartbeat cannot be extracted due to the distortion obtained when applying classic filters. Fast Fourier transform rapidly converts a signal from time domain to frequency domain. Hence, the heartbeat signal is converted to frequency domain, and then the frequency corresponding to the rate of the heartbeats is extracted by
choosing the maximum amplitude between 0.8 and 3 Hz. FFT is not efficient because the frequency of the heartbeat changes over time, hence, the heart rate variability (HRV) cannot be extracted. In order to track the variation of the HR over time, the Short-Time Fourier Transform is proposed (STFT). This technique is based on applying the Fourier transform over portions of the signal, namely windows, instead of applying the Fourier transform over the whole signal. This allows analyzing the signal in time and frequency domain with a variable resolution according to the selected length of the window. Short window results in high resolution in time, and poor resolution in frequency, while large window results in poor resolution in time, but high resolution in frequency.
The drawback of the STFT of having unchanged window length, which results in dilemma of resolution, has been overcome with the wavelet transform. The principles of wavelet transform consist of splitting the signal into many signals, and representing the signals corresponding to different frequency bands. This provides information about what frequency bands exist at what time intervals. There are two types of wavelets: continuous wave transform (CWT) and discrete wavelet transform (DWT). DWT is interesting in the context of fast and non-redundant transforms. The DWT is the signal processing tool used in order to extract the heartbeat signal from the cardiopulmonary signal, hence, extracting the heartbeat rate. The DWT (𝑊𝑗,𝑘) of a signal
𝑓(𝑡) is given by the scalar product of 𝑓(𝑡) with the scaling function (i.e. the wavelet basis function) ∅(𝑡) which is scaled and shifted:
𝑊𝑗,𝑘= 𝑓(𝑡), ∅𝑗.𝑘(𝑡) > (3)
The basis function is given by:
∅𝑗.𝑘(𝑡) = 2−1 2⁄ ∅(2−𝑗𝑡 − 𝑘) (4)
where j is the jth decomposition level or step and k is the
kth wavelet coefficient at the jth level. Wavelet has several
families like Daubechies, Coiflets, Symlets, etc. The difference between wavelet families make compromise between how compactly they are localized in time and how smooth they are. The number of coefficients and the iterations used in the wavelets are classified as subclasses. As the DWT analyzes the signal at several frequency bands with different windows lengths and different resolutions, it decomposes the signal into approximation ‘A’ and detail information ‘D’. These are computed by successive low-pass and high-pass filtering of the discrete time-domain signal where ‘A’ represents the low-pass filtered signal and ‘D’ represents the high-pass filtered signal [15]. After trial and error, Daubechies 5 shows the most precise results and is presented in this study. The DWT principle is resumed in Fig. 4.
S. El-Samad, D. Obeid, G. Zaharia, S. Sadek, G. El Zein
Fig. 4. Wavelet decomposition
In general, Dn contains frequencies between fs/2𝑛+1
and fs/2𝑛, where fs is the sampling frequency and is the
decomposition level (n = 1, 2, …). The heartbeat rate for an adult is between 60 and 120 beats per minute, hence the frequency of the heartbeat is located between 1 and 2 Hz. A resampling method is necessary in order to obtain the decomposition of the signal in the appropriate frequency band. Thus, converting the sampling frequency from 666.7 Hz to 512 Hz results in obtaining the wavelet decomposition having frequencies between 1 and 2 Hz at the 8th level. A peak detection technique is applied in order to extract the heartbeat rate from the 8th decomposition.
IV. Results and Discussion
Fig. 5 presents the peak detection of the ECG signal when the microwave measurement is performed from the back-side of the person under test.
Fig. 5. Peak detection of the ECG signal
The ECG is a bipolar derivation. The sampling frequency of the ECG is 360 Hz and the amplitude resolution is 350 adu/mV (analog to digital unit per milliVolt). The peak detection is applied in the time domain. For a duration of 30 seconds, 40 peaks are detected from the ECG signal while 37 peaks are detected from the signal obtained with the VNA at 2.4 GHz. Heart rate is calculated using relation (5):
𝐻𝑅 =𝑑 60(𝑁−1)
1+𝑑2+⋯+𝑑𝑁−1 (5)
where N is the number of peaks and dk is the duration, in
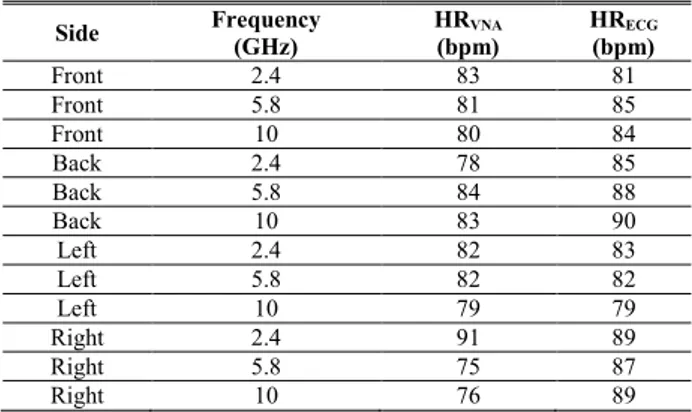
seconds, of the interval determined by 2 successive peaks. The heart rate is expressed in beat per minute (bpm). The obtained heartbeat rate extracted from the ECG is 88 bpm corresponding to a frequency of 1.46 Hz and the obtained heartbeat extracted from the VNA is 84 bpm corresponding to a frequency of 1.4 Hz. Table III represents the heart rates extracted from both ECG and VNA system for all sides and all emitted frequencies.
TABLEIII
HEART RATE EXTRACTED FROM ECGAND FROM VNAFOR EACH
FREQUENCY AND EACH POSITION
Side Frequency (GHz) HRVNA
(bpm) HR(bpm)ECG Front 2.4 83 81 Front 5.8 81 85 Front 10 80 84 Back 2.4 78 85 Back 5.8 84 88 Back 10 83 90 Left 2.4 82 83 Left 5.8 82 82 Left 10 79 79 Right 2.4 91 89 Right 5.8 75 87 Right 10 76 89
Figs. 6-8 represent a 10 seconds duration of the D8 decomposition. Peak detection is applied and the heartbeat rate is extracted. Fig. 6 represents the peak detection applied to D8 for the four positions when the microwave system is operating at 2.4 GHz. Fig. 7 represents the peak detection of D8 measured from the four positions at 5.8 GHz, and Fig. 8 represents the peak detection of D8 measured from the four positions at 10 GHz. Relative error 𝑅 between the Heartbeat Rate extracted from the radar system (HRVNA) and that
extracted from the ECG (HRECG) is calculated by the
relation (6):
𝑅𝐸 = 100 ×𝐻𝑅𝑉𝑁𝐴− 𝐻𝑅𝐸𝐶𝐺
𝐻𝑅𝐸𝐶𝐺 (6)
Table IV summarizes the relative HR error (%) for the measurements performed at different sides of the person and for the different operational frequencies.
TABLEIV
HR RELATIVE ERROR (%)FOR ALL FREQUENCIES AND ALL POSITION Frequency
(GHz) Back Front Left Right
2.4 9 3 1 3
5.8 5 5 0 13
10 8 4 0 14
The obtained results show accurate detection of the heartbeat signal and extraction of the heartbeat rate at several operational frequencies and from different sides from the person under test. Noteworthy to mention that according to the American National Standard [16], medical devices measuring the heartbeat rate should have a relative error lower than 10% or 5 bpm.
S. El-Samad, D. Obeid, G. Zaharia, S. Sadek, G. El Zein
Fig. 6. Peak detection of D8 signal at 2.4 GHz for four positions: (a) front side, (b) back side, (c) left side, and (d) right side
S. El-Samad, D. Obeid, G. Zaharia, S. Sadek, G. El Zein
Fig. 7. Peak detection of D8 signal 5.8 GHz for four positions: (a) front side, (b) back side, (c) left side, and (d) right side
Fig. 8. Peak detection of D8 signal at 10 GHz for four positions: (a) front side, (b) back side, (c) left side, and (d) right side
V.
Conclusion
A CW Doppler radar system is presented for cardiopulmonary activity detection. Measurements are performed at different operational frequencies simultaneously with an ECG reference system. The heartbeat rate is extracted from a normally breathing person sitting at a distance of 1 meter from the system. The measurements are performed considering four sides of the person and compared to those obtained by the ECG. Obtained results prove the ability of the system to detect the cardiopulmonary signals at a distance of 1 m for four sides of the person under test. Also, the proposed signal processing technique shows the possibility of extracting the heartbeat signal from the cardiopulmonary signal as well as extracting the heartbeat rate. The highest accuracy is obtained when the microwave measurement is performed at the left side of the person under test, while the lowest accuracy is obtained at the right side. Future work will focus on determining the heart rate of the person in movement and behind an obstacle.
Acknowledgements
The authors acknowledge LASER (Lebanese Association for Scientific Research) for funding this study, and “Rennes Metropole” for partially funding this work.
References
[1] J. Kuutti, M. Paukkunen, M. Aalto, P. Eskelinen, R. E. Sepponen, Evaluation of a Doppler radar sensor system for vital signs detection and activity monitoring in a radio frequency shielded room, Measurement, Volume 68, May 2015, Pages 135–142. [2] G. Wang, C. Gu, T. Inoue, C. Li, A hybrid FMCW-
Interferometry Radar for indoor precise positioning and versatile life activity monitoring, Microwave Theory and Techniques, IEEE
Transactions, Volume 62, (Issue 11), November 2014, Pages 2812-2822.
[3] A. Rahman, E. Yavari, G. Xiaomeng, V. Lubecke, O. Boric-Lubecke, Signal processing techniques for vital sign monitoring using mobile short range Doppler radar, IEEE conference on
Biomedical Wireless Technologies, Networks, and Sensing Systems (BioWireleSS), pp. 1-3, San Diego, CA, 25-28 Jan., 2015.
[4] G. Wang, J.-M. Munoz-Ferreras, R. Gomez-Garcia, C. Li, Clutter interference reduction in coherent FMCW radar for weak physiological signal detection, IEEE International conference on
Microwave Symposium (IMS), pp. 1-4, Tampa, FL, 1-6 June, 2014.
S. El-Samad, D. Obeid, G. Zaharia, S. Sadek, G. El Zein
[5] L. Crocco, V. Ferrara, A review on ground penetrating radar technology for the detection of buried or trapped victims, IEEE
International conference on Collaboration Technologies and Systems (CTS), pp. 535–540, Minneapolis, 19-23 May, 2014.
[6] C. Li, V. M. Lubecke, O. Boric-Lubecke, J. Li, A Review on Recent Advances in Doppler Radar Sensors for Noncontact Healthcare Monitoring, IEEE Transactions on Microwave Theory
and Techniques, Volume 61, (Issue 5), May 2013, Pages 2046-2060 .
[7] J. Li, L. Liu, Z. Zeng, F. Liu, Advanced Signal Processing for Vital Sign Extraction With Applications in UWB Radar Detection of Trapped Victims in Complex Environments, IEEE Journal of
Selected Topics in Applied Earth Observations and Remote Sensing, Volume 7, (Issue 3), May 2013, Pages 783–791.
[8] M. K. Singh, A. Gupta, S. Permanand, U. Singh, O. P. Singh, Y. H. Kim, A. K. Singh, System modeling and signal processing of microwave Doppler radar for cardiopulmonary sensing, Signal
Processing and Communication (ICSC), pp. 227-232, Noida, March 2015.
[9] S. El-Samad, D. Obeid, G. Zaharia, S. Sadek, G. El Zein, Contact-Less measurement system or cardiopulmonary activity, Proc. of
2014 Mediterranean Microwave Symposium (MMS), pp. 1-4, Marrakech, December 2014.
[10] W.Hu, Z. Zhao, Y. Wang, H. Zhang, F. Lin, Noncontact Accurate Measurement of Cardiopulmonary Activity Using a Compact Quadrature Doppler Radar Sensor, IEEE Transactions on
Biomedical Engineering, Volume 61, (Issue 3), November 2013, Pages 725–735.
[11] H. Zhang, S. Li, X. Jing, P. Zhang, Y. Zhang, T. Jiao, G. Lu, J. Wang, The Separation of the Heartbeat and Respiratory Signal of a Doppler Radar Based on the LMS Adaptive Harmonic Cancellation Algorithm, International Symposium on Computational Intelligence and Design (ISCID), Vol. 1, pp. 362-364, Hangzhou, October 2013.
[12] D. Obeid, G. Zaharia, S. Sadek, G. El Zein, “Microwave Doppler radar for heartbeat detection vs electrocardiogram,” Microwave
and Optical Technology Letters, Volume 54, (Issue 11), November 2012, Pages 2610-2617.
[13] P. Byung-Kwon, S. Yamada, O. Boric-Lubecke, V. Lubecke, Single channel receiver limitations in Doppler radar measurements of periodic motion, Radio and Wireless
Symposium, IEEE, pp. 99–102, San Diego, January 2006.
[14] D. Obeid, S. Sadek, G. Zaharia, G. El Zein, Multitunable microwave system for touch less heartbeat detection and heart rate variability extraction, Microwave and Optical Technology Letters,
Volume 52, (Issue 1), January 2010, Pages 192–198.
[15] G. A. Blackburn, J. Garke Ferwerda, Retrieval of chlorophyll concentration from leaf reflectance spectra using wavelet analysis,
Remote Sensing of Environment, Volume 112, (Issue 4), April 2008, Pages 1614-1632.
[16] American National Standard, Cardiac monitors, heart rate meters, and alarms (ANSI/ AAMI EC1, 2002).
A
UTHORS’
INFORMATION1IETR - UMR CNRS 6164 - INSA, 20 Avenue des Buttes de Coësmes,
CS 70839, 35708 Rennes cedex 7, France
2Lebanese University, Doctoral School of Sciences and Technology,
Tripoli, Lebanon
3Lebanese University, University Institute of Technology, Saida/Aabey,
Lebanon
Sarah Samad was born in Senlis, France in
1988. She received Diploma in electrical and electronics engineering from Lebanese University, Tripoli, Lebanon and Master Degree in technologies of medical and industrial systems. She is currently a Ph.D. student at INSA of Rennes, France and the Lebanese University, Lebanon. Her research interests are on cardiopulmonary detection using Doppler radar.
Gheorghe Zaharia received the B.S.
degree in electronics and telecommunications from the Polytechnic Institute of Iasi, Romania, in 1981 and the D.E.A. and Ph.D. degrees in telecommunications, signal processing and electronics from the “Institut National des Sciences Appliquées » (INSA) of Rennes, France, in 1991 and 1997, respectively.
From 1983 to 1990 he was a Lecturer at the Technical University of Iasi, Romania. Between 1983 and 1985 he studied mathematics at the University “Al. I. Cuza” of Iasi. Since 1997, he is Associate Professor in the Department “Communications Systems and Networks”, the former “Electronics and Communications Systems” Department, INSA, Rennes. His teaching and research interests mainly concern the study of radio waves propagation, communications systems, information theory, and coding. Gheorghe Zaharia is Senior Member IEEE and member of the Romanian Society of Medical Bioengineering. He was member of the Scientific Committee of several international conferences (EHB 2011, EHB 2013, MMS 2013, …). He has more than 30 journal papers, about 100 papers presented at international conferences and 2 patents. He is also co-author of one book and 5 book chapters.
Sawsan SADEK received the B.S. degree
in physics from Lebanese University in 1989 and Ph.D. degree in Microwaves from the University of Sciences and Technologies of Lille, France, in 1996. Actually, Sawsan is a professor at the Lebanese University, University Institute of Technology in Saida, Lebanon, Department of Communications, Computer and Networks. She chaired the department for 5 years from 2009 to 2014. She organized the MMS2013 in Saida, Lebanon. She participated to several scientific committees for international conferences and has more than 7 journal papers, 20 international conferences and one book chapter.
Ghais El Zein was born in Mallaka, Lebanon,
in 1960. He received the M.S. degree in Electronics, the Ph.D. degree in Telecommunications and Signal Processing, and the H.D.R. “Habilitation à Diriger des Recherches” degree in Electronics from the University of Rennes 1 - France, in 1983, 1988 and 1998, respectively. From 1985 to 1987, he was a Lecturer, and from 1990 to 1999, an Associate Professor, in the Department of Electronics and Communications Systems Engineering, of the “Institut National des Sciences Appliquées de Rennes” (INSA) - France, where he is currently a Professor.
He has authored or co-authored over 215 technical papers in major international journals and conferences, 2 books, 13 book chapters and 4 patents in the areas of communications and radio propagation. His teaching and research interests mainly concern the study of radio wave propagation phenomena and the evaluation of their effects on communication systems.
Prof. El Zein served as a TPC member and symposium chair of several international conferences. From 2001 to 2009, he served as deputy director of the Institute of Electronics and Telecommunications of Rennes (IETR - UMR CNRS 6164). Since 2009, he is the Head of Radio Propagation Team. He is a member of URSI-F and member of the Monitoring and Assessment Committee (CSE) of the “Images et Réseaux” cluster.