HAL Id: tel-00795984
https://tel.archives-ouvertes.fr/tel-00795984
Submitted on 1 Mar 2013HAL is a multi-disciplinary open access archive for the deposit and dissemination of sci-entific research documents, whether they are pub-lished or not. The documents may come from teaching and research institutions in France or abroad, or from public or private research centers.
L’archive ouverte pluridisciplinaire HAL, est destinée au dépôt et à la diffusion de documents scientifiques de niveau recherche, publiés ou non, émanant des établissements d’enseignement et de recherche français ou étrangers, des laboratoires publics ou privés.
de traces d’activités en interaction collaborative
Gregory Dyke
To cite this version:
Gregory Dyke. Un modèle pour la gestion et la capitalisation d’analyses de traces d’activités en interaction collaborative. Modélisation et simulation. Ecole Nationale Supérieure des Mines de Saint-Etienne, 2009. Français. �NNT : 2009EMSE0041�. �tel-00795984�
N° d’ordre : 551 I
THÈSE
présentée par
Gregory DYKE
pour obtenir le grade de
Docteur de l’École Nationale Supérieure des Mines de Saint-Étienne
Spécialité : Informatique
U
NM
ODELE POUR LAG
ESTION ET LAC
APITALISATION D’A
NALYSES DET
RACES D’A
CTIVITES ENI
NTERACTIONC
OLLABORATIVEA
MODEL FOR MANAGING AND CAPITALISING ON THE ANALYSES OF TRACES OF ACTIVITY IN COLLABORATIVE INTERACTIONsoutenue à Saint-Etienne, le 7 décembre 2009 Membres du jury
Président : Thierry CHANIER Professeur des Universités, Université Blaise Pascal
Clermont-Ferrand 2
Rapporteurs : Daniel SUTHERS
Alain MILLE
Professor, University of Hawai'i at Manoa
Professeur des Universités, Université Claude Bernard Lyon 1
Examinateurs : Jean CARLETTA
Thierry CHANIER
Senior Research Fellow, University of Edinburgh Professeur des Universités, Université Blaise Pascal Clermont-Ferrand 2
Directeurs de thèse : Kristine LUND
Jean-Jacques GIRARDOT
Ingénieur de Recherche CNRS, Université de Lyon Directeur de Recherche 2, Ecole Nationale Supérieure des Mines de Saint-Etienne
GENIE DES PROCEDES SCIENCES DE LA TERRE
SCIENCES ET GENIE DE L’ENVIRONNEMENT MATHEMATIQUES APPLIQUEES
INFORMATIQUE IMAGE, VISION, SIGNAL GENIE INDUSTRIEL MICROELECTRONIQUE
G. THOMAS Professeur – Centre SPIN B. GUY Maître de recherche – Centre SPIN J. BOURGOIS Professeur – Centre SITE E. TOUBOUL Ingénieur – Centre G2I O. BOISSIER Professeur – Centre G2I JC. PINOLI Professeur – Centre CIS P. BURLAT Professeur – Centre G2I Ph. COLLOT Professeur – Centre CMP
Enseignants-chercheurs et chercheurs autorisés à diriger des thèses de doctorat (titulaires d’un doctorat d’État ou d’une HDR)
AVRIL BATTON-HUBERT BENABEN BERNACHE-ASSOLANT BIGOT BILAL BOISSIER BOUCHER BOUDAREL BOURGOIS BRODHAG BURLAT COLLOT COURNIL DAUZERE-PERES DARRIEULAT DECHOMETS DESRAYAUD DELAFOSSE DOLGUI DRAPIER DRIVER FEILLET FOREST FORMISYN FORTUNIER FRACZKIEWICZ GARCIA GIRARDOT GOEURIOT GOEURIOT GRAILLOT GROSSEAU GRUY GUILHOT GUY GUYONNET HERRI INAL KLÖCKER LAFOREST LERICHE LI LONDICHE MOLIMARD MONTHEILLET PERIER-CAMBY PIJOLAT PIJOLAT PINOLI STOLARZ SZAFNICKI THOMAS VALDIVIESO VAUTRIN VIRICELLE WOLSKI XIE Stéphane Mireille Patrick Didier Jean-Pierre Essaïd Olivier Xavier Marie-Reine Jacques Christian Patrick Philippe Michel Stéphane Michel Roland Christophe David Alexandre Sylvain Julian Dominique Bernard Pascal Roland Anna Daniel Jean-Jacques Dominique Patrice Didier Philippe Frédéric Bernard Bernard René Jean-Michel Karim Helmut Valérie Rodolphe Jean-Michel Henry Jérôme Frank Laurent Christophe Michèle Jean-Charles Jacques Konrad Gérard François Alain Jean-Paul Krzysztof Xiaolan MA MA PR 2 PR 0 MR DR PR 2 MA MA PR 0 DR PR 2 PR 1 PR 0 PR 1 IGM PR 1 MA PR 1 PR 1 PR 2 DR PR 2 PR 1 PR 1 PR 1 DR CR MR MR MR DR MR MR DR MR DR PR 2 MR MR CR CR EC (CCI MP) MR MA DR 1 CNRS PR1 PR 1 PR 1 PR 0 CR CR PR 0 MA PR 0 MR MR PR 1
Mécanique & Ingénierie
Sciences & Génie de l'Environnement Sciences & Génie des Matériaux Génie des Procédés
Génie des Procédés Sciences de la Terre Informatique Génie Industriel Génie Industriel
Sciences & Génie de l'Environnement Sciences & Génie de l'Environnement Génie industriel
Microélectronique Génie des Procédés Génie industriel
Sciences & Génie des Matériaux Sciences & Génie de l'Environnement Mécanique & Ingénierie
Sciences & Génie des Matériaux Génie Industriel
Mécanique & Ingénierie Sciences & Génie des Matériaux Génie Industriel
Sciences & Génie des Matériaux Sciences & Génie de l'Environnement Sciences & Génie des Matériaux Sciences & Génie des Matériaux Génie des Procédés
Informatique
Sciences & Génie des Matériaux Sciences & Génie des Matériaux Sciences & Génie de l'Environnement Génie des Procédés
Génie des Procédés Génie des Procédés Sciences de la Terre Génie des Procédés Génie des Procédés Microélectronique
Sciences & Génie des Matériaux Sciences & Génie de l'Environnement Mécanique et Ingénierie
Microélectronique
Sciences & Génie de l'Environnement Mécanique et Ingénierie
Sciences & Génie des Matériaux Génie des Procédés
Génie des Procédés Génie des Procédés Image, Vision, Signal Sciences & Génie des Matériaux Sciences & Génie de l'Environnement Génie des Procédés
Sciences & Génie des Matériaux Mécanique & Ingénierie Génie des procédés
Sciences & Génie des Matériaux Génie industriel CIS SITE CMP CIS SPIN SPIN G2I G2I DF SITE SITE G2I CMP DF CMP SMS SITE SMS SMS G2I SMS SMS CMP CIS SITE SMS SMS SPIN G2I SMS SMS SITE SPIN SPIN CIS SPIN SPIN SPIN CMP SMS SITE SMS CMP SITE SMS SMS SPIN SPIN SPIN CIS SMS DF SPIN SMS SMS SPIN SMS CIS Glossaire : Centres : PR 0 PR 1 PR 2 MA(MDC) DR (DR1) Ing. MR(DR2)
Professeur classe exceptionnelle Professeur 1ère catégorie
Professeur 2ème catégorie
Maître assistant Directeur de recherche Ingénieur Maître de recherche SMS SPIN SITE G2I CMP CIS
Sciences des Matériaux et des Structures Sciences des Processus Industriels et Naturels
Sciences Information et Technologies pour l’Environnement Génie Industriel et Informatique
Centre de Microélectronique de Provence Centre Ingénierie et Santé
To my father, who taught me wisdom, my brother, who taught me patience, and my mother, who taught me love.
Acknowledgements
As is customary with such work, I have had giants’ shoulders on which to stand in order to accomplish it. I have been luckier than most and am deeply grateful to those people who helped me climb up there in the first place, stay up there when I felt dizzy, and to the giants with whom I have had the pleasure of discussing both their work and mine.
My thanks go out to my supervisors, Kristine Lund and Jean-Jacques Girardot for their friendship, for letting me choose my own path while preventing me from straying off into the thickets, and for being my compass when the twists in the path left me confusing north and south.
Thank you to Annie, Steven and Marie Line on whom I could always count for all the little things which actually take up vast amounts of time.
Thank you to the LEAD team and to all the other users of Tatiana who have shaped my understanding of analysis and who have very patiently put up with Tatiana’s numerous real-world shortcomings. Thank you also to all the colleagues in other projects, and in particular to Lotfi and Madeth, my partners in crime for trace models.
Thank you to Jean Carletta, Thierry Chanier, Alain Mille and Dan Suthers for accepting to be on my jury. They are contributors to some of the main works cited in this dissertation and I feel honoured and privileged that they will be evaluating it.
A big thanks to Chris Teplovs for being so enthusiastic about the potential of my work and who now has a Tatiana of his own. I wish her all the happiness and joy that life can bring. Thanks also to Gilles and Cynthia, for music, dance, friendship and love and but for whose presence I would probably still be on page one. Thanks to my family and Cynthia’s, for their pride, encouragement and support.
Last, I thank the reader who has made it this far in spite of my often convoluted metaphors. Although I am no giant, I hope my work will nevertheless enable you to see further.
Résumé
Dans cette thèse, nous nous adressons au problème de l’étude socio-cognitive d’interactions humaines, plus particulièrement dans le domaine de l’apprentissage collaboratif médiatisé par ordinateur. L’étude de telles situations passe par l’analyse de traces (fichiers de log, audio-vidéo, etc.) du processus d’activité et présente de nombreuses difficultés :
- Grande quantité de données multimodales complexes issues de sources différentes. - Données fortement dépendantes du contexte dans lequel elles ont été produites. - Variété des approches méthodologiques et épistémologiques d’analyse possibles. - Difficulté de partage et réutilisation de données et d’analyses effectuées à partir de ces données.
Notre travail a porté sur une réduction de ces difficultés et nous présentons dans cette thèse nos trois résultats principaux. D’une part, nous proposons une description du processus d’analyse de ce genre données ainsi qu’un artefact générique permettant de recouvrir un grand nombre d’artefacts analytiques que nous avons pu observer et que nous nommons rejouable. D’autre part, nous présentons une étude et modélisation informatique des rejouables, et décrivons les quatre opérations fondamentales qui peuvent s’y appliquer : synchronisation, visualisation, transformation et enrichissement. Enfin, nous décrivons l’implémentation de cette modélisation dans un environnement d’aide à l’analyse par manipulation de rejouables que nous évaluons dans des situations de recherche réelles.
Tatiana (Trace Analysis Tool for Interaction Analysts – http://code.google.com/p/tatiana), l’environnement logiciel résultant, est basé sur ces quatre opérations fondamentales tout en intégrant de nombreuses possibilités d’extension de ces opérations pour s’adapter à de nouvelles formes d’analyse sans sortir du cadre de l’analyse au travers de rejouables. Cet outil est utilisé par plus de 10 équipes de chercheurs (France, Royaume Uni, Pays-Bas, Danemark, Hong Kong) sur des thématiques et objets d’étude variés.
Cette thématique de recherche s’introduit dans une problématique plus large de passage à l’échelle sur l’analyse de données d’interaction, de partage de corpus de données et d’analyses collaboratives et incrémentales sur ces corpus. L’objet que nous avons défini et implémenté permet à de nombreuses disciplines informatiques (recherche d’information, fouille de données, ingénierie des connaissances, interaction homme-machine, intelligence artificielle) de trouver un nouveau champ d’application dans l’analyse de traces, tout en tenant compte de la particularité de ces objets d’étude et des artefacts qui en sont issus.
Abstract
In this dissertation, we address the problem of the socio-cognitive study of human interaction, more particularly in the field of computer-supported collaborative learning (CSCL). The study of such situations can be performed through the analysis of traces (log files, audio, video, etc.) of the activity process, yet presents numerous difficulties:
- Large quantity of complex multimodal data from a variety of sources.
- Data which is strongly dependent on the context in which it has been produced. - Variety of possible methodological and epistemological approaches to analysis. - Difficulty in sharing and re-using data and analyses performed on this data.
Our work has been on the reduction of these difficulties and, in this dissertation, we present our three main results. On one hand, we propose a description of the process of analysis of such data, as well as a generic artefact which covers a large number of the analytic artefacts we have observed and which we call a replayable. On the other hand, we present a study and a modelling of replayables, and describe the four fundamental operations which can be applied to them: synchronisation, visualisation, transformation and enrichment. Finally, we describe the implementation of this model in an environment that assists analysis through the manipulation of replayables, which we evaluate in real-life research situations.
Tatiana (Trace Analysis Tool for Interaction Analysts – http://code.google.com/p/tatiana), the resulting software environment, is based on these four fundamental operations and integrates numerous possibilities for extending these operations to adapt to new kinds of analysis while staying within the analytic framework afforded by replayables. This tool is used by over 10 research teams (France, United Kingdom, the Netherlands, Denmark, Hong-Kong) to study a variety of phenomena.
This research theme addresses the wider issues of scaling up the analysis of interaction data and sharing corpora and analyses of these corpora to allow validation, replication and collaboration among analysts. The object we have defined opens up the applicative domain of trace analysis to many computer science disciplines (information retrieval, data mining, knowledge engineering, HCI, artificial intelligence), while simultaneously taking into account the particularity of these kinds of analyses and the artefacts which are used to perform them.
Table of contents
Acknowledgements ... iii
Résumé ... v
Abstract ... vii
Table of contents ... ix
Table of figures ... xiii
Introduction ... 1
1 Research Issues ... 7
1.1 Introduction ... 7
1.2 An overview of CSCL ... 7
1.2.1 Research questions in CSCL ... 9
1.2.2 Difficulties in the analysis of CSCL data ... 10
1.2.3 Capitalising upon and sharing analyses ... 13
1.2.4 Computer support for analysis ... 13
1.3 Traces of human activity ... 14
1.3.1 Tracing computer-mediated activity ... 14
1.3.2 Uses of digital traces beyond analysis by researchers ... 16
1.4 State of the art in trace analysis ... 17
1.4.1 Trace models ... 17
1.4.2 Automatic analysis techniques ... 33
1.4.3 Audio-video analysis ... 38
1.4.4 Trace analysis tools ... 41
1.4.5 Exploratory sequential data analysis and replay tools ... 45
1.5 Discussion of the state of the art ... 54
1.5.1 What we know about analysis in CSCL ... 54
1.5.2 Models for representing traces and analyses ... 56
1.5.3 What can we learn from existing tools ... 57
1.5.4 Conclusion on the state of the art ... 57
1.6 Goals of the dissertation ... 58
1.6.1 Trace Engineering ... 58
1.6.2 What artefacts are built during analysis? ... 59
1.6.3 How should such artefacts be modelled? ... 59
1.6.4 Implementing a replayable-based analysis environment ... 60
1.6.5 Methodology ... 60
1.7 Conclusion on research issues ... 61
2 Defining an analytic artefact ... 63
2.1 Introduction ... 63
2.2 What is analysis? ... 63
2.3 A generalised analysis process ... 68
2.4 The specificity of CSCL analysis ... 69
2.5 Overview of operations on analytic artefacts ... 72
2.5.1 Contextualisation ... 72
2.5.2 Visualisation ... 74
2.5.3 Transformation ... 76
2.5.4 Enrichment ... 77
2.5.6 Aggregation ... 79
2.6 Definition of a replayable ... 80
2.7 Conclusion on defining an analytic artefact ... 81
3 Construction of a model for replayables ... 83
3.1 Introduction ... 83
3.2 What is a model? ... 83
3.2.1 What kind of model is a replayable? ... 85
3.2.2 What are M-traces? ... 87
3.3 A model for replayables ... 88
3.3.1 Properties of replayables ... 93
3.3.2 Modelling replayables with M-traces ... 96
3.4 Replayable visualisations ... 99
3.5 Transformation of replayables ... 100
3.6 Conclusion on constructing a replayable model ... 103
4 Implementation of an environment for manipulating replayables ... 105
4.1 Introduction ... 105
4.2 General requirements ... 105
4.3 General architecture ... 106
4.3.1 Tatiana data storage ... 107
4.4 Transformations ... 108
4.5 Visualisation ... 112
4.5.1 Tabular visualisation ... 113
4.5.2 Scoresheet visualisation ... 113
4.6 Enrichment ... 115
4.6.1 Categorisation and annotation analysis ... 116
4.6.2 Graph analysis ... 117
4.7 Synchronisation ... 118
4.8 Conclusion on implementing an environment for manipulating replayables ... 120
5 Results and perspectives ... 121
5.1 Introduction ... 121
5.2 Case studies ... 121
5.2.1 Face-to-face collaborative note-taking ... 123
5.2.2 Paris case study ... 126
5.2.3 Utrecht case study ... 127
5.2.4 Nottingham case study ... 129
5.2.5 Collaborative design in engineering ... 130
5.2.6 Describing the structure of chat dialogue ... 132
5.2.7 Tension and relaxation ... 132
5.2.8 MULCE ... 134
5.2.9 Blogs ... 135
5.2.10 Knowledge forum ... 136
5.2.11 Tatiana interoperability ... 138
5.2.12 Summary of case studies ... 138
5.3 Evaluation ... 139
5.3.1 Replayables as generic analytic artefacts ... 139
5.3.2 The model for representing replayables ... 142
5.3.3 A software environment for manipulating replayables ... 146
5.3.4 Global evaluation ... 147
5.4 Perspectives ... 148
5.4.2 Sharing corpora and analyses ... 149
5.4.3 Describing the knowledge embodied in traces ... 150
5.4.4 Methods for trace analysis ... 151
5.5 Conclusion on results and perspectives ... 152
Conclusion ... 155
References ... 159
Publications ... 169
Appendix I – Tatiana Architecture ... 171
Appendix II – Tatiana info files and the Replayable API ... 175
Introduction ... 175
Overview ... 175
Replayables ... 177
Appendix III – Tatiana enrichment API ... 181
Appendix IV – Tatiana synchronisation API ... 185
API for plugins ... 185
API for external replayers ... 186
What is a replayer? ... 186
Why create a replayer that is pilotable by Tatiana? ... 186
What messages does a replayer need to understand to be pilotable by Tatiana? ... 186
How do I implement a replayer? ... 187
How do I implement a replayer in java using TatianaRemoteService.jar? ... 190
Appendix V – Authoring scripts and filters ... 191
About scripts and filters ... 191
Adding new filters and scripts ... 191
Scripts ... 192
Reminder on the Tatiana Display Format ... 192
Introduction to XQuery ... 192
A first example of a transformation ... 193
A second example of a transformation ... 194
A third example of a transformation ... 196
A first example of an import script ... 196
Transformations into other formats ... 197
Filters ... 198
Examples of filters ... 198
Description ... 199
Appendix VI – Tatiana user manual ... 202
Introduction ... 202
What is Tatiana and who is it aimed at? ... 202
What can I do with Tatiana? ... 202
Setting Things up ... 202
Hardware and software requirements ... 202
Downloading Tatiana ... 204
Installing Tatiana and related tools ... 204
Tatiana ... 205
Basic concepts ... 205
Launching Tatiana ... 205
The Tatiana window ... 206
Using Tatiana ... 207
Create a corpus ... 207
Organisation of files in the filesystem ... 212
Replayables ... 213
Analyses ... 220
Interaction Score Sheets (graphical visualisations) ... 222
Future implementations ... 224
Updating Tatiana ... 224
Appendix VII - Résumé en Français ... 227
Introduction ... 228
Problématique et état de l’art ... 229
Qu’est-ce que l’analyse ? ... 230
La spécificité de l’analyse dans le domaine du CSCL ... 232
Les outils et artefacts d’analyse existants ... 234
La notion de rejouable ... 245 Observable et trace ... 245 Rejouable ... 246 Visualisation de rejouables ... 251 Transformations de rejouable ... 252 Application ... 253
Exemple sur une analyse de reformulation ... 254
Difficultés d’implémentation et limites du rejouable ... 256
Conclusion ... 258
1. Introduction ... 259
2. Comment se déroule l’analyse ? ... 260
2.1. Etudes de cas ... 261
2.2. Quelques thèmes d’analyse ... 264
2.2. Résumé ... 268
3. Un modèle simple d’analyse ... 268
4. Tatiana : un environnement générique d’analyse ... 271
4.1. Tour d’horizon de Tatiana ... 271
4.2 Exemple d'utilisation de Tatiana ... 274
4.3 Usages et limites ... 275
Table of figures
Figure A Recordings of an activity can be analysed by several different tools. The results of
such analyses are difficult to feed back into subsequent analyses. ... 2
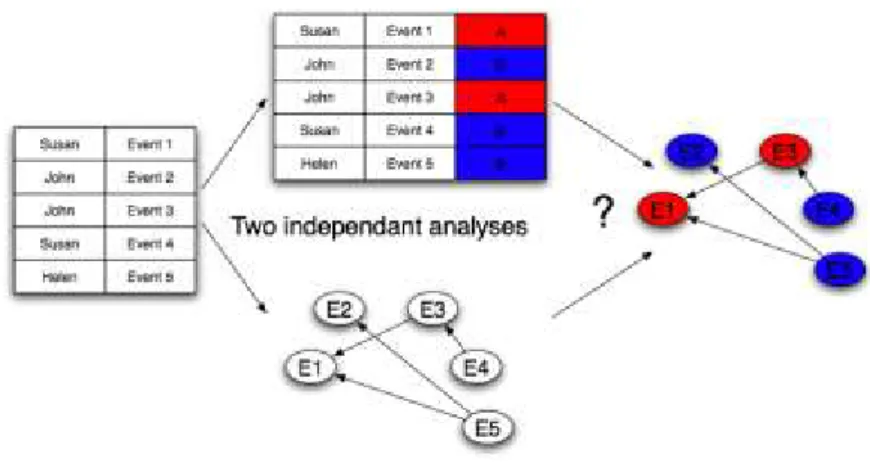
Figure 1-1 Given two independent analyses such as a colour coding and a contingency graph, how can the two easily be combined ? ... 12
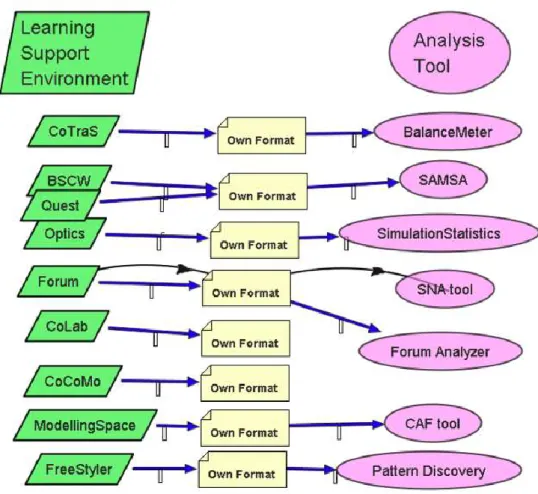
Figure 1-2 The initial situation: each tool is linked to a trace format and to the tool from which the trace is recorded (Martínez et al., 2005, p. 13) ... 18
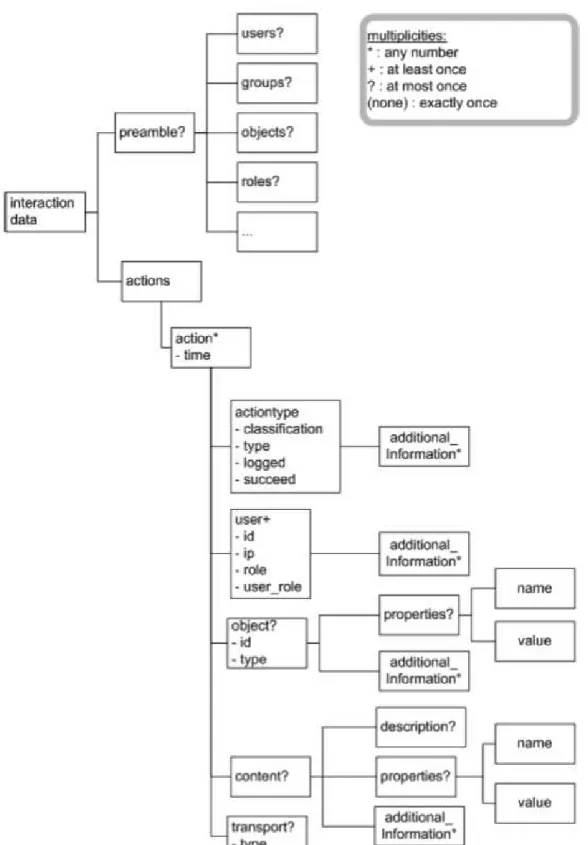
Figure 1-3 Part of the DTD for the Cavicola common format (Martínez et al., 2005, p. 17) .. 19
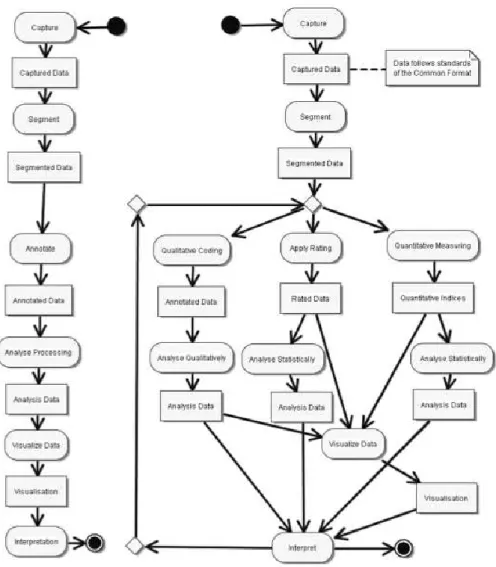
Figure 1-4 The Cavicola analysis process in its generic form (left) and in a more specific instance (right). (Harrer et al., 2007, p.2) ... 20
Figure 1-5 The UTL Defining-Getting-Using model (Choquet & Iksal, 2007a, p. 4) ... 23
Figure 1-6 The UTL conceptual model of a track (Choquet & Iksal, 2007a, p. 6) ... 24
Figure 1-7 Contents of a MULCE corpus (Reffay et al., 2008 p. 6) ... 25
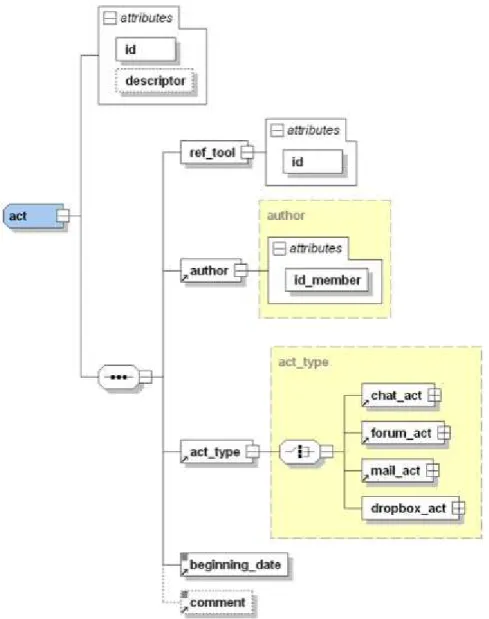
Figure 1-8 Schema for encoding acts in a digital trace in the MULCE project (Reffay et al., 2008 p. 14) ... 26
Figure 1-9 Architecture of a trace-based system (Settouti et al., 2006, p. 5) ... 28
Figure 1-10 The Knowledge Discovery from DataBase cycle (Fayyad, 1996, p. 41) ... 30
Figure 1-11 The ABSTRACT architecture (Georgeon, 2008, p. 140) ... 31
Figure 1-12 Visualisation in ABSTRACT (http://liris.cnrs.fr/abstract) ... 32
Figure 1-13 Semantic Clusters in KSV, where red arcs indicate a semantic proximity which is higher than a certain threshold and blue boxes represent messages (Teplovs, 2008, p. 7). ... 37
Figure 1-14 Sample annotation trees described with the Nite XML Toolkit model (Carletta et al., 2003, p. 354) ... 39
Figure 1-15 Explanation of CORDTRA diagrams (Hmelo-Silver et al., 2008, p. 412) ... 42
Figure 1-16 Visualisation of message reading with TrAVis (May et al., 2008, p. 184) ... 42
Figure 1-17 Mock-up of a replayer interface allowing the researcher to see what two users saw at a particular moment. ... 45
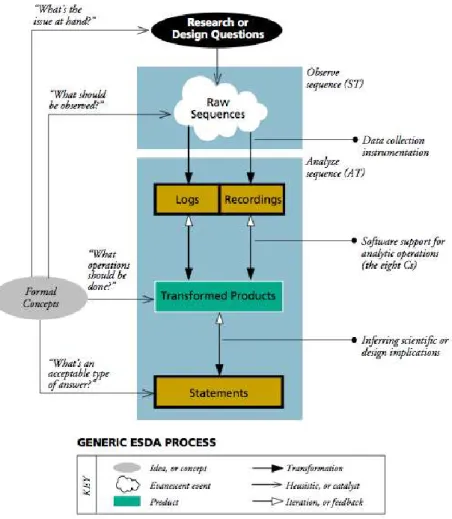
Figure 1-18 The general ESDA process follows an outer loop linking research questions to statements and an inner analytic loop in which data is iteratively transformed to allow the generation of statements (Fischer & Sanderson, 1996, p. 26). ... 46
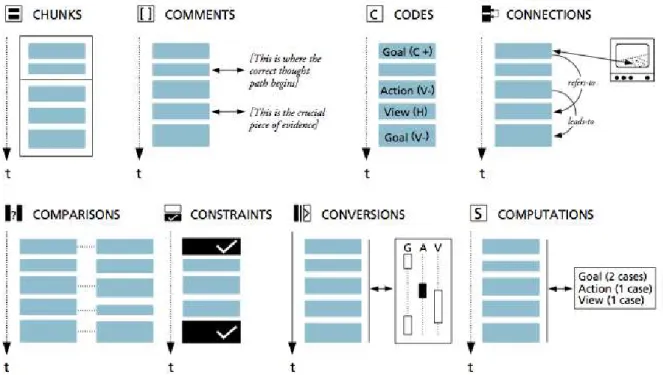
Figure 1-19 The eight Cs – eight operations for transforming data to reveal its essential structure. (Fischer & Sanderson, 1996, p. 29) ... 47
Figure 1-20 Summary of functionalities in MacSHAPA (Sanderson, 1994, p. 5) ... 49
Figure 1-21 The ActivityLens environment showing a multi-level view of the situation under analysis. (Avouris et al., 2007, p. 18) ... 52
Figure 1-22 In this example from Replayer, the events selected in the left hand view are also highlighted on the map and in the video timeline. (http://ww.dcs.gla.ac.uk/~morrisaj/Replayer.html) ... 53
Figure 1-23 In DRS, most kinds of data can be viewed in the track viewer. Here the transcription and the colour codes of the coding of this transcription are synchronised with the video. (http://ww.mrl.nott.ac.uk/research/projects/dress/software/DRS/Home.html) ... 53
Figure 1-24 Relationship between the three results (center boxes) presented in this
dissertation. Each result is evaluated according to the statements in the arrows stemming
from that result. ... 61
Figure 2-1 Sense-making is finding a representation that organises information in an optimal way (with regard to various forms of cost). The result of the learning loop complex is a representation and a set of encodons (data encoded in that representation). (Russel et al., 1993, p. 2) ... 64
Figure 2-2 A contingency graph illustrating the dependencies between the contributions of two students (respectively top and bottom) in order to trace the transfer of knowledge between the two. (Suthers et al., 2007) ... 66
Figure 2-3 The proposed model of the analysis process ... 69
Figure 3-1 Examples of token model (denoted ⊲i) and type model relationships (denoted ⊲t). (Kühne, 2006, p. 5) ... 84
Figure 3-2 Illustration of the system-model relationships between replayables and replayable models. All replayables (left) are described (in a type-model relationship) by the replayable model (right). This replayable model is used as a token-model to describe a part of the software environment to be designed (middle right). In an instance of this software (middle left), it is possible to create different replayables which are token-models of the replayables we initially described. ... 86
Figure 3-3 Explanation of M-traces according to the notation defined by Kühne (2006). Different kinds of “original” traces (left) can be classified as being similar (e.g. because they are produced by the same tool). Each of these “original” traces is represented by an M-trace (middle), composed of a token-model for the trace and a type model for the class the trace belongs to. A trace model formalism (right above) is used as a type model for all trace models. The trace component of M-traces (middle) are described both by the trace model (middle) and the trace formalism (right below). Trace models are a specialisation of the trace formalism. ... 87
Figure 3-4 Illustration of a series of replayables created from the recorded trace of an observed activity. Each replayable can be visualised in one or several ways. ... 89
Figure 3-5 UML class diagram showing the main aspects of the proposed model for replayables. ... 91
Figure 3-6 Hierarchy of facet representation forms ... 95
Figure 3-7 Definition of an M-trace, as proposed by Settouti et al. (2009), pp. 7-8 ... 97
Figure 3-8 Definition of a Trace model, as proposed by Settouti et al. (2009), p. 6 ... 98
Figure 4-1 General architecture of Tatiana showing the dependencies between components and the components which are designed with extensibility in mind. ... 106
Figure 4-2 A Tatiana filter which combines three component scripts to add information about activity and inactivity. In a visualisation of a sample replayable created by this filter, the events originally present in the trace file are in red and the inserted delimiters are in blue. ... 110
Figure 4-3 A replayable visualised in two different ways in Tatiana: tabular visualisation (top) and scoresheet visualisation (bottom) ... 114
Figure 4-4 The interface for categorisation. Top right: the analysis tab with an editable list of categories for that analysis. Bottom: Tabular visualisation of a replayable with selection of a category for an event. Top left: a graph analysis which uses the colours provided by the categorisation analysis. ... 117
Figure 4-5 Graph analysis showing the reply structure of a chat as described by an analyst (right). This structure can be seen imported on a scoresheet visualisation (left). (data from a study presented in Amelsvoort, Andriessen, & Kanselaar, 2008) ... 118
Figure 4-6 Bringing it all together. Synchronisation of several Tatiana visualisations,
including three tabular visualisations (top, left and centre), the DREW external replayer (top right), a video player (centre right), a scoresheet visualisation (bottom left), and the
remote control (bottom right). ... 119
Figure 5-1 Process used to analyse reformulation ... 124
Figure 5-2 Tatiana replayable exported to an image file and completed with labels and comments. ... 125
Figure 5-3 Discussion produced in three quadrants of the graphical argumentation space (left) is represented in a graphical timeline (right) with one row per quadrant and identical shapes combined with lines to show the movement of each student across the quadrants. (van Diggelen, Jansen, & Overdijk, 2008, p. 6) ... 128
Figure 5-4 Two solutions are comparatively evaluated according to various criteria (Cassier, in preparation). ... 131
Figure 5-5 The graph presented in Figure 5-4 is now shown as a graphical timeline, with additional arrows and labelling performed outside of Tatiana, showing one of the solutions and the criterion which was pivotal in choosing that solution (ibid). ... 131
Figure 5-6 Two visualisations representing the same discussion. The first illustrates tension raising (red) and tension relaxing (green) interventions by the teacher and the three students. The second identifies topics by colour and the height of each element shows the depth of discussion (Baker, Andriessen & Lund, 2009). ... 133
Figure 5-7 Two visualisations of the same corpus. Both visualisations distinguish participants by colour. In the top visualisation, the three major rows correspond with the three phases. Within each of these, the minor rows indicate which communication media was used. ... 135
Figure 5-8 The missing visualisation plugin. Left, the relationship between data in a tabular view and the scoresheet visualisation (one graphical element per event). Middle, ... 137
9 - Tatiana upon launch ... 206
10 – Several replayers opened and view at the same time ... 207
11 - New corpus dialog box ... 207
12 - Applying a filter to a selected file ... 208
13 - Synchronisation information when adding a new file ... 209
14 - New file added to current corpus ... 209
15 - Extract of a Drew tracefile ... 212
16 - Tatiana's Workspace ... 213
17 - A replayable in tabular and graphical form ... 214
18 - A list of filters ... 215
19 - Execution of the information filter on a CoFFEE tracefile ... 216
20 - Threaded Chat extracted from a CoFFEE tracefile ... 216
21 - the 3 tabs of a replayable ... 217
22 -Synchronised replayables and remote control ... 218
23 - modifying a replayable ... 219
24 - Creating an event from a selection ... 220
25 - Annotating to analyse (in extra column) ... 221
26 - List of all annotation made in an analysis ... 221
27 - Defining categories for an analysis ... 222
28 - Graphical visualisation of an replayable ... 223
29 - Parameters to update Tatiana ... 225 Figure 30 • Cet exemple du logiciel Replayer présente cinq artefacts synchronisés : une ligne
de temps présentant des éléments sous forme symbolique, une vue aérienne avec certaines positions mises en évidence, deux vidéos et une ligne de temps plus simple
permettant de sélectionner des intervalles. Les mêmes évènements sont mis en évidence dans tous les artefacts hormis les vidéo. ... 239 Figure 31 • Cet exemple du logiciel ABSTRACT présente la trace primaire (en bas) et des
éléments de plus haut niveaux calculés à partir de cette trace primaire (en haut.) ... 242 Figure 32 • Graphe de contingences illustrant les dépendances entre les contributions de deux
étudiants (en haut et en bas respectivement), afin de tracer le transfert de connaissances de l’un à l’autre (Suthers et al., 2007) ... 243 Figure 33 • Illustration d’une série de rejouables crées à partir de la trace enregistrée d’une
activité observée. Chaque rejouable peut être visualisé d’une ou plusieurs façons. ... 247 Figure 34 • Modélisation du rejouable et des entités liées dans le cadre de l’analyse. ... 249 Figure 35 • Visualisation synchronisée de différents rejouables dans Tatiana. En haut à
gauche : Trace de l’éditeur de texte partagé et vidéo. Au milieu : rejouables issus de la trace de l’éditeur de texte partagé ; traduction directe de la trace primaire et unités de rédaction. Au milieu : transcription de la vidéo. En bas : Fusion de la transcription (ligne du haut) et des unités de rédaction (une ligne par apprenant) enrichis des liens de
reformulation. ... 256 Figure 36. Un exemple de visualisation de reformulation ... 262 Figure 37. Dans cet exemple du logiciel Replayer, les évènements sélectionnés dans la vue de
gauche sont également mis en évidences sur la vue d’avion centrale et associés aux vidéos de la partie droite ... 267 Figure 38. Représentation graphique symbolique des évènements enregistrés lors d’un
changement de file sur une autoroute, visualisés avec ABSTRACT
(http://liris.cnrs.fr/abstract/). ... 268 Figure 39. Représentation graphique du modèle de traitement Cavicola (Harrer, et al., 2007, p. 2) ... 269 Figure 40. Représentation graphique du modèle de traitement de Tatiana ... 270 Figure 41. L’architecture de Tatiana faisant apparaître les liens entre les composants, les
composants conçus pour être extensibles, et les développements en cours. ... 272 Figure 42. Affichage de différents rejouables dans Tatiana : trace d’un éditeur de texte partagé
(haut gauche), transcription des dialogues (milieu gauche), unités de rédaction (haut centre), visualisation des reformulations (bas gauche), ainsi que la « télécommande » (bas, droit) permettant la synchronisation avec des outils extérieurs tels que le rejoueur DREW (haut droit) ou un afficheur vidéo (milieu droit). ... 274
Introduction
The problem
Not so long ago, if you wanted a copy of a text, you would have had to write the copy yourself, or hire someone to do it for you. Now, texts can be photocopied or scanned and printed. Even with such technology, modifying a text is a question of using correction fluid and hoping that there is sufficient room to perform the modification without too much disruption. In certain cases, however, we have access to word processors or spreadsheets, which not only allow the modification of documents but are also able to propagate the impact of these changes: extra text can mean new page numbering, a different value in a spreadsheet can cause the sum of a column to be updated.
This is a story of designing computer support to create and edit the artefacts which we produce as a by-product or a goal of our work. Modelling such artefacts in digital form requires an understanding of the intrinsic structure, not only of individual documents, but of the class to which they belong (e.g. a textual document or a spreadsheet). It also requires understanding the operations which can be performed on them and how the result of these operations can be integrated. For various kinds of artefacts (newspapers, pictures, diagrams, books, league tables, musical notation, databases, 3d models, etc.), this story is at different stages of advancement. For some, such as books and newspapers, we have created powerful authoring and editing tools. In many cases, however, the end artefact is produced in a format which is not designed to be edited (pdf documents, newspapers and books are typical examples of this). For others, such as 3d models and musical notation, we are still struggling to provide good computer support for creating and editing artefacts in an integrated way. For researchers in various fields who are trying to find ways of managing, analysing and interpreting their data, this story is a familiar one, with computers proving to be a blessing when they work and a curse when they don’t. In this dissertation, we focus on researchers who are analysing human interaction, particularly in computer-mediated situations. The data to be analysed is often in the form of video and computer log files. Such recordings are reasonably well understood and the computer artefacts which represent them are now in widespread use. The only shadow is that of formats and compatibility, which is increasingly
not a problem for video (due to widespread use of video for many reasons and a vested interest for all parties in arriving at compatible solutions) and, while still a major headache for non-technical users (which of course is the majority of researchers), is only a minor problem for log files.
The artefacts which are created during analysis of such data are another matter. Aside from statistical data (for which spreadsheets and specialised statistical analysis packages provide a solution), such artefacts are not well understood and, more importantly, are frequently objects which can be authored, but which are very difficult to edit or use in an integrated way. Many such artefacts are produced as images or diagrams which explain the interaction. However, including additional data on a diagram, or propagating changes on a diagram back to the original data for further use are frequently as time-consuming as creating the original diagram (much in the same way as modifications of a pdf document are not carried back to the source). More generally, the situation is that described in Figure A: although data can be analysed by many tools (with some technical coaxing), the process is forward-only and the results of the analyses cannot be further analysed and are thus difficult to capitalise upon. In this dissertation, we examine the nature of analysis of computer-mediated situations, provide a model for some of the artefacts produced during analysis, showing how such artefacts can be used in an integrated way, and describe the software Tatiana, which implements this model.
Figure A Recordings of an activity can be analysed by several different tools. The results of such analyses are difficult to feed back into subsequent analyses.
Research context
The work presented in this dissertation stems from a long-standing collaboration between the RIM laboratory (netwoRks, Informatics and Multimedia) at the Ecole des Mines de Saint-Etienne and the ICAR laboratory (Interactions, Corpora, leArning and Representations) in Lyon. This collaboration has been most notable in the European Commission funded projects SCALE1 and LEAD2. In the first, RIM participated by providing a software platform to support collaborative argumentative learning. Data was collected from student’s usage of this platform and analysed by ICAR (among others). Various analysis assistance tools were made during this project. The second project, LEAD, addressed networked communication in the classroom (i.e. mixture of face-to-face and computer-mediated communication) and included the development of communication software and an analysis tool specially designed for such data (the design and implementation of this tool formed the bulk of the work presented in this dissertation). At a local level, the Personalisation of EIAH (IT environments for human learning) project3, has led to the discussion of the issue of traces (log files, or recordings) of human interaction: how they can be modelled and what purposes they can serve. Another local project, ASPIC4, addresses collaborative design in engineering situations and has also been a source of experience for the analysis of collaborative interactions.
ICAR’s experience in the analysis of CSCL data (computer supported collaborative learning – of which SCALE and LEAD provided examples) and collaborative interactions in general, combined with several projects within which research data and analysis practices have been shared have produced an ideal environment within which to address the problem of modelling and capitalising on analyses of traces of activity in collaborative interactions, with a more specific focus on CSCL data.
1 Internet-based intelligent tool Support Collaborative Argumentation-based LEarning in secondary schools,
IST-1999-10664, funded under the IST call of the 5th Framework Programme of the European Commission.
2 Technology-enhanced learning and problem-solving discussions: Networked learning environments in the
classroom, IST-2005-028027, funded under the IST call of the 6th Framework Programme of the European Commission.
3 Funded by the Rhône-Alpes Region within the ISLE cluster.
Dissertation outline
In Chapter 1, we give an overview of the field of CSCL and of the uses of traces for analysis and other purposes. We then present the state of the art in analysis tools and models and identify three shortcomings in the state of the art: the lack of knowledge about analysis, particularly concerning CSCL and how it differs from other kinds of analyses, models which do not clearly show what kinds of analysis problems they can address and tools which provide a set of functionalities without more clearly showing how they are integrated and how they constrain analysis to a limited set of practices. We position our work within the field of trace engineering and introduce the three main results of this dissertation, examining how they are related and how they will be evaluated.
In Chapter 2 we extend our exploration of the state of the art to the more general aspect of analysis, particularly in the field of CSCL. We use this to identify the specificities of CSCL analysis and to define the kind of analysis problems we are setting out to address: analyses of human interaction. More particularly, we organise the state of the art in analysis tools to examine the various kinds of objects created during analysis. One particular class of artefact, which we call a replayable, is the focus of our attention. We define this object through the operations which can be performed on it: synchronisation, visualisation, transformation and enrichment.
In Chapter 3, after a brief overview of the kinds of models and their aims, we propose a model for replayables which enables the operations defined on them. We discuss this model with regard to the state of the art and further examine the properties of replayables with regard to visualisation and transformation.
In Chapter 4, we present the analysis tool Tatiana (Trace Analysis Tool for Interaction Analysts), an implementation of the replayable model which provides analysts with an integrated analysis environment for the manipulation of replayables. We show how Tatiana has been designed with extensibility in mind, making it not only a platform for analysis but also an environment within which programmers can include new kinds of visualisation, enrichment and transformation and benefit from the existing operations on replayables.
In Chapter 5, we first present various case studies which have used Tatiana. We use these case studies to evaluate the results presented in the preceding chapters and discuss the limitations of our work. Finally, we examine the implications for future research in analysis of CSCL and
human interaction data in general, in trace engineering and in the use of computer science methods to automate the analysis of human interaction data.
1 Research Issues
1.1
Introduction
In order to define the research issues which need to be addressed in the development of a model for the analysis of CSCL data and for capitalisation on these analyses, we must first give an overview of the field and the work which is related to the problem at hand.
In this chapter, we will first examine the field of CSCL and some of the challenges faced during analysis. We will then give an overview of the usage of traces (a word to which we will later give a more precise definition but which can be roughly equated to recordings of human interactions) and present the state of the art in terms of methods for the analysis of these traces. Through discussion of the state of the art, we will show where there is a need for further research to be done resulting in a presentation of the three goals of this dissertation.
1.2
An overview of CSCL
The field of CSCL (or Computer Supported Collaborative Learning) concerns the study a) of learning in situations which are b) collaborative (or cooperative) and c) computer mediated. Koschmann (2002) defines this more precisely as “a field centrally concerned with meaning and practices of meaning-making in the context of joint activity and ways in which these practices are mediated through designed artefacts.” (p.18) In this definition, the three core terms of “learning”, “collaboration” and “computer support” can be elaborated upon.
Collaboration and cooperation have been distinguished (Dillenbourg, 1999) as being respectively an activity which is made with an effort to maintain a joint conception of a problem and an activity wherein roles are distributed and tasks are executed in parallel in a co-ordinated way. For example, moving a piano without damaging it must be done in collaboration by several people whereas moving a stack of boxes can be done in cooperation with each box moved by a single person.
Collaborative learning can be explained according to several epistemologies as summarized by Suthers (2006). Most accounts of learning during joint activity take a constructive stance. Constructivism (Piaget, 1976) suggests that learners learn through their own efforts at making
sense of the world. In CSCL, the emphasis is placed on intersubjective learning: that individual learning can occur through a group’s efforts to create new meaning. This individual learning can be explained variously through a knowledge-communication epistemology (Wenger, 1987), through the claim that knowledge is jointly created by a group or, more extremely through a knowledge building epistemology, which extends the idea of intentional learning (Scardamalia & Bereiter, 1991) to group contexts: that groups of learners examine the limits of their knowledge and make a deliberate effort to extend this limit. Suthers suggests that CSCL should be centrally concerned with intersubjective meaning-making.
“To study the accomplishment (a post hoc judgment) of intersubjective learning we must necessarily study the practices (the activity itself) of intersubjective meaning-making: how people in groups make sense of situations and of each other.” (Suthers, 2006, p. 321)
In this context, computer-mediation can take various roles (De Vries, Lund, & Baker, 2002). It can serve as a collective memory of what has been constructed, allowing participants to review what has already been done, through the persistence of the medium. It can serve as a means of focusing the point of discourse and action, in order to better the joint conception of the problem necessary for collaboration or, in the case of learning situations which have been designed by a teacher, in order to constrain or guide the group activity. It can serve as a representational medium, within which participants can construct a shared artefact such as a text, an argumentative graph or a UML diagram. Finally, it can serve simply as a medium for communication. Suthers claims that
“the technology side of the CSCL agenda should focus on the design and study of fundamentally social technologies that are informed by the affordances and limitations of those technologies for mediating intersubjective meaning making.” (Suthers 2006, p. 326)
According to their epistemology of learning and their research questions, researchers may be led to design and evaluate pedagogical scenarios which can define a collaboration protocol (e.g. Jermann & Dillenbourg, 2003) or simply plan the work a group should do. Suthers (2006) argues that while the use of computer-mediation can help carry out such pedagogical scenarios, such activities could also be carried out with pen and paper and are not therefore central to CSCL. On the other hand, while the use of technology enables distant collaboration and/or learning, this is not a key characteristic of CSCL as all four roles of computer mediation can be valid in face-to-face uses of technology (although the need for computer-mediated communication when verbal communication is available is not immediately
apparent, but has been shown to be useful, for example, when anonymous discussion can be of benefit (Gelmini Hornsby et al., 2008)).
Related fields to CSCL include CSCW (or computer supported collaborative work) and TEL (or technology enhanced learning). In CSCW, the context is a joint activity which is not concerned with learning, but with achieving a task. Some situations can be viewed as containing aspects of both these fields, for example when a teacher sets a task which must be carried out collaboratively, analysis could focus on how the joint activity is carried out or on how this activity is relevant to learning. In TEL, learning does not necessarily happen during a joint activity but is computer-mediated in some way. This can include many other epistemologies of learning, such as those which are more teacher centric (e.g. the teacher transfers knowledge to the students), and includes several roles for the computer, such as a communication device, a guide or a simulator.
1.2.1
Research questions in CSCL
Some examples of research questions in CSCL include identifying the link between a usage pattern, a tool or a pedagogical scenario on the one hand and a learning outcome or the quality of a learner’s productions on the other (e.g. Lund, Molinari, Séjourné, & Baker, 2007), bringing about a given pattern whose outcome may be positive (e.g. Ronteltap, Goodyear, & Bartoluzzi, 2004), or studying how learners appropriate technological affordances (e.g. Overdijk & van Diggelen, 2008).
The methodologies to examine these questions are summarized by Suthers (2006) into three traditions: iterative design, experimental and descriptive. Iterative design tends to explore the “space” of technological affordances for learning, gradually improving technological artefacts by identifying what seems to be more or less favourable. Experimental studies compare the outcome of a group in a given condition with that of a group in a control condition, using methods such as content analysis (Strijbos, Martens, Prins, & Jochems, 2006) where codes are attributed to various events and statistical analysis is performed on those codes. One of the difficulties in this case is achieving sufficient intra- and inter-group homogeneity to achieve results with sufficient statistical significance. Another major difficulty is sufficiently isolating the variables of study so that the control condition differs from the experimental condition only in a few well understood ways. Finally, the necessity of controlling the conditions means that they are necessarily contrived situations whose results might not be applicable to more “ecological” situations. Descriptive studies rather attempt to describe what happened in
“natural situations”, letting the interpretation emerge from the data, using methods born from ethnomethodology such as conversational analysis (Sacks, Schegloff, & Jefferson, 1974). These studies tend to be time-consuming and do not easily lend to predictive generalisations. Strijbos & Fischer (2007) describe how the limits of these various methods lead them to be combined either by triangulation of several results (mixed methods) or by developing new methodologies which are particularly adapted to a particular goal (hybrid methods). They explain that in order to do so successfully, a deep understanding of the constituting methodologies is necessary and that the standards to which the analysis has been held must be clearly spelled out in order that other researchers be able to understand and evaluate the results.
Whatever the methodology used, researchers are led to collect some kind of data and construct an analysis of that data. This data can include recordings of the activity which is being studied, pre- and post- tests and other information such as interviews, surveys, etc. Learning can then either be evaluated through tests or, as advised by Suthers (2006) and Koschmann (2002) by examining the activity itself and showing that it is composed of events which – according to a certain epistemology of collaborative learning – lead to learning. In this dissertation, we are primarily concerned with the kinds of methodologies whereby the activity itself is examined – and which therefore have led to the recording of data about this activity. This focus stems from the kind of research which is carried out at ICAR and more generally within the LEAD project.
1.2.2
Difficulties in the analysis of CSCL data
In order to record a CSCL activity, it is first necessary to record the computer-mediated interactions (leading to log files or what some authors call a digital trace). However, this is often not enough, video being necessary to capture the relevant offline context (Avouris, et al., 2007). Harrer et al. (2007) draw on the collective experience of the researchers in the Cavicola project to define the analysis process as being composed of a sequence of operations including capture, segmentation, annotation and coding, analysis, visualisation and interpretation. These operations are difficult for a number or reasons, particularly when they are not assisted by technology.
First, the recorded data is often hard to understand from a syntactic and semantic standpoint. Recordings in the form of log files are typically opaque to a non-technological reader, being
written in a shorthand which is designed to be understood by computers rather than humans. Once the actual format is understood, the reader then has to reconstruct the activity which may have led to such a recording. In the best case, the events which were chosen to be recorded in the trace match the kind of events which are of interest to the researcher (e.g. turns taken in a chat dialogue). In other cases, however, the events are not at the correct kind of granularity or do not directly show the whole of what happened. For example, in a game where children must reconstruct a picture story by placing images from a scrambled pool in the correct order, the placing of the last image causes all incorrectly placed images to return to the pool. However, the events that are recorded only show which images were placed where and the reader must know how to fill in the gaps. The difficulty in understanding the log files is such that we have often observed5 screen capture being used as a “catch all” method which, while less structurally rich (digital traces at least already include the segmentation of the activity into events) is easier to understand and ensures that nothing that happens on screen is omitted in the recording, despite the fact that such recordings take up large amounts of disk space and are more difficult to analyse automatically6.
Second, the data can be difficult to understand from a pragmatic point of view. Particularly in the case of computer-mediated, face-to-face situations, the activity can be both multi-media and multi-modal (Lund, 2007) encompassing speech, gesture, pen and paper, computer-mediated communication and computer-computer-mediated artefact construction. The recording of such an activity will be spread across video recordings and digital traces, both of which must be understood in concert in order to fully understand the activity (Goodman, Drury, Gaimari, Kurland, & Zarella, 2006). This poses two challenges:
1 ensuring that it is possible to synchronize the recordings (because the timestamps have been aligned or because at least one event occurs across the different recordings and serves as a synchronisation point)
2 performing the actual synchronisation between the two recordings during analysis.
In the case of multiple videos, the second is often achieved by creating a single video which combines these videos in a grid. This solution has the disadvantage of an increase in screen real-estate taken up by the new video and the loss of all but one of the audio channels (unless it is possible to mix the audio channels together in some way that is comprehensible).
5 In our discussions with various researchers over the past three years.
In the case of video combined with digital traces there currently exists no generic solution, although this problem has been addressed by several tools (as we shall see when examining the state of the art).
A third challenge is posed by the sheer quantity of data. Depending on the methodology used, it is frequently unrealistic to analyse a complete corpus in detail. The question is then raised of how to get an overview of a situation and how to identify specific episodes which are appropriate for further investigation.
A fourth challenge arises when carrying out such steps as annotation, coding and visualisation. In such cases, it is frequently necessary to create representations which record the analytic work which has been carried out. Even with computer assistance, it is difficult to automatically create these representations and to create them in a way which renders them shareable and reusable. For example, consider two analyses (cf. Figure 1-1). The first consists of graphically representing the reply-structure of a discussion in a chat (i.e. the researcher transforms a chat log into a graph with boxes and arrows, showing a possible interpretation of the reply-structure underlying the chat). This would typically be recorded as an image, created by hand (or at the very least, the graph structure would, by necessity have to be created by hand). The second analysis consists of coding the same discussion according to the rainbow coding scheme (Baker, Andriessen, Lund, van Amelsvoort, & Quignard, 2007) whereby each utterance is coded according to its role in argumentation. This would also be performed by hand, most likely in software such as ExcelTM. Without dedicated software to support such an activity, there is no way to combine these two analyses, for example by attributing a colour to each code and representing these colours in the graph, without dedicated programmatic intervention (or tedious work by hand).
Figure 1-1 Given two independent analyses such as a colour coding and a contingency graph, how can the two easily be combined ?
These challenges are not all of the same nature. The first two are technical or technological, the third is methodological and the fourth and most important combines both these aspects and is at the core of the issues we address in this dissertation. They are an introductory overview of the difficulties currently faced by researchers wishing to analyse CSCL data.
1.2.3
Capitalising upon and sharing analyses
The last of the previous challenges is emphasized by the necessity of sharing and re-using corpora and analyses. Sharing and re-use is necessary for teamwork and can take several forms: spreading the workload across several team members (Goodman et al., 2006), validating analyses through inter-coder reliability (De Wever, Schellens, Valcke, & Van Keer, 2006), extending the applicability of an analysis scheme to a new field (e.g. Lund, Prudhomme, & Cassier, 2007) or combining the insights of several analysts (e.g. Prudhomme, Pourroy, & Lund, 2007).
At a more community-wide level of consideration, in fields such as physics or chemistry, it is customary to share data when publishing in order that other researchers might verify the interpretation of that data. It is also customary to re-run experiments and perform the same analysis in order to replicate findings. In CSCL, this is not the case, despite recent promising efforts by Reffay, Chanier, Noras & Betbeder (2008), who have been examining how to structure learning corpora in order to share them.
1.2.4
Computer support for analysis
In spite of success stories in using computers to aid this analysis (e.g. Cox, 2007) and the existence of several tools to support it (cf. §1.4), these tools are frequently written to solve very specific problems and require further programmatic intervention to be adapted to new problem sets. Many authors have highlighted the need for better and more generic computer support for analysis (Fisher & Sanderson, 1996; Hilbert & Redmiles, 2000; Thomas & Cook, 2005; Suthers, 2006). Before examining the existing tools, we first need to define in greater detail the nature of recordings of human activity, particularly in computer-mediated situations.
1.3
Traces of human activity
In an ideal situation, a person wishing to study an activity would observe it (being therefore limited to what is observable) and analyse it directly, making sure to observe exactly that which is pertinent to their analysis. The fact that this is impossible in practice leads to the necessity of creating a recording of the observable events which are considered pertinent with regard to some goal. In this dissertation we will define a trace as being such a recording. This inherently poses a paradox (Georgeon, 2008): how can we know what is pertinent to record without having studied it? Does not the fact of judging something pertinent and therefore worthy of recording beg the question of what will be found pertinent during the analysis? Ericsson & Simon (1993) answer that “in designing our data-gathering schemes we make minimal essential theoretical commitments, then try to use the data to test stronger theories” (p. 274). The choice of tracing an activity must therefore in some way presume that the data which is needed to coherently analyse that activity is present in the trace.
Informally, the “traces” (or in English a more familiar word might be “tracks”) of an activity, are the marks which that activity leaves on the environment (but which are not necessarily the goal of the activity and which are not necessarily left intentionally), which can in some way be interpreted in order to make sense of what happened and when. In this kind of situation, some traces are more durable and easier to interpret than others, depending on the medium into which they are inscribed (compare the tracks left by an animal in mud with those left in sand with those left in grass). To extend this metaphor, recording an activity is the act of intentionally manipulating the environment in which it occurs in order that the trace that is recorded be as appropriate as possible to the person who wishes to use it.
In many cases, the modification of the environment for tracing is simple (and potentially disruptive): placing a video or audio recording device in one or more strategic positions. Other modifications include the use of GPS receivers or eye-trackers to trace respectively the usage of gaze and location in the activity being observed.
1.3.1
Tracing computer-mediated activity
The tracing of computer-mediated activity is a special situation in that it is both possible to be very specific in what is traced, and to do so without modifying the environment in a disruptive way. The simplest way is through screen capture, but this does not fully exploit the
fundamental nature of computers – that all actions of the user on one of the computer’s input devices are known to the computer, even if individual programs do not exploit them. By default, these actions do not leave a permanent trace. Tracing must therefore be an intentional action of the programmer, telling the computer to record certain specific events (Laflaquière & Prié, 2009). These might be user-interface events or higher level-ones. This kind of trace can be seen as the transcription, at various levels of granularity, of the screen recording which might otherwise be performed. These traces are sometimes referred to as digital traces (ibid.) but this term is confusing and should probably be avoided. Indeed, a video recording can be made digital, and a screen capture is certainly digital, but neither matches the term intended by the word “digital trace”. We will discuss the properties of different kinds of traces in chapter 3, until then using the term digital trace to refer to an event-based trace of computer-mediated interactions.
In a collaborative computer-mediated activity, a single event might have different effects at different levels: clicking on a button (UI level), triggering a given action (local program level) and sending a message (distributed program level). As nothing is traced by accident, choosing what to trace becomes an important consideration. One answer could be “everything”, but this can lead to huge amounts of data that we are as yet ill equipped to deal with. Another approach, used in the study of collaborative work, is to trace only those actions which are collaborative (both for the pragmatic reason that they often transit via the server in a server-client architecture and for the epistemological reason that). Harrer et al. (2004) define a collaborative action as:
An action that affects or can affect the collaborative process. The action itself or its effect should be perceived by at least a member of the group distinct of the one that performed the action. (p. 6)
However, Mühlenbrock (2004) suggests that actions can present various degrees of interactivity, depending on parameters such as whether the action is performed in presence of others, whether it is related to other actions, etc. This indicates that whether an action is collaborative or not (and therefore might be worthy of being traced or not) is subjective and highly contextual. Other solutions to the problem of what to trace range from the pragmatic approach of tracing as much as possible and hoping that it will prove sufficient, to a very precise definition of what needs to be traced to answer a given research question (Laflaquière & Prié, 2009).
1.3.2
Uses of digital traces beyond analysis by
researchers
Digital traces can be exploited within a wider context than analysis by researchers, in order to provide a better experience to users of digital environments. The treatments applied to traces in these situations differ from those applied by researchers in that they must often be automated (in order to be exploited in real-time), leading to research being performed on visualisation (Dimitracopoulou & Bruillard, 2006) and the calculation of interaction indicators (Harrer et al., 2004), defined as being the result of application of some data processing method and being somehow related to the mode, process or quality of interactions in a group setting.
The first “audience” for traces are the producers of these traces themselves. Traces can be used to present the user (or group) with some kind of feedback to his past activity (Jermann, Soller, & Mühlenbrock, 2001), ranging from a mirror to increase self-awareness, to a guide which attempts to steer the user towards some (presumably desirable) activity. Another use is to allow the system or program which produced the traces to automatically modify its behaviour, based on how it has been used in the past, adapting itself to the user and affording a personalised experience (Laflaquière, Champin, Prié, & Mille, 2005). Finally, the user can browse his own traces (such as web histories), using them as an inscription of his past activity rather like some people take notes of how they accomplished something or record where they have been and what they did (Laflaquière & Prié, 2009). In a group context, particularly in the workspace, this extends to an enterprise knowledge-base.
The other “audience” for traces are people who would like an overview of what a user, a set of users or a group is doing (e.g. France, Heraud, Marty, & Carron, 2007; May, George, & Prévôt, 2008; De Laat, Chamrada, & Wegerif, 2008). In learning situations, this typically concerns teachers and tutors who don’t have the time or ability (in the case of distant learning) to interact with each student individually, but who want to know which students and groups are performing well and which are in need of assistance. Outside of learning situations, web analytics software allows webmasters to examine who is visiting their site, and network analysis software allows network administrators to monitor their systems, possibly looking for fraudulent activity (Denning, 1986).