HAL Id: hal-00524998
https://hal.archives-ouvertes.fr/hal-00524998
Submitted on 10 Oct 2010HAL is a multi-disciplinary open access archive for the deposit and dissemination of sci-entific research documents, whether they are pub-lished or not. The documents may come from teaching and research institutions in France or abroad, or from public or private research centers.
L’archive ouverte pluridisciplinaire HAL, est destinée au dépôt et à la diffusion de documents scientifiques de niveau recherche, publiés ou non, émanant des établissements d’enseignement et de recherche français ou étrangers, des laboratoires publics ou privés.
Assessing the tribocorrosionnext term behaviour of Cu
and Al by electrochemical impedance spectroscopy
Jean Geringer, Bernard Normand, Catherine Alemany-Dumont, Robert
Diemiaszonek
To cite this version:
Jean Geringer, Bernard Normand, Catherine Alemany-Dumont, Robert Diemiaszonek. Assessing the tribocorrosionnext term behaviour of Cu and Al by electrochemical impedance spectroscopy. Tribology International, Elsevier, 2010, 43 (11), pp.1991-1999. �10.1016/j.triboint.2010.04.018�. �hal-00524998�
1 2 3 4 5 6 7 8 9 10 11 12
ASSESSING THE TRIBOCORROSION BEHAVIOUR OF Cu AND Al
13BY ELECTROCHEMICAL IMPEDANCE SPECTROSCOPY
1415 16 17 18
Jean Geringera, Bernard Normandb, Catherine Alemany-Dumontb, Robert Diemiaszonekb 19 20 21 22 23 24 25
a)Ecole Nationale Supérieure des Mines de Saint-Etienne, Center for Health Engineering, 26
UMR CNRS 5146, IFR 143, Biomechanics and Biomaterials Department,
27
158 cours Fauriel, 42 023 Saint-Etienne Cedex 02, France
28
Tel: +33 477 426 688; Fax: +33 477 420 157; geringer@emse.fr
29 30
b)INSA-Lyon, MATEIS CNRS UMR 5510, RI
2S group, Domaine Scientifique de la Doua, 31
7 av. Jean Capelle, Bât. L. de Vinci, 69 621 Villeurbanne Cedex, France
32
Tel: +33 472 436 287; Fax: +33 472 438 528;
33
Bernard Normand : Bernard.normand@insa-lyon.fr
34
Catherine Alemany-Dumont: catherine.alemany-dumont@insa-lyon.fr
35
Robert Diemiaszonek: robert.diemiaszonek@insa-lyon.fr
36 37 38 39 40 41 42 43 44 45 46 47 48
1
Abstract
2 3
This study is focused on the interests and limits of Electrochemical Impedance Spectroscopy, 4
to establish the electrochemical behaviour of a tribosystem between Cu and Al, in acid 5
solution. The calculated capacitance, in high frequency range, partially allows understanding 6
the double layer state of body in the contact. The Potential of Zero Charge was calculated for 7
Cu sample and it was associated to a potential range for Al. PZC value of each material is 8
discussed as a key parameter of sliding contact. During tests of wear, the EIS results are 9
related to the evolution of adsorbed water molecules. 10
11 12 13
Keywords: Tribocorrosion; Cu; Al; EIS.
14 15 16 17 18 19 20 21 22 23 24 25 26 27 28 29 30 31
1. Introduction
1
Tribocorrosion is defined as materials degradation of solids in contact resulting from 2
chemical, electrochemical and mechanical processes. These surface interactions occur during 3
rolling and/or sliding contact between two materials in a corrosive medium such as an 4
aqueous solution [1]. Thus, in mechanical devices, decreased performance decreasing and 5
environment contamination occur. Tribocorrosion affects numerous industrial fields such as 6
nuclear industry [2], food manufacturing or medical implants [3]. The electric and electronic 7
fields are also increasingly concerned by tribocorrosion. The investigated materials, in this 8
work, are copper and aluminium that are related with these fields. 9
Since the 70s, tribocorrosion processes have been increasingly investigated. Different 10
methods (including design of new tests) are developed to understand, to predict and to model 11
the impact of the mechanical solicitation on the electrochemical properties of materials [4]. 12
As a result, tribocorrosion can be analyzed using classical electrochemical techniques: open 13
circuit potential evolution according to normal load or frequency [5]; potentiostatic 14
measurements for quantitative analysis of wear [6]; current and potential monitoring under 15
open circuit conditions, i.e. electrochemical noise measurements [7]. Electrochemical 16
Impedance Spectroscopy (noted EIS) was also described by several authors as an interesting 17
tool to investigate mechanisms occurring on both material surfaces in contact [8-10]. 18
Interfacial reactivity can be modelled by an association of basic electrical components such as 19
resistance, capacitance or inductance [11]. In this study EIS experiments were performed to 20
obtain these physical values. 21
A model tribosystem based on Al-Cu has been chosen for this study because it 22
highlights galvanic coupling due to the high electrochemical potential gap in the considered 23
electrolyte [12]. Cu effect on the Al corrosion resistance is widely studied in material science 24
[13,14]. Recently galvanic corrosion between Cu and Al was particularly studied by local 25
Electrochemical Impedance Spectroscopy (LEIS) [15]. In contrast, the electrochemical 1
behaviour of the Cu/Al contact under sliding has been much less considered in acidic solution 2
using EIS technique. Acid solution was used for promoting the dissolution of metal and for 3
enhancing galvanic coupling. 4
In this paper, the electrochemical behaviour of Cu and Al was studied separately to 5
characterize the Potential of Zero Charge (noted PZC). This physical characteristic informs 6
about attraction or repulsion phenomena (which play a role in the friction evolution) between 7
two surfaces in contact [6]. The static contact was investigated to estimate the galvanic 8
coupling. Finally, the electrochemical behaviour of dynamic contact, i.e. under sliding 9
conditions was characterized. In addition, SEM and EDS were used to understand the wear 10 mechanisms. 11 12 2. Experimental 13 2.1 Materials 14
The chemical composition of Al alloy (A 2017 [16]) was measured by spark emission 15
spectroscopy on a SEO JY 50 E equipment (Table 1). 16
[Table 1]
17
Cu composition was measured by electrolysis and confirmed by atomic absorption 18
spectroscopy. Because minor metallic elements such as Cr, Ni, Ag, Fe are lower than 0.002 % 19
weight percent, Cu purity was established to 99.80 %. 20
2.2 Tribocorrosion device
21
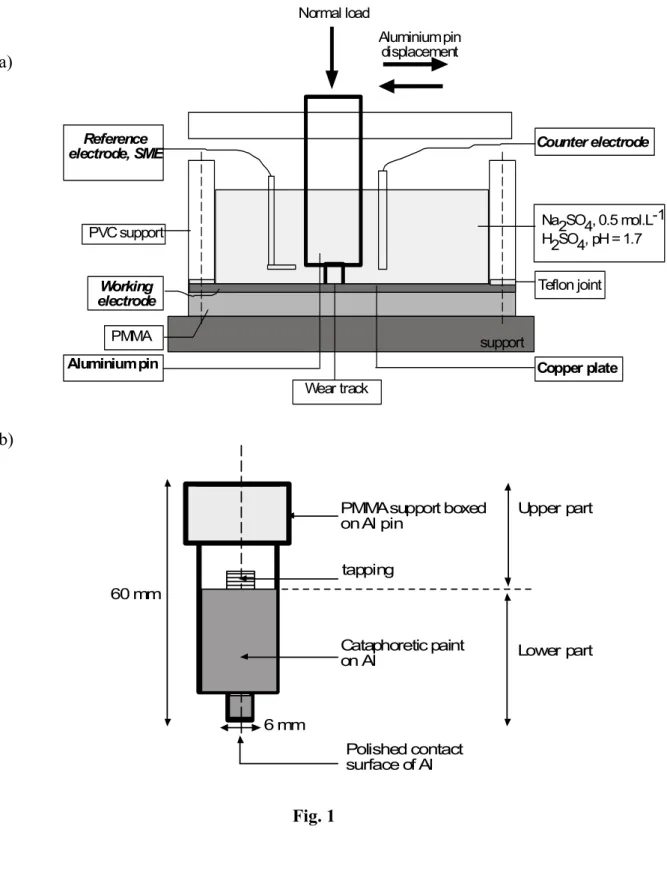
A wear corrosion apparatus was developed in MATEIS laboratory, for pure sliding, 22
from reciprocating displacement, in a pin/disc configuration, figure1. 23
[Figure 1]
1
Displacement amplitude of ± 8.6 mm at a frequency of 1 Hz was applied. Electrical 2
contacts, between device and samples, were eliminated by insulation of samples and elements 3
of the tribosystem. 4
Al alloy pin is presented schematically on figure 1, with an area of 0.28 cm-2. The 5
upper part was embedded in poly (methyl methacrylate) for electrical insulation. The lower 6
part was previously covered by cataphoretic epoxy-amine base paint. 7
The paint protects the lateral surface from corrosion in an acid solution and defines the 8
size of reactive surface. The contact diameter was equal to 6 mm. In addition, to obtain a 9
planar contact, a polishing step of the pin was carried out on the friction device with grit paper 10
of grading 180 to 2500. 11
The Cu samples were discs with a diameter of 25 mm (area of 19.63 cm2) and a 12
thickness of 1 mm machined in industrial production. A surface roughness of Ra = 0.10 ± 13
0.05 µm was obtained after a polishing procedure including grit paper 180 to 1200 and finally 14
a paraffin solution and alumina particles to obtain mirror surface. 15
Normal load equal to 6.7 N was applied by dint of calibrated rod fixing the contact 16
diameter and the temperature was maintained to 23 ± 2 °C. 17
2.3 Electrochemical measurement
18
Acid solution was chosen to maintain an active state of materials constituting the 19
tribosystem [12]. The electrolyte was an aerated solution of 0.5 mol.L-1 Na2SO4 having a pH
20
of 1.7 obtained by a H2SO4 buffer.
21
Electrochemical measurements, including free corrosion potential (Ecorr) as a function
22
of time and electrochemical impedance measurements, were carried out. 23
A mercury/mercurous sulphate (Hg/Hg2SO4) reference electrode, saturated with
1
K2SO4 solution, was used and the ionic junction was located very close to the surface of the
2
working electrode. The potential difference against the standard hydrogen electrode (SHE) 3
was measured about 0.615 V at 25°C. 4
EIS spectra were performed in the frequency range from 10 kHz to 15 mHz at 10 5
points per Hertz decade with an AC voltage amplitude of 10 mV. Data were validated by 6
Kramers-Koenig (K-K) transformation [17,18]. Cu discs and Al pins were studied separately 7
as a working electrode before EIS diagram was performed during friction. Exposed areas of 8
Cu and Al samples were 19.63 cm² and 0.20 cm² respectively. Graphite counter electrode was 9
used with a diameter of 5 mm and a length of 70 mm. Impedance experiments were 10
conducted using Princeton Applied Research (Parstat 2263) equipment. Impedance 11
monitoring was performed at Ecorr and applied potential. 12
2.4 Scanning Electron Microscope
13
Cu and Al samples were observed with a Scanning Electron Microscope (SEM) JEOL 14
6400 coupled with an EDS probe. A gold skin covered the worn surfaces, after friction tests, 15
to highlight transferred particles between two materials in contact. These particles were oxide. 16
They require a gold coating to obtain the best images and to avoid charge accumulation. 17
18
3. Results and discussion
19
3.1 Data analysis
20
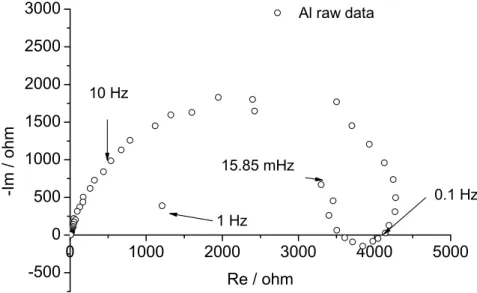
Here, the selected pH is leading to a dissolution of Al and Cu. Figure 2 illustrates 21
experimental EIS response recorded for Al alloy immersed during 3 hours in acid solution. 22
Spectrum exhibits two time constants. At high frequencies, the depressed capacitive loop 23
corresponds to the interfacial capacitance with a native oxide layer on the alloy surface [13]. 24
At low frequencies, the inductive loop is associated with the relaxation processes related to 1
the weakening of the protective efficiency of the oxides layer due to dissolution [13]. Outliers 2
recorded at very low frequencies can be attributed to the non-stability of the Al corrosion 3
processes. Their elimination was improved from Dygas et al. approach [19]. 4
[Figure 2]
5 6
The Nyquist diagram of Cu is represented in figure 3. The diagram is characterized by one 7
depressed capacitive loop with the center under the abscissa axis. Because the pH of the test 8
electrolyte induces an active dissolution of Cu, the reaction mechanism proposed for the 9
larger electrode can be interpreted as the charge transfer resistance (Rct) in parallel with the
10
double layer capacity (Cdl).
11
[Figure 3]
12 13
This approach aims at getting the electrical parameters that are consistent with the materials 14
reactive surface from EIS measurements. Their contributions to the total impedance are well 15
interpreted by analyzing the system thanks to an equivalent circuit. 16
To be useful, the elements of an equivalent circuit should always have a physical meaning in 17
the electrochemical system. In this work, the elements were chosen following these two 18
conditions: 19
• numerous electrical models are proposed for Al alloy sample in different medium 20
including numerous associations of resistance, capacitance and inductance [20-23]. 21
Because this study is dedicated to compare the electrochemical behaviour of each sample 22
separately with one of both samples coupled electrically during friction, the equivalent 23
electrical circuit has to be chosen both for each material and for the tribosystem 24
constituted by both materials in contact. 25
• Reciprocating test lead to a surface activation that could induce some wrong EIS results, 1
especially for low frequencies, in accord with corrosion phenomena. Thus, to get around 2
this point, one considers only high frequencies. 3
By the way, a simple equivalent circuit of a resistor and a capacitor in parallel is 4
sufficient to extract parameters from diagrams of the impedance, at high frequencies. From 5
Nyquist diagrams, the high frequency domain corresponds to the charges transfer. Indeed, one 6
might suggest that friction will exhibit this phenomenon. So, the inductive behaviour of Al 7
alloy sample has been filtered. 8
Figure 4 exhibits the Nyquist diagram of a Cu disc and an Al pin during friction. It 9
depicts a depressed loop. The raw data and the filtered ones are presented. The filtered data 10
are calculated by filtering raw data with a Re(CPEhf, Rhf) circuit. Finally, the filtered data
11
correspond to a weaker frequency range than the raw data, from 104 Hz-15.85 mHz to 104 Hz-12 0.5 Hz approximately. 13 [Figure 4] 14 15
The selected electrical circuit was a series association Re(CPEhf, Rhf) presented in figure 5. Re
16
is the electrolyte resistance. Rhf is a resistance that is associated in parallel with the CPEhf.
17
CPEhf is the Constant Phase Element (hf: high frequencies) used in order to include the
18
divergence from pure capacitive behaviour. The value of CPEhf is as
19 1 ( ) CPE n hf Z Q jω = (eq. 1) 20
Qhf is the numerical value of the admittance
(
1/ ZCPE)
at ω = 1 rad.s-1
(S.sn.cm-2), j2 = -1 the 21
imaginary unit, ω is the angular frequency (rad.s−1) and n is the CPE exponent (0 ≤ n ≤ 1) 22
[Figure 5]
Then electrical values, resistances and capacitances, calculated from CPE, were compared 1
between Al alloy and Cu samples, between the static contact (Al-Cu) and sliding contact 2
(Al/Cu). These results allow calculating the capacitance according to Brug’s relation [24]: 3 1-( ) n n hf hf hf hf C =Q Q R (eq. 2) 4 5
3.2 Impedance diagrams for Al alloy and Cu, separately
6
3.2.1 Al alloy sample
7
During experiments, the Ecorr changes were lower than 10 mV, which is consistent with the 8
small amplitude of the perturbation voltage for EIS measurements. 9
The values of the electrical components were calculated for the same Al sample and different 10
time of storage in the acid solution, they are shown in Table 2. 11
[Table 2]
12
Table 2 exhibits no drastic evolution of the capacitance, the resistance, and n. Thus, it is worth 13
noting that, after 4.5 hours, the electrical behaviour of Al does not suffer changes. 14
3.2.2 Cu sample
15
During experiments, the Ecorr of the Cu sample did not suffer significant changes as the Al 16
sample. The capacitance increases according to the exposure time, in acid solution and Rhf
17
decreases as summarized in Table 3. The CPE exponent values show that the double layer is 18
less and less homogeneous, probably due to the modification of roughness during dissolution. 19
Moreover, due to the Cu dissolution, sulfate diffusion could occur in order to balance charges. 20
As the potential can be considered as constant, charges number increases according to the 21
exposure time. 22
[Table 3]
Because pH is 1.7, Cu dissolution can be described following two steps [25]. The first fast 1
step corresponds to the Cu dissolution from Cu(s) to Cu(I). Cu(I)ads is generally considered as
2
an adsorbed species at the Cu surface and does not diffuse into the bulk solution. The second 3
slower step corresponds to oxidation of Cu(I) in Cu(II). Consequently, one might suppose that 4
higher value of Rhf for Cu than Rhf value obtained with Al can be related to a barrier effect of
5
salt of Cu(II) formation decreasing the kinetic rate of Cu dissolution. In addition, the mass 6
transport has a low influence on dissolution of Cu. 7
3.2.3 Potential at the Potential of Zero Charge (PZC) for Al alloy and Cu
8
Sliding phenomena partially depend on electrostatic state of material surface in contact. The 9
potential of zero charge (PZC) plays a major role in electrostatic processes. Different PZC 10
values for Cu immersed in different solution are proposed in literature i.e. Bockris and 11
Reddy’s report [26]. EIS offers a good method to determine the PZC of materials in solution 12
which is considered like the minimum of the capacitance according to the applied potential 13
[25]. If the capacitance is minimum, the thickness of the double layer is maximum and the 14
charges equilibrium is reached to the zero charge state. 15
A series of impedance spectra for Cu and Al electrodes has been recorded on sulphuric acid 16
solution in a large range of potential (between -0.47 and + 0.37 V vs. Ecorr). Double layer
17
capacitances evaluated from electrical equivalent circuit described previously, are plotted 18
against applied potential in Figure 6. Capacitances at Open Circuit Potential (OCP) are also 19
reported on the figure 6. 20
[Figure 6]
21
Figure 6 shows that Chf of Al sample is approximately constant. The Chf, calculated at open
22
circuit potential (Ecorr), is four times higher than the one calculated at applied potential. 23
Although the potential value is the same, the previous cathodic polarization modifies the Al 24
alloy surface during applied potential tests. The curve does not exhibit a minimum of 1
capacitance. 2
For the Cu sample, Chf is the lowest at Ecorr. The minimum corresponding potential is more
3
negative than the Ecorr. At high frequencies, a capacitive loop from the relaxation of the 4
double-layer capacitance is observed. The faradic process is slow compared to double layer 5
relaxation (phenomena can not be coupled) and specific ions are not adsorbed. However, this 6
last hypothesis could be questioned. Indeed, the capacitance of Cu, at open circuit potential 7
(OCP) potential is not rigorously constant and the salts on the surface could participate in this 8
evolution [25]. The same behaviour could occur at applied potential, close to Ecorr. However, 9
the evolution of the Cu Chf shows a minimum that is relevant to the PZC value.
10
In this work, the PZC value of Cu sample is estimated to be -0.47 ± 0.04 V versus MSE that is 11
in accordance with Ma et al. [25] who found a value of -0.56 V in sulphuric acid, 0.5 mol.L-1. 12
However, experimental protocol does not allow to find the PZC of Al alloy. Thus, one might 13
suggest that the PZC of Al alloy is close to the OCP around -1.13 V vs MSE [26]. Further 14
investigations have to be carried out with only one sample per value of applied potential. 15
Figure 7 shows evolution of OCP of the contact between Al and Cu before, during and after 16
sliding. 17
[Figure 7]
18
The OCP value is between one of PZC of Cu and Al. Thus, positive charges on Al alloy 19
surface are opposite to negative ones on Cu surface. If the electrostatic attractions are 20
considered, the friction coefficient would be higher in these conditions meaning that EIS 21
measurements contribute to revealing the synergistic effect in tribocorrosion. However, no 22
friction coefficient can be measured with this equipment. Additional works will be carried out 23
in order to correlate friction coefficient evolution at different applied potential. Related to this 24
electrostatic effect between surfaces in contact, this problem was already highlighted in the 1
case of 316L stainless steel / poly(methyl)methacrylate contact [6]. 2
3
3.3 Impedance diagrams for static and dynamic contacts
4
3.3.1 Static contact between Cu and Al
5
Table 4 shows the capacitance, the resistance and χ2, defined as 6
(
)
22
, ,
log i experimental log i calculated
i
Z Z
χ =
∑
− , for the static contact between Cu and Al alloy, at high 7frequencies. The capacitance can be considered constant as well as the resistance. 8
[Table 4]
9
Table 5 presents capacitances and resistances of: - Al electrode before contact; -Cu electrode 10
before contact; - Al/Cu static contact: association of Al alloy and Cu in static contact. Table 5 11
presents normalized results (table 5a) and no normalized ones (table 5b) according to areas of 12
each surface. 13
[Table 5]
14
On Table 5 a), the capacitance calculated for the static contact was close to the addition of the 15
capacitances of Al alloy and Cu. Moreover, the resistance, Rhf, is close to (1/Rhf(Al)) +
16
(1/Rhf(Cu)). As a result, the Al alloy and Cu contact is consistent with a parallel association
17
for normalized electrical parameters. On Table 5 b), the results are reported without 18
normalization. The sum of capacitances that are consistent with a parallel association of 19
capacitances is not equal to the capacitance of the static contact. The parallel association of 20
resistances is not consistent with the resistance of the static contact. The no-normalized Rhf,
21
respectively Chf, of the static contact is 20 times lower, respectively 10 times higher, than that
22
of normalized value. Due to the decrease of the Rhf, one might suggest that the dissolution is
triggered by the galvanic coupling. The potential difference between both materials is 1
significant. Al and Cu samples play roles of the anode and the cathode, respectively. 2
Cathodic reaction (oxygen reduction) occurs on Cu surface and anodic dissolution on Al 3
alloy. The entire Cu surface does not play the role of cathode. Anodic reaction should occur 4
on the Cu worn zone, due to galvanic coupling, during friction. Around the friction zone, one 5
might suggest the local potential should decrease from anodic to cathodic values far from the 6
contact zone. 7
3.3.2 Dynamic contact made of Cu and Al alloy and post contact
8
During friction, numerous wear phenomena occur: transfer, oxidation, mechanical 9
degradation as ploughing, wear, etc. The worn area represents 4 % of the entire Cu area. The 10
particular behaviour of the worn track area could not be clearly isolated. As the entire Cu 11
surface was selected, worn track can be neglected for resistance and capacitance 12
consideration. This work could be considered as the first approach. 13
Figures 8 a), b), and c) show the capacitances, the resistances, and the time constants for 14
different experimental durations, respectively. It is worth noting the values are not normalized 15
according to the surface of samples. Five steps have been highlighted on this figure: EIS 16
results for (1) Cu and Al alloy, separately, before friction; (2) static contact, before friction; 17
(3) dynamic contact, friction test; (4) static contact after friction test; (5) separated samples. 18
Each step is discussed below. 19 20 [Figure 8] 21 22 3.3.2.1 Steps 1, 2, and 3 23
Steps 1 and 2 were analyzed in previous paragraphs. Step 3 indicates that the Chf value
24
decreases when the friction starts. Thus, Chf increases during friction. The Rhf increases at the
25
beginning of friction and during friction. The Rhf.Chf time constant is the same, at the
beginning of friction, as the one at the end of static contact. Thus, during friction, the time 1
constant increases according to the time. At the beginning of friction and during friction, the 2
convection occurs due to Al alloy pin displacement in the solution. The active surface is then 3
disturbed. During the friction, the Cu surface becomes active. After 10 hours of friction, the 4
time constant is higher than that of Al or Cu samples. This increase could be related to the 5
dissolution involved by friction. 6
This electrochemical behaviour is reproducible, two series of experiments were carried out 7
and the same values were obtained. 8 hf C S = 0 e εε (eq. 3) 9
S is the double layer area, e is the thickness, ε and ε0 are the permittivity of the adsorbed
10
water and of vacuum, respectively. 11
Rhf.S = ρ.e (eq. 4)
12
ρ is the resistivity that varies to the inverse of the ions concentration. 13
If Chf .R Shf 0
S =ρεε (eq. 5)
14
increases, either ρ or ε increases. The friction triggers the dissolution; indeed, the ions 15
concentrations should increase. Thus, the resistivity should decrease contrary to the increase 16
of the product Rhf.Chf. Therefore, the relative permittivity should increase. The permittivity of
17
the water molecules could account for this evolution. Indeed, according to the orientation of 18
the adsorbed water molecules, the relative permittivity should be changed [28]. Because data 19
seem to prove the increase of ε, the wear mechanisms could modify the charges orientation on 20
materials surface. The EIS results, with taking care attention about the stationary, seem to be 21
consistent with the modification of the double layer. One might suggest that the permittivity is 22
the global physical value that changes. At the ions scale, the corrosion triggers metal ions 1
dissolution. The charge balance involves the anions displacement close to the double layer. In 2
next steps for modelling, the permittivity could be described as a function of ion 3
concentration and/or friction parameters taking into account the permittivity evolution, 4
especially the imaginary part for the dissipative phenomena. 5
6
3.3.2.2 Step 4
7
Step 4 concerns the Al-Cu contact after friction. 5 hours after the end of rubbing, the values of 8
the electrical components are close to those of step 3, i.e. during friction. One can conclude 9
that the electrochemical behaviour becomes similar to the one during friction. The dissolution 10
continues being active, because of the enhancement of the galvanic coupling between Cu and 11
Al alloy, after removing the passive layers during friction. Finally, one might suggest that the 12
quality of the rebuilding passive layer is not sufficient for protecting the materials in contact. 13
14
3.3.2.3 Step 5
15
Step 5 shows that the resistances of both samples are weaker than those during friction. Thus, 16
the capacitances values increase and the values exhibit discrepancy. 17
The Al resistance, step 5, is approximately equal to Al resistance, step 1. The Cu resistance of 18
step 5 is approximately 100 times lower than that of step 1. The Al and Cu capacitances of 19
step 5 are the same as that of step 1, and 100 times higher than that of step 1, respectively. 20
Finally, one might conclude that the time constant is almost the same for each sample, before 21
contact and after friction. However, The RhfChf of Al increases according to the time after
22
friction. 23
The decrease of Cu resistance, after friction, could be related to the decrease of the transfer 1
charges resistance on the surface. The increase of the Cu capacitance could be related to the 2
worn zone. The Cu surface increases due to friction zone, in eq. 3. The discrepancy of Cu 3
capacitances (resistances and time constants) values is higher than that of Al sample 4
capacitances. The friction zone on Cu has a significant effect on the electrochemical 5
behaviour. The time constant of Cu sample, after friction, indicates a huge discrepancy. 6
Moreover, due to Al particles, see part 3.4, the galvanic coupling could reinforce the 7
corrosion of Cu. The worn zone is the location of a drastic dissolution; the oxides film is not 8
as efficient as the one outside the worn zone. The contribution of the third body could play a 9
significant role, the interpretation is, nowadays, not obvious. Further investigations will be 10
carried out to better understand the third body contribution. 11
12
3.4 Wear track analyses
13
Figure 9 shows the qualitative EDX analyses and SEM observations of wear track on Cu 14
plate. The gold presence results from sample preparation, after wear tests and before SEM 15
images. The gold deposit was carried out to provide the best images due to presence of 16
insulating oxides on sample surfaces. 17
Figure 9a presents EDX spectrum in the worn zone. It can be compared with figure 9b that 18
represents analyses outside the track. Transferred Al particles are then observed on the Cu 19
sample. Other than the mechanical aspects of wear, previous PZC discussions could partially 20
explain adhesion phenomena of Al on Cu. Figures 9c and 9d exhibit cracks and debris 21
characteristic of fatigue damages. 22
Figure 10 shows qualitative EDX analyses and SEM observations of wear track on Al pin. 23
These pictures highlight numerous Cu deposits on Al alloy confirmed by EDX analyses 24
shown in figure 10a. Figure 10b corresponds to this particle. Figures 10c and 10d respectively 25
show ploughing by Cu on Al and Cu particles, and small debris, agglomerated on the Al alloy 1
sample. Debris particles were probably transferred onto the Al alloy sample by adhesion 2 mechanism. 3 4 [Figure 9] 5 6 [Figure 10] 7 8 4. Conclusion 9
In this present paper, the EIS contribution in tribocorrosion was investigated from a specific 10
friction device on a Cu/Al tribosystem. EIS is well suited for the study of tribocorrosion 11
phenomena because it allows characterization of the physical state of the tribosystem/solution 12
interface. 13
The assumptions are discussed in terms of the frequency range determination to ensure steady 14
state system and to obtain the pertinent interface simulation by an electrical equivalent circuit. 15
Once these key limitations of EIS for tribocorrosion have been solved, this technique is 16
presented as an efficient tool to explain the surface charges contribution to the tribocorrosion 17
wear phenomena. 18
Due to the EIS analyses of each sample, separately, an estimated value of PZC was 19
calculated. According to the Ecorr during friction, the PZC values predict that the negative 20
charges are on the Cu surface and the positive ones are on the Al surface. Thus adhesion and 21
material transfer could occur, this expectation was confirmed by SEM and EDX analyses. 22
The impedance diagrams of the static contact exhibit that Cu and Al in contact were 23
interpreted by EIS as a parallel association of impedance, with normalized data. The results 24
are consistent with delocalized reactions. About the dynamic contact, EIS informs about an 25
ions concentration decreasing in the double layer. Moreover, the relative permittivity of 1
adsorbed water molecules and ions could account for increasing the time constant. 2
One can conclude that EIS is an interesting tool in order to follow degradations of surfaces 3
submitted to friction. EIS related to tribology could be, in next years, a useful tool for 4
following material behaviour submitted to friction in a solution. 5
Additional works are in progress in order to improve numerous results. The surface ratio on 6
the Cu plate, between a worn surface and an exposed one, will change in order to understand 7
and to follow, by EIS, the location of the cathodic reaction and the reaction rate. Further tests 8
will be carried out with a friction device that will allow monitoring tangential load and the 9
dissipated energy for relating the mechanical parameters to the electrochemistry. Moreover, 10
EIS could be an interesting method to complete previous investigations, such as fretting-11 corrosion tests. 12 13 Acknowledgements 14
The authors are grateful to Robert Di-Folco for his significant technical contribution, 15
to Dr. Kyungmok Kim and to Dr. Nicolas Mary for readings and helpful discussions. 16
References
[1] Landolt D, Mischler S, Stemp M. Electrochemical methods in tribocorrosion: a critical appraisal. Electrochimica Acta 2001;46(24-25):3913-3929.
[2] Kaczorowski D, Vernot J-P. Wear problems in nuclear industry. Tribology International 2006;39(10):1286-1293.
[3] Yan Y, Neville A, Dowson D, Williams S. Tribocorrosion in implants-assessing high carbon and low carbon Co-Cr-Mo alloys by in situ electrochemical measurements. Tribology International 2006;39(12):1509-1517.
[4] Landolt D. Electrochemical and materials aspects of tribocorrosion systems. Journal of Physics D: applied physics 2006;39:3121-3127.
[5] Celis J-P, Ponthiaux P, Wenger F. Tribo-corrosion of materials: Interplay between chemical, electrochemical, and mechanical reactivity of surfaces. Wear 2006;261(9):939-946.
[6] Geringer J, Forest B, Combrade P. Wear analysis of materials used as orthopaedic implants. Wear 2006;261(9):971-979.
[7] Berradja A, Déforge D, Nogueira R-P, Ponthiaux P, Wenger F, Celis J-P. An electrochemical noise study of tribocorrosion processes of AISI 304 L in Cl- and SO42- media. Journal of Physics D: applied physics 2006;39:3184-3192.
[8] Ponthiaux P, Wenger F, Galland J, Lederer G, Celati N. Utilisation du bruit électrochimique pour déterminer la surface dépassivée par frottement, cas d’un acier Z2CND 17-13 en milieu chloruré (NaCl 3 %). Matériaux et techniques, 1997;numéro hors série: 43-46.
[9] Ponthiaux P, Wenger F, Drees D, Celis J-P. Electrochemical techniques for studying triocorrosion processes. Wear 2004;256(5):459-468.
[10] Macdonald D.D. Relections on the history of electrochemical impedance spectroscopy. Electrochemica Acta 2006;51: 1376-1388.
[11] Gabrielli C. Identification of electrochemical processes by frequency response analysis. Technical report 004/83, Solartron Analytical, 1998.
[12] Pourbaix M. Atlas d'équilibres électrochimiques. Paris: Gauthier-Villars, 1963.
[13] Keddam M, Kuntz C, Takenouti H, Schuster D, Zuili D. Exfoliation corrosion of Al alloys examined by electrode impedance. Electrochimica Acta 1997;42(1):87-97.
[14] Guillaumin V, Mankowski G. Localized corrosion of 2024 T351 Al alloy in chloride media. Corrosion Science 1998;41:421-438.
[15] Jorcin J-B, Pébère N, Blanc C. Etude du comportement en corrosion d’alliages modeles Al/cuivre à l’aide de la spectroscopie d’impedance electrochimique locale. Proceedings of the 19e forum sur les impédances électrochimiques, 2006.Paris: Université Pierre et Marie Curie, 2006. p.77-86.
[17] Macdonald D, Sikora E, Engelhardt G. Characterizing electrochemical systems in the frequency domain. Electrochimica Acta 1998;43(1-2): 87-107.
[18] Orazem M. Systematic approach toward error structure identification for impedance spectroscopy. Journal of Electroanalytical Chemistry 2004;572: 317-327.
[19] Dygas J.R, Breiter M.W. Variance of errors and elimination of outliers in the least squares análisis of impedance spectra. Electrochimica Acta 1999;44:4163-4174.
[20] Snogan F, Blanc C, Mankowski G, Pébère N. Characterisation of sealed anodic films on 7050 T74 and 2214 T6 Al alloys. Surface and Coatings Technology 2002;154(1):94-103.
[21] Nigam A.K, Balasubramaniam R, Bhargava S, Baligidad R.G. Electrochemical impedance spectroscopy and cyclic voltammetry study of carbon-alloyed iron aluminides in sulphuric acid. Corrosion Science 2006;48(7):1666-1678.
[22] De Wit J.H.W, Lenderink H.J.W. Electrochemical impedance spectroscopy as a tool to obtain mechanistic information on the passive behaviour of Al. Electrochimica Acta 1996;41(7/8):1111-1119.
[23] Harrington D.A, van den Driessche P. Stability and electrochemical impedance of mechanisms with a single adsorbed species. Journal of Electroanalytical Chemistry 2001;501:222-234.
[24] Brug G.J, van Eeden A.L.G, Sluyters-Rehbach M, Sluyters J.H. The analysis of electrode impedances complicated by the presence of a constant phase element. Journal of Electroanalytical Chemistry 1984;176(1-2);275-295.
[25] Ma H, Chen S, Yin B, Zhao S, Liu X. Impedance spectroscopic study of corrosion inhibition of Cu by surfactants in the acidic solutions. Corrosion Science 2003;45:867-882.
[26] Bockris J.O.M, Reddy A.K.N. Modern Electrochemistry Vol. 2, 1970. New-York: Plenum Press. p. 708.
[27] Brigham R.J. Crevice corrosion initiation and the potential of zero charge. Corrosion Science 1989;29(8):995-1001.
[28] Landolt D. Corrosion et chimie de surfaces des métaux. Lausanne: Presses Polytechniques et Universitaires Romandes, 1997.p. 90-109.
Tables
Table 1: A 2017 chemical composition (weight %).
Table 2: EIS results calculated from Al sample immersed in acid solution.
Table 3: EIS results calculated from Cu sample immersed in acid solution.
Table 4: EIS results calculated from static contact between Cu and Al.
Table 5: EIS results from: -Al electrode; Cu electrode; Al-Cu static contact ; a) results are
reported according to an area normalization of samples, Al area of 0.28 cm2, Cu area of 19.64 cm2; b) results are reported without normalization.
Table 1: A 2017 chemical composition (weight %).
Elements Cu Mn Mg Si Fe Zn Cr Pb Ti Sn Ni Al Weight % 4.00 0.71 0.66 0.66 0.44 0.17 < 0.05 < 0.05 0.03 < 0.02 < 0.01 bal
Table 2: EIS results calculated from Al sample immersed in acid solution.
Duration Chf Err (Chf) n Err (n) Rhf Err (Rhf) χ2
hour µF µF ohm ohm
1.5 12.8 4.8 0.88 0.05 6110 1360 1.0.10-3
3 12.6 4.2 0.89 0.07 5950 1165 1.7.10-3
4.5 12.8 4 0.90 0.07 5575 1315 1.6.10-3
Table 3: EIS results calculated from Cu sample immersed in acid solution.
Duration Chf Err (Chf) n Err (n) Rhf Err (Rhf) χ2
hour µF µF ohm ohm
3 98 4 0.85 0.04 1590 42 4.2.10-3
5 118 4 0.84 0.12 997 25 3.8.10-3
6 171 8 0.81 0.01 615 15 4.6.10-3
6.5 192 8 0.81 0.01 549 13 4.2.10-3
Table 4: EIS results calculated from static contact between Cu and Al.
Duration Chf Err (Chf) Rhf Err (Rhf) χ2
hour µF µF ohm ohm
23 1577 122 52 1 2.0.10-3
25 1573 110 50 1 1.7.10-3
27 1656 20 52 1 1.6.10-3
29 1658 20 53 2 1.7.10-3
31 2060 169 45 1 2.2.10-3
Table 5: EIS results from: -Al electrode; Cu electrode; Al-Cu static contact ;
a) results are reported according to an area normalization of samples, Al area of 0.28 cm2, Cu area of 19.64 cm2.
b) results are reported without normalization
a) Chf Err (Chf) Rhf Err (Rhf)
µF.cm-2 µF.cm-2 ohm.cm2 ohm.cm2
Al 64 22 1176 256
Cu 8 1 16.78.103 0.43.103
Al-Cu static contact 87 5 989 26
Chf(Al) + Chf(Cu) 72 23 (1/Rhf(Al) + 1/Rhf(Cu))-1 1099 141 b) Chf Err (Chf) Rhf Err (Rhf) µF µF ohm ohm Al 13 4 5878 1280 Cu 156 6 854 22
Al-Cu static contact 1705 88 50 1
Chf(Al) + Chf(Cu) 169 7
Figure captions
Fig. 1: a) Experimental device of tribocorrosion; b) Al pin, design and insulating.
Fig. 2: Al EIS diagrams, Nyquist plot representation, raw impedance data,after immersion in
Na2SO4 (0.5 mol.L-1) buffered to pH 1.7 by H2SO4 for 3 hours.
Fig. 3: Cu EIS diagrams, Nyquist plot representation, raw impedance data, after immersion in
Na2SO4 (0.5 mol.L-1) buffered to pH 1.7 by H2SO4 for 5 hours.
Fig. 4: Al & Cu EIS diagrams, raw impedance data, after 45 hours of immersion
Fig. 5: Equivalent electrical circuit for high frequencies; Re: electrolyte resistance; CPEhf:
constant phase element, Rhf: transfer resistance.
Fig. 6: Capacitances evolution for Al and Cu electrodes, according to applied potential;
Mercurous Sulphate Electrode (MSE); Open Circuit Potential (OCP).
Fig. 7: Ecorr during friction between Al pin and Cu plate; solution: Na2SO4 0.5 mol.L-1 and
sulphuric acid, pH = 1.7.
Fig. 8: a) Capacitances (Chf) log scale, b) resistances (Rhf) log scale and c) time constants
(Chf.Rhf) linear scale during 5 steps: (1)-before contact, Al and Cu separately, (2)-static
contact between Al and Cu, (3)-dynamic contact between Al and Cu, (4)-static contact between Al and Cu after friction), (5)- after friction and separated samples of Al and Cu.
Fig. 9: a) EDX spectrum of Cu sample on the center of the worn zone, after step 5; b) EDX
spectrum of Cu sample on the outer worn zone; c) SEM image on the center of the worn zone, Cu sample; d) SEM observation.
Fig. 10: a) EDX spectrum of Cu transferred on Al electrode, after step 5; b) EDX spectrum of
Al sample on a worn zone; c) SEM image of Al sample, deposit of Cu on Al; d) SEM image of Al sample on the center of the worn zone.
Fig. 1 Fig. 1 Polished contact surface of Al Cataphoretic paint on Al
PMMA support boxed on Al pin tapping 6 mm 60 mm Upper part Lower part Teflon joint Na2SO4, 0.5 mol.L-1 H2SO4, pH = 1.7 Counter electrode Working electrode Reference electrode, SME PVC support PMMA support Aluminium pin Aluminium pin displacement Normal load Wear track Copper plate a) b)
Fig. 2 0 1000 2000 3000 4000 5000 -500 0 500 1000 1500 2000 2500 3000 10 Hz 1 Hz 0.1 Hz Al raw data -I m / o h m Re / ohm 15.85 mHz
Fig. 3 0 200 400 600 800 1000 1200 0 100 200 300 400 500 600 700 800 900 Cu raw data -I m / o h m Re / ohm 10 Hz 1 Hz 15.85 mHz 0.1 Hz
Fig. 4 0 10 20 30 40 50 60 70 80 0 10 20 30 40 50 60
Cu&Al Friction, filter Cu&Al Friction, raw data
-I m / o h m Re / ohm 10 Hz 1 Hz 0.1 Hz 15.85 mHz
Fig. 6 -1 .6 -1 .4 -1 .2 -1 .0 -0 .8 -0 .6 -0 .4 -0 .2 0 5 0 1 0 0 1 5 0 2 0 0 2 5 0 3 0 0 M in im u m C u , O C P C h f / µ F .cm -2 P o te n tia l / V v s . M S E C u A l C u , (O C P ) A l, (O C P ) A l, O C P C u
Fig. 7 0 2 4 6 8 -0.8 -0.7 -0.6 -0.5 -0.4
S tabilising potential during 24 hours in solution E nd of friction Po te n ti a l / V vs. MSE D uration / s x104 B eginning of friction
Fig. 8a & 8b a) b) 0 10 20 30 40 50 60 70 80 10 100 1000 10000 1: before friction (bf) 2: static contact, bf 3: friction
4: after friction (af) 5: Al & Cu, af 5 4 3 2 1 Al Cu
Al & Cu static contact Al & Cu friction 1 Al & Cu friction 2 Al & Cu after friction Cu after friction Al after friction C h f / µ F Time / h 0 10 20 30 40 50 60 70 80 10 100 1000 10000 1: before friction (bf) 2: static contact, bf 3: friction
4: after friction (af) 5: Al & Cu, af 5 4 3 2 1 Al Cu
Al & Cu static contact Al & Cu friction 1 Al & Cu friction 2 Al & Cu after friction Cu after friction Al after friction R h f / o h m Time / h
Fig. 8c c) 0 10 20 30 40 50 60 70 80 0.0 0.1 0.2 0.3 1: before friction (bf) 2: static contact, bf 3: friction
4: after friction (af) 5: Al & Cu, af
Al Cu
Al & Cu static contact Al & Cu friction 1 Al & Cu friction 2 Al & Cu after friction Cu after friction Al after friction R h f C h f / s Time / h 1 2 3 4 5
Fig. 9 10 µm 1000 1 µm 5000 a) c) b) d) magnification
Fig. 10 100 µm 200 1 µm 10000 c) d) a) b)