HAL Id: hal-03118933
https://hal.sorbonne-universite.fr/hal-03118933
Submitted on 22 Jan 2021
HAL is a multi-disciplinary open access
archive for the deposit and dissemination of
sci-entific research documents, whether they are
pub-lished or not. The documents may come from
teaching and research institutions in France or
abroad, or from public or private research centers.
L’archive ouverte pluridisciplinaire HAL, est
destinée au dépôt et à la diffusion de documents
scientifiques de niveau recherche, publiés ou non,
émanant des établissements d’enseignement et de
recherche français ou étrangers, des laboratoires
publics ou privés.
Hydronium Ions Stabilized in a Titanate-Layered
Structure with High Ionic Conductivity: Application to
Aqueous Proton Batteries
Seongkoo Kang, Arvinder Singh, Kyle Reeves, Jean-Claude Badot, Serge
Durand-Vidal, Christophe Legein, Monique Body, Olivier Dubrunfaut, Olaf
Borkiewicz, Benoit Tremblay, et al.
To cite this version:
Seongkoo Kang, Arvinder Singh, Kyle Reeves, Jean-Claude Badot, Serge Durand-Vidal, et al..
Hy-dronium Ions Stabilized in a Titanate-Layered Structure with High Ionic Conductivity: Application
to Aqueous Proton Batteries. Chemistry of Materials, American Chemical Society, 2020, 32 (21),
pp.9458-9469. �10.1021/acs.chemmater.0c03658�. �hal-03118933�
Hydronium Ions Stabilized in a Titanate Layered Structure with High
Ionic Conductivity: Application to Aqueous Proton Batteries
Seongkoo Kang,
a,bArvinder Singh,
b,cKyle G. Reeves,
a,bJean-Claude Badot,
b,dSerge Durand-Vidal,
a,bChristophe Legein,
eMonique Body,
eOlivier Dubrunfaut,
fOlaf J. Borkiewicz,
gBenoît Tremblay,
hChristel Laberty-Robert,
b,cand Damien Dambournet
a,b*a Sorbonne Université, CNRS, Physicochimie des Electrolytes et Nanosystèmes Interfaciaux, PHENIX, F-75005 Paris,
France
b Réseau sur le Stockage Electrochimique de l’Energie (RS2E), FR CNRS 3459, 80039 Amiens Cedex, France
c Sorbonne Université, CNRS, Collège de France, Laboratoire de Chimie de la Matière Condensée de Paris, 4 place Jussieu,
F-75005 Paris, France
d Chimie ParisTech, CNRS, Institut de Recherche de Chimie Paris, 75005 Paris, France e
Institut de Molécules de Matériaux du Mans (IMMM) – UMR 6283 CNRS, Le Mans Université, avenue Olivier Messiaen, 72805 Le Mans Cedex 9, France
f
GeePs Group of Electrical Engineering – Paris, UMR CNRS 8507, CentraleSupélec, Sorbonne Universités, Univ Paris-Sud, Université Paris-Saclay, 11 rue Joliot-Curie, 91192 Gif-sur-Yvette, France
g
X-ray Science Division, Advanced Photon Source, Argonne National Laboratory, Illinois 60439, United States
h Sorbonne Université, CNRS, UMR 8233, MONARIS, Case Courrier 49, 4 place Jussieu, F-75005 Paris, France
ABSTRACT: Proton chemistry is a fascinating field with both fundamental and applied aspects. The development of solid-state
proton conductors relying on abundant elements could help bring those two aspects. In this scope, we synthesized a disordered structure which, as revealed by the real-space refinement of the pair distribution function, has been identified to be the trititanate arrangement. The layered structure is stabilized by the presence of hydronium ions and water molecules located in the interlayer space. This compound displays a high ionic conductivity of 4·10-2 S/m with an activation energy of 0.24 eV, assigned to H+ -mobility as shown by broadband dielectric spectroscopy. Proton -mobility was further evidenced by solid-state 1H NMR. DFT-calculations revealed that proton transfer occurs both within the interlayer space and with terminal oxide of the titanate framework through a Grotthuss-based mechanism rationalizing the high conductivity measured experimentally. Finally, we investigated the electrochemical properties with respect to the proton as a charge carrier using a proton-free (KCl) and proton-donor (buffer acetic acid) electrolytes. The results showed that the structure can reversibly intercalate protons at a very high rate opening exiting per-spectives on the development of negative electrode materials for aqueous proton batteries. Overall, this study helps better under-standing the proton transfer mechanism occurring in a confined layered type structure.
INTRODUCTION
New battery technologies based on charge carriers other than lithium such as Na+, K+, Mg2+, and Ca2+, are attractive choices due to their high abundances and theoretical capacities.1–7 In this scope, protons are also unique intercalants, which have received little attention despite being abundant, lighter, and smaller than the above-mentioned metal ions.8–10 Proton based batteries could represent an exceptional solution for large-scale energy storage that needs to be cost-effective and safe. Recent studies demonstrate that some hosts could reversibly intercalate proton in aqueous electrolytes, which evokes the eagerness for developing proton based aqueous batteries.8,11,12 Among the materials explored for proton intercalation, TiO2
has attracted the most attention because it is a lightweight, abundant, nontoxic, and corrosion-resistant functional materi-al.13 It is shown that polymorphs of TiO2 can
electrochemical-ly intercalate protons with the reduction of TiIV to TiIII by an application of negative bias in acidic conditions.14–17 Recently, Kim et al. observed extremely fast (a few seconds) proton-coupled charge storage in nanostructured TiO2 in a mild acidic
aqueous condition (pH 5) opening new opportunities to the development of eco-friendly batteries.18 Furthermore, it is reported that the presence of ions/molecules as interlayer spacers (pillars between layers) in layered materials facilitates the proton intercalation. For example, Fleischmann et al.19 investigated the electrochemical proton intercalation proper-ties in layered hydrogen titanates in which, structural protons are bound to both bridging and terminal oxygen as hydroxyl groups and serve as an interlayer spacer for titanate layers. The presence of these structural protons keeps the titanate layers well-separated and significantly increases the proton intercalation (in 1 M H2SO4) capacity to 82 mAh/g than TiO2
(<15 mAh/g) thus opening interesting perspectives in develop-ing layered materials for proton-based batteries. Similarly, Wu
et al.9 demonstrated that structural water molecules in a Prus-sian blue analogue enabled it to obtain high-power characteris-tics owing to the hydrogen-bonding network that facilitates proton intercalation via Grotthuss proton conduction. Conse-quently, layered materials featuring an improved interlayer space with the presence of ions and/or structural water have been increasingly investigated to understand how the presence of these ions/molecules affects the electrochemical proper-ties.20 In particular, the layered oxide materials possessing intrinsic high proton conductivity with the presence of struc-tural protons/water (interlayer spacers) are of great interest as they could provide enhanced electrochemical properties with respect to proton intercalation.21
Moreover, layered titanate materials featuring protons and intrinsic ionic conductivity have been previously reported.22–24 Overall, the synthesis method employed in these reports relied on the protocol first reported by Kasuga et al.25 Typically, this method consists of hydrothermal treatment of titanium dioxide precursor (which can be rutile,25 anatase,26 or amorphous TiO2
27
) in a highly concentrated NaOH medium followed by an ionic-exchange Na+-H+ with the use of mild acid treatment. During the acid treatment, Na+ inside the interlayer is ex-changed with H+ and concomitantly morphological and struc-tural changes occurred leading, in most cases, to samples featuring complex x-ray diffraction patterns with broad Bragg peaks, typically encountered for disordered/nanoscaled struc-ture. Hence, it is often difficult to describe the structure of these materials as well as to characterize ionic transport/interaction occurring within the interlayer space. In this work, we embark on re-investigating the structural features of a layered titanate featuring interlayer space consist-ing of hydronium ions and water molecules. The synthesis method employed used a modified version of the protocol developed by Kasuga, with the use of a titanium molecular precursor to favor its reactivity toward NaOH. The as-synthetized compound featured a high ionic conductivity of 4·10-2 S/m, suggesting high proton mobility within the identi-fied trititanate structure. Evidence for the stabilization of hy-dronium ions and H+-hopping was provided by solid-state 1H NMR and dielectric spectroscopy. The impact of H-titanate on electrochemical insertion of protons was investigated. DFT-calculations suggested that proton mobility occurs via a Grotthuss mechanism. Owing to intrinsic high H+-mobility, the electrochemical properties with respect to the proton as charge carrier were investigated highlighting great opportuni-ties in developing high power negative electrode for aqueous rechargeable batteries.
2D materials featuring interlayer space with ions and/or struc-tural water have been increasingly investigated to understand how confinement affects the electrochemical properties, par-ticularly in transition metal oxides.28,29 Moreover, materials with intrinsic high proton conductivity could provide en-hanced electrochemical properties with respect to proton inter-calation.21 Hence, a structure featuring an interlayer composed of hydronium/water molecules could provide enhanced elec-trochemical properties. Finally, such a system could help to better understand the effect of nanoconfinement on the proton chemistry, particularly on the transfer mechanism.28,30–34
EXPERIMENTAL SECTION
Synthesis. A solution of 26 mL of 10 M NaOH was added to
4 mL of Titanium (IV) isopropoxide (> 97%, Sigma-Aldrich) under stirring and sealed in a 45 mL Teflon-lined autoclave. The mixture was heated at 90 °C for 12 h. Synthesized Na-titanate was separated by centrifugation and washed with water. The obtained powder was treated with 1 M HCl under stirring for 20 min. The sample was washed with water and recovered by centrifugation and then dried at 80 °C overnight. For comparison purposes, we synthesized H-titanate using a solid precursor, which is anatase TiO2 powder. In a solution of
26 mL of 10 M NaOH, we added 1.07 g of TiO2 anatase
pow-der unpow-der stirring. The mixture was heated at 150 °C for 12 h. Similar aforementioned protocols were then used.
X-ray diffraction. Powder x-ray diffraction measurements
were done with Rigaku diffractometer in Bragg-Brentano geometry equipped with Cu Kα radiation.
Pair distribution function. High-energy synchrotron x-ray
diffraction (λ = 0.2128 Å) data were collected at the 11-ID-B beamline at the Advanced Photon Source at Argonne National Laboratory. The raw 2D total scattering data were integrated into one-dimensional diffraction data using FIT2D.35 Fourier transformation and correction of PDFs were done with PDFgetX3.36 PDF refinements were performed using PDFgui software.37 The quality of the refinement is quantified by the reliability factor weighted R-value, denoted as Rw. The
R-value describes the difference between the experimental ob-servation (data) and the calculated value (fit) for a single data point. The Rw is the R-value weighted for data point i, and is
given by the formula:
R
N
N 2
( )
with and being the observed (data) and calculated
(fit) PDF and w(ri) the weight for each data point.
Transmission electron microscopy. The analysis was
per-formed with JEOL 201 UHR microscope operating at 200 kV equipped with a TCD camera. Scanning electron microscopy was performed with Hitachi Su-70 at 5 kV.
Thermal analysis. Thermogravimetric analysis data were
collected with TA instruments TGA550 analyzer. The analysis was performed between 25 °C and 600 °C at a heating ramp of 1 °C/min under N2 atmosphere.
FT-IR. Infrared spectra of the samples were recorded using an
ATR diamond crystal accessory on a Bruker Equinox 55 spec-trometer equipped with a Ge/KBr beamsplitter and a liquid nitrogen-cooled MCT detector under ambient conditions and with a spectral resolution of 4 cm-1.
Conductometric titration. Into a dispersion of 0.1 g of
H-titanate in 16 mL of ultrapure water, we added step-by-step 0.1 mL of 1 M NaOH. The evolution of the resistivity was meas-ured using QuadTech 7600 Plus Precision LCR meter and Fisherbrand Accumet four-cell conductivity/ATC probes (Cell constant = 10 cm-1). The measurements were performed at 1 kHz which was determined by finding the frequency where the imaginary part of the impedance is neglected with an imped-ance measurement swept between 1·102
Hz and 2·106
Hz.
1
H MAS NMR. 1H solid-state magic angle spinning (MAS) NMR experiments were performed on a Bruker Avance 300
spectrometer operating at 7.0 T (1H Larmor frequency of 300.2 MHz), using a 1.3 mm CP-MAS probe head. The room tem-perature 1H MAS spectra were recorded using a Hahn echo sequence with an interpulse delay equal to one rotor period. The 90° pulse length was set to 2.4 μs, 160 transients were accumulated with recycle delays of 20 s. 1H spectra are refer-enced to TMS and were fitted using the DMFit software.38
Broadband Dielectric Spectroscopy. The complex
conduc-tivity and permitconduc-tivity of the samples were measured between 50 and 1010 Hz using Agilent E8364B PNA Network Analyzer (107 to 1010 Hz) and Agilent E4990A Impedance Analyzer (50 to 108 Hz). The sample was prepared by pressing powder into the pellets at 0.7 GPa (diameter = 3 mm, thickness = 1 mm) and metalized with silver paint. The pellet was placed between the inner conductor and a short-circuit of a coaxial APC7 cell.
DFT-calculations. Supercells starting from the structure
de-termined by PDF refinement were used, to which hydronium ions were added to what were deemed as the most likely posi-tions. To simplify the calculations, water molecules—expected to be present within the structure—were omitted. The resulting supercell Ti12O28(H3O)8 was simulated using a triclinic unit
cell defined by a = 15.77732 Å, b = 3.85755 Å, c = 9.39849 Å, = 90.00000 , = 101.5000 , and =90.00000 . Fixing the positions of the titanium atoms as well as the unit cell, a ge-ometry optimization calculation was computed using the CP2K code.39 DZVP-MOLOPT-SR-GTH40 basis sets were used to construct the Kohn-Sham wave functions with a plane wave cutoff of 400 Rydberg. Goedecker-Teter-Hutter pseudopotentials41 were used, where Ti atoms were represent-ed explicitly using 3s23p63d24s2 electronic orbitals, and O atoms were represented using 2s22p4 electronic orbitals. The generalized-gradient approximation PBE was used as the exchange-correlation functional42. Simulations were charge neutral. The calculation was performed with periodic bounda-ry conditions using Γ-point sampling.
Electrochemistry. Electrochemical experiments were
con-ducted in a closed 3-electrode cell with biologic potentiostat and EC-lab interface in an ambient condition. The electrode was prepared by mixing 80 wt.% of synthesized material with 20 wt.% of conductive carbon black (TIMCAL Graphite & Carbon Super P). The mixture was first dispersed in 1 mL of tetrahydrofuran (Anhydrous, > 99.9 %, inhibitor-free, Sigma-Aldrich) and sonicated for 15 min. Subsequently, 65 L of Nafion 117 solution (5 % in a mixture of lower aliphatic alco-hols and water, Fluka) and sonicated for 15 min. A volume corresponding to 40 L of the slurry was deposited on titani-um foil (> 95 %, Alfa Aesar) of 0.25 cm2 surface. The mass loading was around 2.4 mg/cm2. The electrochemical proper-ties were characterized in a three-electrode cell with Ag/AgCl and Pt electrodes employed as reference and counter electrode, respectively. The electrochemical measurements were per-formed in 1 M KCl and 1 M acetic acid buffer solution (pH 5) as the electrolytes. The electrolyte solution in the cell was thoroughly deaerated by argon (for at least 30 minutes) before each experiment to avoid faradaic contribution arising from the reduction of the dissolved O2 and a constant flux of argon
was maintained above the solution during all electrochemical measurements.43 The reproducibility of the electrochemical results was checked by repeating measurements at least five times using different cells.
RESULTS AND DISCUSSION
To synthesize a layered structure containing a large content of protons, we revisited the method proposed by Kasuga et al,25,44 which consists of treating particles of TiO2 in a highly basic
solution under hydrothermal conditions followed by a sodium-proton exchange reaction. To increase the reactivity of the Ti precursor, we replaced the solid by a molecular precursor, namely titanium isopropoxide (see Experimental Section). The obtained Na-titanate was then treated with an acidic solution (HCl, 1 M) to exchange sodium by protons (H-titanate). The typical x-ray diffraction pattern (XRD) of H-titanate shown in
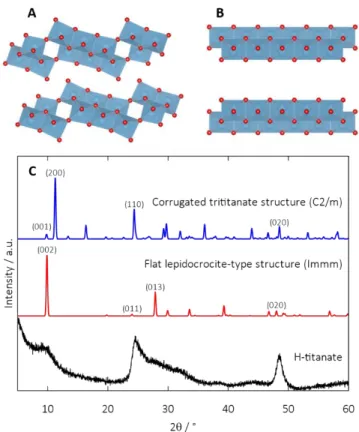
Figure 1, features broad and poorly defined Bragg peaks indi-cating nano-sized particles and/or disordered structure. This type of diffraction pattern is commonly reported for a similar type of material employing an ion-exchange reaction.45,46 The diffraction line at around 9.77° (2) is characteristic of a lay-ered type structure. In an attempt to index the diffraction pat-tern, we compared it with known layered titanate compounds as found in the ICSD database47,48. The models used are lay-ered structures where the slabs are comprised of either corru-gated layers (C2/m)48 or flat layers (Immm)47 also known as trititanate and lepidocrocite-type titanate, respectively (Figure 1A and B). At first glance, the pattern seems closer to the corrugated structure, particularly with the indexation of (110) and (020) lines.
Figure 1. Structural representation of A) corrugated titanate (trititanate) and B) flat titanate (lepidocrocite) and C) x-ray dif-fraction pattern of as-synthesized H-titanate and simulated XRDs of the different reference layered titanate structures
Electron microscopy was used to detail morphological features. H-titanate is composed of aggregates of about 0.5 μm of diam-eter (Figure S1). Aggregates are composed of fiber-type parti-cles with a thickness of about 3-5 nm (Figure 2).As the fibers are strongly aggregated, it is difficult to determine their length.
By zooming in on the TEM image, we can observe stacks of three to five layers constituting the fibers. The interlayer spac-ing measured from the image is around 9 Å. This d-spacspac-ing can be assigned to the (200) line of the corrugated structure and the corresponding Bragg peak at 9.77° (2). Hence, we assigned the broadness of the peak to a size effect with few numbers of layers composing the 1D morphology.
Figure 2. Transmission electron microscopy images of H-titanate showing 1D morphology constituted with a stack of layers (bot-tom: zoom-in of the red square).
To identify the structural features of H-titanate, we used high-energy x-ray scattering. The collected data were Fourier trans-formed to atomic pair distribution functions (PDF) providing a histogram of atomic pair correlation where each peak corre-sponds to the distance of the atomic pair. PDF is a powerful tool to study local to average range ordering of disordered and/or nanosized materials.49,50
Atomic correlations of H-titanate could be divided into short-range order < 15 Å related to intra and interlayer contributions and long-range order > 15 Å showing a periodicity that may be related to 1D morphology (Figure S2). We attempted to refine the PDF of H-titanate using different structural models (Figure 3) including the lepidocrocite and several corrugated structures. Overall, a better agreement between the calculated and experimental data was found for the trititanate structure (see reliability factor Rw values). Particularly, the trititanate
model better fit the local structure with distances related to Ti– O (1.921 Å) in TiO6 octahedra, Ti–Ti between edge-sharing
(3.122 Å) and corner-sharing (3.709 Å) octahedra. In the trititanate, the structure displays a corrugated structure where slabs of three edge-sharing TiO6 octahedra are interconnected
through corner-sharing (Figure 1A). It is the reason why the
corrugated structure is also called trititanate. Meanwhile, the lepidocrocite-type structure has flat slabs constituted of edge-sharing octahedra. Consequently, trititanate contains more corner-sharing Ti-Ti than the lepidocrocite-type titanate.51 As a result, the intensity of the corner-sharing peak is higher than the edge-sharing peak, which better fit the experimental data. The refined unit cell parameters are a = 15.8673 (0.13) Å, b = 3.774 (0.024) Å and c = 9.42972 (0.1) Å ( = 90°, = 101.5°,
= 90°). Comparing with the model structure (ICSD Coll. Code 5455), the structure shrank along the a-axis and elongat-ed along the c-axis (a = 15.99 Å, b = 3.738 Å and c = 9.172 Å). We further attempted to locate oxygen atoms within the inter-layer space, which did not produce any significant improve-ment of the fit suggesting that the interlayer is probably highly disordered.
Figure 3. PDF refinements of H-titanate using the lepidocrocite and trititanate structural models.
Determination of the chemical formula
The crystal cell contains three titanium and seven oxygen so that there are two negative charges that should be compen-sated by the presence of protons, i.e., hydronium ions. The theoretical formula is (H3O)2Ti3O7·nH2O where n is assigned
to structural water molecules. The later was postulated from the thermogravimetric analysis. To assess the chemical com-position, we employed different techniques including conductimetric titration to determine the content of protons. The conductimetric titration (Figure S3) showed a deficiency of protons as compared to the theoretical chemical formula. Hence, we hypothesized that such deficiency of H3O
+
is com-pensated by the presence of oxygen vacancies, which can be expressed by the following general formula (H3O)2-xTi3O
7-x/2x/2·n(H2O), where represents a vacancy.
Thermogravimetric analysis (TGA) was performed from 25 to 600 °C at a heating ramp of 1 °C/min under N2 (Figure 4A).
The total weight loss is 22 %, which evidences the hydrat-ed/protonated state of the layered structure. We observed an overlapping two-steps dehydration process within the 25-100 °C and 25-100-450°C regions accounting for 13 and 9 wt.%, respectively. The thermal behavior of H-titanate is very simi-lar to the one observed by Sasaki et al.,47 on lepidocrocite HxTi2-x/4x/4O4·H2O. Accordingly, we assigned the first step to
the departure of physisorbed and structural water, followed by the departure of hydronium ions.
Based on titration and thermal analysis, we propose the fol-lowing chemical formula (H3O)1.35Ti3O6.670.33∙1.73H2O (M =
307.21 g/mol). We note that the amount of structural water (1.73H2O) includes a proportion of physisorbed water
mole-cules which, are difficult to accurately quantify.
The thermal stability of the structure was investigated using ex-situ x-ray diffraction analysis on heat-treated samples ( Fig-ure S4). It showed that at T =100°C, the (200) line slightly shifts to a higher 2 value suggesting a contraction of the layered structure in agreement with the release of structural water molecules. At 150°C, we observed diffuse peaks located at around 10-15° (2θ), which suggest the formation of TiO2-(B)
as well as peaks related to anatase TiO2. At higher
tempera-tures, the structure progressively transformed to anatase. For-mation of TiO2-(B) upon calcination of trititanate due to the
structural rearrangement related to the amount of water in the interlayer was reported in many studies.52–56 Wang et al.57 reported also the direct crystallization of anatase upon calcina-tion of the trititanate. This points out that the chemical formula, hence the structural arrangement, impacts the thermal behavior of the structure.
The hydrated state of the sample was confirmed by FT-IR spectroscopy (Figure 4B). The latter characterizes O-H vibra-tion modes. The spectrum measured at room temperature in ambient conditions shows a large band between 2800 and 3500 cm-1 and a sharp peak at 1629 cm-1 assigned to the stretching and deformation of O-H vibration modes, re-spectively. The band at 1629 cm-1 can be attributed to both structural water and/or hydronium ions and therefore cannot be used to discriminate both species.47 The large band located between 2800 and 3500 cm-1 is characteristic of hydrogen bonds.
Figure 4. (A) Thermogravimetric (blue) and derivative (green) curves recorded under N2, at 1°C/min. (B) ATR FT-IR spectrum
of H-titanate.
Characterization of interlayer hydronium ions and water molecules
The local environment of hydrogen atoms was further investi-gated using 1H solid-state MAS NMR (Figure 5). The spec-trum consists essentially of a broad contribution (full width at half maximum (FWMH) equal to 760 Hz), slightly asymmet-ric (two lines are needed to reconstruct it properly) with a maximum at ~ 6.4 ppm. Such width may be due to a distribu-tion of proton environments in the material and thus to the distribution of chemical shifts and/or to the strong homo nu-clear 1H-1H dipolar coupling which is not averaged to zero despite the high spinning frequency (the FWMH decreases from ~ 1100 Hz to 760 Hz as the spinning frequency increases from 44 kHz to 60 kHz). In addition to the main line at 6.3 ppm, a value similar to that of the resonance assigned to inter-layer water molecules in inter-layered titanate,58 the reconstruction of the main contribution highlights a second NMR resonance at 8.1 ppm. This value is close to 9 ppm, reported for hydrated hydronium ions in a zeolite.59 The relative intensities of these two resonances are difficult to distinguish, and thus, do not respect the proportions of protons in H2O and H3O
+
. We there-fore assume that resonances of H3O
+
ions and H2O molecules,
broadened by disorder and residual dipole coupling, merge due to the rapid exchange of protons between these species. Finally, there are two, low-intensity resonances, at 0.85 and 1.26 ppm, that can be assigned to a small amount of terminal OH groups, Ti–OH.58,60
Figure 5. Experimental (blue) and fitted (red dashed line) 1H MAS (60 kHz) NMR spectrum of H-titanate. The individual resonances used for the fit are shown below (see Table 1). Table 1. Isotropic chemical shifts (δiso, ppm), line widths (LW,
ppm), relative intensities (I, %), of the NMR resonances used for the fit of the 1H MAS (60 kHz) NMR spectrum of H-titanate.
δiso (ppm) LW (ppm) I (%) 0.85 0.13 0.4 1.26 0.31 1.3 6.30 2.30 84.9 1H frequency / ppm -6 -4 -2 0 2 4 6 8 10 12 14 16 18
8.10 5.70 13.4
Broadband dielectric spectroscopy (BDS) enables to probe different relaxation phenomena in inorganic materials ranging from grain boundary polarization to molecular motions, by accessing the time-dependent charge-density fluctuation repre-sented by pulsation ω (ω = 2πν, ν being the frequency ex-pressed in Hz) dependent complex conductivity σ(ω), resistivi-ty ρ(ω) and permittiviresistivi-ty ε(ω):
where ε0 is the vacuum permittivity. The relaxation time of the fluctuation depends on the relaxation mechanism of different phenomena such as reorientation of dipolar species, local charge hopping, and interfacial charge fluctuation.61
The complex resistivity of H-titanate was measured under ambient conditions (without controlling the relative humidity) and is represented with a Nyquist plot of the imaginary part
ρ’’(ω) vs. the real part ρ’(ω) (Figure 6). Bulk conductivity σg
was assessed by fitting the complex resistivity leading to 4·10
-2
S/m, suggesting high proton mobility within the trititanate structure. Such a value is about two orders of magnitude high-er than reported values (Table S1).22–24,62
Figure 6. Plot of the imaginary part ρ’’(ω) vs. the real part ρ’(ω) of the complex resistivity of H-titanate measured at 295 K under ambient conditions.
For the sake of comparison, we synthesized H-titanate using a solid precursor with synthesis conditions typically employed in the literature (see Experimental Section). The as-synthesized product (Figure S5) presented a RT bulk ionic conductivity of 3·10-3 S/m, which is lower than the value obtained using molecular precursor. Hence, the use of titanium alkoxide as a precursor is decisive in achieving high proton conductivity.
To probe molecular motions occurring within the layered structure, we analyzed the frequency-dependent complex permittivity represented with the Nyquist plot. As the relaxa-tions are additive due to vectoral character, they can be evi-denced by decomposing the Nyquist permittivity plot and contributions thereafter were denoted as “P” for part. Dielec-tric relaxations were fitted with the Cole-Cole function63 rep-resented by a circular arc centered below the baseline:
where εl and are respectively lower and higher frequency limits of the permittivity. The relaxation time τ is related to the characteristic timescale of dipolar motions. The exponent
parameter α (0 ≤ α ≤ ) measures the degree of departure from the Debye model, i.e., without any interactions.
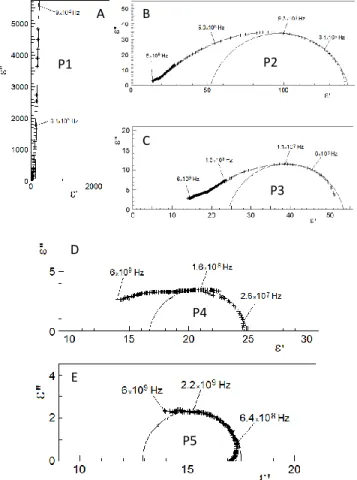
The imaginary part ε’’(ω) vs. the real part ε’(ω) of the entire complex permittivity of H-titanate recorded at room tempera-ture is plotted in Figure 7A. The quasi-vertical straight line fitted below 3·105 Hz represents the first relaxation P1. The real part of the permittivity is superior to 105 at 50 Hz due to the capacitive effect at the sample/silver interface (Figure S6). This interface is partially blocking and ohmic contact, includ-ing the resistive part due to limited charge flow and the ca-pacitive part due to interface polarization. P1 corresponds to the high-frequency part of quasi-Debye relaxation which is described in the function above.64,65 The contribution of direct-current conductivity is also present.
As P1 shows a strong amplitude, the entire complex permittiv-ity needed to be decomposed to separate and identify the dif-ferent relaxations. Upon subtraction of P1, a second relaxation P2 (Figure 7B)is well fitted with the Cole-Cole function with a relaxation frequency ν2 = 9.3·10
5
Hz. Using the same proce-dure, by subtracting subsequently lower frequency contribu-tions, P3 (Figure 7C), P4 (Figure 7D), and P5 (Figure 7E) are also well fitted using the Cole-Cole function, respectively at ν3
= 1.1·107 Hz, ν4 =1.6·10 8
Hz and ν5 =2.2·10 9
Hz.
Each frequency or relaxation is associated with a particular microscopic mechanism spanning grain polarization (low frequency) to ion jump (intermediate frequency) to free water rotation (high frequency).66
Figure 7. Plots of the imaginary part ε’’(ω) vs. the real part ε’(ω) of the complex permittivity of H-titanate measured at 295 K: (A) Entire plot, (B) Plot obtained after subtraction of P1, (C) then
A B C D E P1 P2 P3 P4 P5
after subtraction of P2, (D) then after subtraction of P3 and E) finally after subtraction of P4.
Concerning P2 and P3, the observed frequencies are typical of grain polarization. The occurrence of two frequencies can be explained by morphological features. Indeed, previous work on molybdenum oxide showed that the frequencies of relaxa-tion of aggregate and nanobelts presented distinct values with 7·105 Hz for the aggregate and 2·107 Hz for the nanobelt.64 Overall, the polarization of grains is affected by the scale of the ionic density inhomogeneity. We previously observed that the solid was built from aggregates composed of fibers. As the conductivity of aggregates is lower than that of fibers, the dielectric relaxation of aggregates arises at a lower frequen-cy.67 Therefore, P2 and P3 are reasonably attributed to the relaxations of aggregate and fibers, respectively.
The frequencies associated with P4 and P5 are typical of ionic jump associated with proton mobility and interlayer water dipole reorientation, respectively. Indeed, the previous inves-tigation reported relaxation frequencies of 18·109 Hz for free water, 4·109 Hz for interlayer water in V2O5 xerogel, and
1.3·103 Hz for ice (T = 250 K).68,69 The relaxation frequency P5 (ν5 = 2.2·10
9
Hz) is much lower than that of free water or interlayer water confined in V2O5 but higher than ice. Lower
relaxation frequency of P5 can be explained by steric hin-drance induced by the trititanate structure and also due to strong H-bonding as shown by 1H NMR and FT-IR spectros-copy. Badot et al,70 showed that the relaxation frequency of interlayer water in the presence of H3O
+
is slowed down to the order of 109 Hz. Hence, we assigned P5 to the interlayer water dipole reorientation.
Figure 8. Arrhenius plot of relaxation frequencies of P4 associat-ed with proton ionic motion. The activation energy dassociat-educassociat-ed from the plot is 0.24 eV.
By attributing subsequently P3 and P5 relaxations, P4 is at-tributed to ionic motions of protons/hydroniums stabilized in the trititanate structure and giving rise to the measured high ionic conductivity. To further characterize proton mobility in
the structure, we plotted an Arrhenius-based law representing the evolution of the relaxation frequencies as a function of the inverse of temperature (295 K – 253 K) (Figure 8). The linear relationship indicates that proton mobility is a thermally acti-vated process with an activation energy of 0.24 eV. Remarka-bly, this value is similar to the one obtained with the bulk conductivity (Table S2, Figure S7) showing that ionic mobility within the trititanate structure is dominated by protons. The mechanism by which ionic mobility occurs within the trititanate structure involved water and hydronium ions located within the interlayer space. The occurrence of H-bonding suggested that proton mobility involved a Grotthuss-based mechanism through H+-hops71 rather than a vehicle mecha-nism of H3O
+
as found in H3OUO2AsO4·3H2O (HUAs). 72
Structural modeling and proton-hopping mechanism
To better understand the atomic structure and ionic transport within the H-trititanate, we used density functional theory (DFT) calculations. We first built a supercell starting from the structure determined by PDF refinement, in which we added the likely positions of hydronium ions. To simplify the calcu-lations, water molecules—expected to be present within the structure—were omitted. The resulting supercell Ti12O28(H3O)8 was simulated using a triclinic unit cell defined
by a = 15.777 Å, b = 3.858 Å, c = 9.398 Å, α = 90.000 , β =101.500 , and γ = 90.000 (Figure 9, left). At the surface of each titanate layer, oxygen is found in one of two coordination environments: one-fold (Figure 9, green) or two-fold coordi-nated (Figure 9, purple). Hydronium ions were initially placed roughly halfway between the two titanate layers and in align-ment with each surface oxygen atom without particular atten-tion to the initial orientaatten-tion.
The relaxed structure of the titanate shows a strong ordering of the hydronium ions. In each of the two local environments, a reorientation of H3O
+
is observed forming a line of molecules bridging the two adjacent titanate layers via hydrogen bonding with either the one-fold or two-fold coordinated oxygen at-oms. The hydronium ion coordinated to the one-fold oxygen (Figure 9, green inset) is composed of two longer bonds ori-ented towards the oxygen atom (~1.10–1.16 Å), and one which is oriented away with a slightly shorter bond (0.97–1.06 Å) interacting with the opposing titanate layer. Protons on the hydronium ion sit roughly 1.5 Å from the titanate layer. The hydronium ions that interact with the two-fold coordinated oxygens, however, show a less consistent set of bond lengths and vary based on each ion’s local environment. Bond lengths of these ions are generally a shorter bond around 0.99 Å and two longer bonds around 1.06 Å. Protons fall roughly 1.25 Å
Figure 9. The relaxed Ti12O28(H3O)8 supercell computed using density functional theory. The hydronium ions fall either next to a one-fold
coordinated oxygen atom (green) or two-fold coordinated oxygen atoms (purple). Insets to the right show an alternative perspective illus-trating the lines of hydronium atoms that are parallel to the surface of the titanate layers and the hydrogen bonds that are on either side of the hydronium ions.
The relaxed structure provides some insight into the likely mechanism for proton diffusion in the structure. Given the arrangement of the hydronium ions in the interlayer plane, proton diffusion likely occurs in this two-dimensional plane. To consider the possible role that the equilibrium position of the hydronium ions plays in proton mobility in the titanate structure, we define a path between the oxygen of a hydroni-um ion and the one-fold coordinated oxygen (highlighted in green in Figure 9) with a distance of 2.55 Å. The path is divid-ed into seventeen steps for which the total energy of the sys-tem is recomputed as the proton advances between the two oxygens. Figure 10 shows the total energy profile for the pro-ton transfer from hydronium to titanate in purple where the minimum energy of the path is shifted to zero. The total ener-gy of the system varies very little as the proton moves between the two oxygens. As a result, protons are similarly likely to be found at either site.
Given the ease of which the proton moves between the hydro-nium and titanate oxygen, we investigate a proton transfer between a hydronium ion and an adjacent water molecule resulting from the protonation of titanate oxygen as described in the previous step. The distance between hydronium ion and the water oxygen is 2.61 Å, which for the relaxed structure is the most similar distance as compared to the distance between the hydronium and the surface oxygens of the titanate layer. The hydroxyl group on the titanate oxygen has a bond length of 1.01 Å. The total energy profile in Figure 10 which charac-terizes the differences in the energy of the system as the sur-face of the titanate is protonated shows an essentially barrierless transition. Thus, proton transfer between hydroni-um ions is also possible as the surface oxygens likely also play a role in facilitating the movement of protons throughout the material and ultimately enhancing proton conductivity as proton acceptors. Moreover, water molecules absent from the model used in the DFT calculations yet present in the synthe-sized materials may also appear at a similar distance and thus play a similar role.
Figure 10. The total energy profile for the proton transfer be-tween a hydronium ion and a one-fold coordinated oxygen in the titanate layer (purple) and between two hydronium ions (green). Each curve is shifted such that the minimum energy along the path is 0 meV. The paths for each proton transfer event are shown on the right.
Electrochemistry
It is well accepted that upon applying a negative bias to a TiO2
electrode in a strong acidic media (pH < 2; free protons i.e., H3O
+
) or in acetic acid (AH; A- ≡ CH3COO
-) solution (weak acid), protons can intercalate within the TiO2 lattice according
to following reactions:18,73 TiIVO2 (surface) + xH
+
(H3O +
or AH) + xe- ↔ TiIIIOOH (sur-face) + H2O (or A
-)
TiIIIOOH (surface) + TiIVO2 (bulk) ↔ Ti IV
O2 (surface) +
TiIIIOOH (bulk)
The former equation represents the charge transfer at the elec-trode/electrolyte interface and the later represents the propaga-tion of TiIII sites throughout the oxide lattice via H+
hop-ping.18,72 Therefore, proton conductivity in the TiO2 lattice is
crucial to achieving good capacity (i.e., to intercalate a high mole fraction of protons in TiO2 lattice), especially at high
currents. The intrinsic H+-mobility within the H-titanate com-pound thus motivated us to probe its electrochemical proper-ties with respect to the proton as a charge carrier.
Figure 11. A) CVs for H-titanate recorded at 10 mV/s in 1 M KCl and 1 M acetate buffer, B) CVs at different scan rates for H-titanate in 1 M acetate buffer. The inset to Figure 11b shows logarithmic of peak currents vs. logarithmic of square root of scan rates, C) Galvanostatic charge-discharge curves for H-titanate in 1 M acetate buffer under 4.2 A/g, D) cycling of H-titanate in 1 M acetate buffer under 4.2, 3.36
and 2.52 A/g.
An Ag/AgCl (saturated KCl; +0.2 V vs. NHE at 25°C) and a Pt wire were used as the reference and counter electrode, respectively. We used 1 M KCl (pH ≤ 7) and 1 M acetate (CH3COOH/CH3COOK) buffer solution (pH = 5) as
electro-lytes. The former contains a very low concentration of protons (Note: H2O donates protons under extreme basic conditions;
pKa (H2O) ≥ 14) whereas acetic acid is a monoprotic organic
acid having a pKa of 4.76 and capable of donating/accepting
protons at pH = 5 as reported previously.43 The selection of these two electrolytes thus allows us to distinguish the faradaic and capacitive behavior of the electrode material. To minimize the contribution from hydrogen evolution reaction at the elec-trode, the cut-off voltage was fixed at -1.1 V. Figure 11A
shows cyclic voltammetry (CV) curves for H-titanate collected at 10 mV/s in 1 M KCl and 1 M acetate buffer. The H-titanate electrode exhibits a negligible current between 0 to -0.66V (approx.) in both electrolytes. This is because the electronic properties of the amorphous TiO2 are characterized by a
pH-dependent conduction band potential of ECB = -0.36 – 0.06 ×
pH (V vs. Ag/AgCl).18,43 Therefore, similar to TiO2, H-titanate
exhibits poor electronic conductivity (insulator) as long as the applied potential E >> ECB (ECB is expected between 0.66 to
-0.78V for the present case at pH between 5-7). A transition from an insulating to a conducting state occurs at E ~ ECB,
which is associated with the progressive filling of the electron-ic states within the bandgap and increase of the Fermi level through negative potential scan until E < ECB. We observed the
insulator to metal transition at a potential below -0.6V (vs. Ag/AgCl) in both electrolytes. Therefore, in 1 M KCl, the H-titanate electrode possesses a nearly rectangular shaped current response (doublelayer capacitance) at a potential below -0.6V. The negative charge accumulated at E < -0.6V is com-pensated by the electrosorption of cations in 1 M KCl. How-ever, in 1 M acetate buffer, the shape and magnitude of the CV current are strongly modified and a very broad and reversible wave appeared on top of the capacitive current (band-filling). This wave can be reasonably ascribed to the reversible farada-ic reduction of TiIV sites due to the intercalation of protons into H-titanate lattice in 1 M acetate buffer, quite similar to what was previously reported for amorphous TiO2.
18,43 Figure 11B shows CVs for H-titanate collected at different scan rates in 1 M acetate buffer and a plot in the inset shows logarithmic of oxidation peak currents vs. logarithmic of scan rates. As cathodic peaks are broad and not well-defined, we have
plot-ted the oxidation peak (centered at ~0.75V) currents log(Ipa) vs
log(ν). The observed linear relation between log(Ipa) and log(ν)
with the exponent b = 0.99 (Ipa = av b
) indicates the occurrence of a faradaic process, which is not rate-limited by diffusion-based mechanism;9,74 in contrary to conventional farada-ic/intercalation reactions.75 The fast proton intercalation is due to the presence of structural H2O/H3O
+
for H-titanate; similar to what is reported for Prussian blue analogues thus highlights the beneficial use of intrinsic proton conductivity.9
The CV results thus suggest that when E < ECB, H-titanate
gives capacitance due to electrosorption mainly (14.13 mAh/g at 10 mV/s) when there is a very low concentration of availa-ble protons (KCl) whereas it delivers faradaic capacity (40.47 mAh/g at 10 mV/s) when the concentration of available pro-tons is reasonably high (acetic acid). Based on the chemical formula, the calculated theoretical capacity relying on H+ -intercalation and the involvement of the TiIV/TiIII redox couple is 261 mAh/g, which translated to 0.46 H+ inserted per formu-la unit for the faradaic capacity. Figure 11C shows the galvanostatic charge-discharge (GCD) curves obtained at a high current density of 4.2 A/g. The observed GCD curves in
Figure 11C exhibit a broad potential range for H+ intercala-tion/de-intercalation rather than well-defined plateaus; very similar to what we observed in CVs. The galvanostatic meas-urements provide a gravimetric capacity of around 33 mAh/g (0.38 H+ per formula unit) with Coulombic efficiency (C.E.) ≥ 99% over 50 cycles. The recorded time to obtain these capaci-ties is typically in the order of 25-30 s, emphasizing fast redox reactions. Such a high kinetic might be due to high intrinsic proton mobility of the pristine material.
The C.E. during galvanostatic cycling is found to decrease at lower current density rates (Figure 11D). For instance, under 2.52 A/g, the observed initial C.E. is ~97% (with a discharge capacity of 41 mAh/g), which is decreased to 87% over 50 cycles. This decrease in C.E. at current density is possibly linked to the competitive H2 evolution reaction occurring at
the electrode. The contribution from the H2 evolution reaction
seems to become significant at lower current density as the electrode is bound to spend relatively more time at negative potentials. Therefore, the proposed H-titanate material could be used as a negative electrode material for developing high rate proton-based batteries in mild aqueous electrolytes. How-ever, we believe that with the use of surface protecting layers, this material would be able to deliver high reversible capacity even at low current density. Further works should be per-formed to confirm this.
CONCLUSION
We synthesized layered titanate by revisiting the Kasuga method using molecular Ti(IV) instead of solid precursors. The obtained enhanced reactivity of the titanium precursor enabled to obtain Na-titanate at low temperature under hydro-thermal condition followed by Na+-H+ ionic exchange reac-tion. The obtained H-titanate featured an x-ray diffraction powder pattern consisting of broad Bragg peaks indicating nanosized/disordered structure. Microscopy analysis showed that the morphology of the solid consists of a 2-3 nm thin elongated particles. Real-space refinement of the pair distribu-tion funcdistribu-tion identified the tetragonal trititanate structure. The determination of the phase composition yielded (H3O)1.35Ti3O6.670.33∙1.73H2O pointing to a large presence of
hydronium ions and water molecules located within the inter-layer space. Solid-state 1H NMR emphasized that the
reso-nances of H3O +
ions and H2O molecules displayed close
iso-tropic chemical shift values with broad features due to the rapid exchange of protons between these species. Broadband dielectric spectroscopy confirmed the occurrence of high proton mobility with a conductivity of 4·10-2 S/m which is the highest value reported for this type of material. A low activa-tion energy of 0.24 eV indicated that proton species can dif-fuse easily throughout the network. DFT-calculations rational-ized the observed high proton conductivity with a model sys-tem suggesting barrierless proton transfer occurring from hydronium ions toward the titanate framework and within the interlayer space, consistent with a Grotthuss-based mecha-nism. The electrochemical properties with respect to the pro-ton as a charge carrier were investigated using a propro-ton-free (KCl) and proton-donor (buffer acetic acid) electrolytes. Cy-clic voltammetry indicated the occurrence of a faradaic pro-cess rate-limited controlled by surface adsorption of H-titanate. Galvanostatic experiments showed that the structure can reversibly insert proton under high rate (25-30 s per dis-charge/charge) opening perspectives for the development of a high-power negative electrode for aqueous proton batteries.
ASSOCIATED CONTENT
Supporting Information
Additional data: SEM, PDF, conductometric titration, XRDs and broadband dielectric spectroscopy can be found in Supporting Information, available free of charge on the ACS Publications website.
AUTHOR INFORMATION
Corresponding Author
*damien.dambournet@sorbonne-universite.fr
Funding Sources
A.S and C.L.R acknowledge the French agency of research (ANR) for funding through contract ANR-18-CE05-0014-02.
ACKNOWLEDGMENT
The work done at the Advanced Photon Source, an Office of Science User Facility operated for the U.S. Department of Energy (DOE) Office of Science by Argonne National Laboratory, was supported by the U.S. DOE under contract no. DE-AC02-06CH11357. We thank IMPC FR2482 for SEM-FEG and TEM instrumentation funded by CNRS, Sorbonne Université and C’Nano projects of Région Ile-de-France.
REFERENCES
(1) Ong, S. P.; Chevrier, V. L.; Hautier, G.; Jain, A.; Moore, C.; Kim, S.; Ma, X.; Ceder, G. Voltage, Stability and Diffusion Barri-er DiffBarri-erences between Sodium-Ion and Lithium-Ion IntBarri-ercalation Materials. Energy Environ. Sci. 2011, 4 (9), 3680. https://doi.org/10.1039/c1ee01782a.
(2) Yabuuchi, N.; Kubota, K.; Dahbi, M.; Komaba, S. Re-search Development on Sodium-Ion Batteries. Chem. Rev. 2014, 114 (23), 11636–11682. https://doi.org/10.1021/cr500192f.
(3) Komaba, S.; Hasegawa, T.; Dahbi, M.; Kubota, K. Potassi-um Intercalation into Graphite to Realize High-Voltage/High-Power Potassium-Ion Batteries and Potassium-Ion Capacitors. Electrochem.
Commun. 2015, 60, 172–175.
https://doi.org/10.1016/j.elecom.2015.09.002.
(4) Aurbach, D.; Lu, Z.; Schechter, A.; Gofer, Y.; Gizbar, H.; Turgeman, R.; Cohen, Y.; Moshkovich, M.; Levi, E. Prototype Sys-tems for Rechargeable Magnesium Batteries. Nature 2000, 407 (6805), 724–727. https://doi.org/10.1038/35037553.
(5) Mohtadi, R.; Mizuno, F. Magnesium Batteries: Current State of the Art, Issues and Future Perspectives. Beilstein J. Nanotechnol. 2014, 5, 1291–1311. https://doi.org/10.3762/bjnano.5.143.
(6) See, K. A.; Gerbec, J. A.; Jun, Y.-S.; Wudl, F.; Stucky, G. D.; Seshadri, R. A High Capacity Calcium Primary Cell Based on the Ca-S System. Adv. Energy Mater. 2013, 3 (8), 1056–1061. https://doi.org/10.1002/aenm.201300160.
(7) Ponrouch, A.; Frontera, C.; Bardé, F.; Palacín, M. R. To-wards a Calcium-Based Rechargeable Battery. Nat. Mater. 2016, 15 (2), 169–172. https://doi.org/10.1038/nmat4462.
(8) Emanuelsson, R.; Sterby, M.; Strømme, M.; Sjödin, M. An All-Organic Proton Battery. J. Am. Chem. Soc. 2017, 139 (13), 4828– 4834. https://doi.org/10.1021/jacs.7b00159.
(9) Wu, X.; Hong, J. J.; Shin, W.; Ma, L.; Liu, T.; Bi, X.; Yu-an, Y.; Qi, Y.; Surta, T. W.; Huang, W.; Neuefeind, J.; Wu, T.; Greaney, P. A.; Lu, J.; Ji, X. Diffusion-Free Grotthuss Topochemistry for High-Rate and Long-Life Proton Batteries. Nat. Energy 2019, 4 (2), 123–130. https://doi.org/10.1038/s41560-018-0309-7.
(10) Sun, W.; Wang, F.; Hou, S.; Yang, C.; Fan, X.; Ma, Z.; Gao, T.; Han, F.; Hu, R.; Zhu, M.; Wang, C. Zn/MnO2 Battery Chem-istry With H+ and Zn2+ Coinsertion. J. Am. Chem. Soc. 2017, 139 (29), 9775–9778. https://doi.org/10.1021/jacs.7b04471.
(11) Zhao, Q.; Liu, L.; Yin, J.; Zheng, J.; Zhang, D.; Chen, J.; Archer, L. A. Proton Intercalation/De‐ Intercalation Dynamics in Vanadium Oxides for Aqueous Aluminum Electrochemical Cells. Angew. Chem. Int. Ed. 2020, 59 (8), 3048–3052. https://doi.org/10.1002/anie.201912634.
(12) Jiang, H.; Shin, W.; Ma, L.; Hong, J. J.; Wei, Z.; Liu, Y.; Zhang, S.; Wu, X.; Xu, Y.; Guo, Q.; Subramanian, M. A.; Stickle, W. F.; Wu, T.; Lu, J.; Ji, X. A High‐ Rate Aqueous Proton Battery De-livering Power Below −78 °C via an Unfrozen Phosphoric Acid. Adv. Energy Mater. 2020, 10 (28), 2000968. https://doi.org/10.1002/aenm.202000968.
(13) Fattakhova-Rohlfing, D.; Zaleska, A.; Bein, T. Three-Dimensional Titanium Dioxide Nanomaterials. Chem. Rev. 2014, 114 (19), 9487–9558. https://doi.org/10.1021/cr500201c.
(14) Ghicov, A.; Tsuchiya, H.; Hahn, R.; Macak, J. M.; Muñoz, A. G.; Schmuki, P. TiO2 Nanotubes: H+ Insertion and Strong Electrochromic Effects. Electrochem. Commun. 2006, 8 (4), 528–532. https://doi.org/10.1016/j.elecom.2006.01.015.
(15) Berger, T.; Anta, J. A.; Morales-Flórez, V. Spectroscopic Properties of Electrochemically Populated Electronic States in Nanostructured TiO2 Films: Anatase versus Rutile. Phys. Chem. Chem. Phys. 2013, 15 (33), 13790. https://doi.org/10.1039/c3cp52324a.
(16) Berger, T.; Anta, J. A.; Morales-Flórez, V. Electrons in the Band Gap: Spectroscopic Characterization of Anatase TiO2 Nanocrystal Electrodes under Fermi Level Control. J. Phys. Chem. C
2012, 116 (21), 11444–11455. https://doi.org/10.1021/jp212436b.
(17) Berger, T.; Monllor-Satoca, D.; Jankulovska, M.; Lana-Villarreal, T.; Gómez, R. The Electrochemistry of Nanostructured Titanium Dioxide Electrodes. ChemPhysChem 2012, 13 (12), 2824– 2875. https://doi.org/10.1002/cphc.201200073.
(18) Kim, Y.-S.; Kriegel, S.; Harris, K. D.; Costentin, C.; Li-moges, B.; Balland, V. Evidencing Fast, Massive, and Reversible H+ Insertion in Nanostructured TiO2 Electrodes at Neutral PH. Where Do Protons Come From? J. Phys. Chem. C 2017, 121 (19), 10325–10335. https://doi.org/10.1021/acs.jpcc.7b02395.
(19) Fleischmann, S.; Sun, Y.; Osti, N. C.; Wang, R.; Mamontov, E.; Jiang, D.; Augustyn, V. Interlayer Separation in Hy-drogen Titanates Enables Electrochemical Proton Intercalation. J. Mater. Chem. A 2019, 8 (1), 412–421. https://doi.org/10.1039/C9TA11098D.
(20) Fleischmann, S.; Spencer, M. A.; Augustyn, V. Electro-chemical Reactivity under Confinement Enabled by Molecularly Pillared 2D and Layered Materials. Chem. Mater. 2020, 32 (8), 3325– 3334. https://doi.org/10.1021/acs.chemmater.0c00648.
(21) Kreuer, K.-D. Proton Conductivity: Materials and Applica-tions. Chem. Mater. 1996, 8 (3), 610–641. https://doi.org/10.1021/cm950192a.
(22) Thorne, A.; Kruth, A.; Tunstall, D.; Irvine, J. T. S.; Zhou, W. Formation, Structure, and Stability of Titanate Nanotubes and Their Proton Conductivity. J. Phys. Chem. B 2005, 109 (12), 5439– 5444. https://doi.org/10.1021/jp047113f.
(23) Yamada, M.; Wei, M.; Honma, I.; Zhou, H. One-Dimensional Proton Conductor under High Vapor Pressure Condition Employing Titanate Nanotube. Electrochem. Commun. 2006, 8 (9), 1549–1552. https://doi.org/10.1016/j.elecom.2006.07.020.
(24) Hu, W.; Li, L.; Li, G.; Meng, J.; Tong, W. Synthesis of Ti-tanate-Based Nanotubes for One-Dimensionally Confined Electrical Properties. J. Phys. Chem. C 2009, 113 (39), 16996–17001. https://doi.org/10.1021/jp907001n.
(25) Kasuga, T.; Hiramatsu, M.; Hoson, A.; Sekino, T.; Niihara, K. Titania Nanotubes Prepared by Chemical Processing. Adv. Mater.
1999, 11 (15), 1307–1311.
https://doi.org/10.1002/(SICI)1521-4095(199910)11:15<1307::AID-ADMA1307>3.0.CO;2-H.
(26) Chen, Q.; Zhou, W.; Du, G.; Peng, L.-M. Trititanate Nano-tubes Made via a Single Alkali Treatment. Adv. Mater. 2002, 14 (17),
1208–1211.
https://doi.org/10.1002/1521-4095(20020903)14:17<1208::AID-ADMA1208>3.0.CO;2-0. (27) Wu, D.; Liu, J.; Zhao, X.; Li, A.; Chen, Y.; Ming, N. Se-quence of Events for the Formation of Titanate Nanotubes, Nanofibers, Nanowires, and Nanobelts. Chem. Mater. 2006, 18 (2), 547–553. https://doi.org/10.1021/cm0519075.
(28) Fleischmann, S.; Spencer, M. A.; Augustyn, V. Electro-chemical Reactivity under Confinement Enabled by Molecularly Pillared 2D and Layered Materials†. Chem. Mater. 2020. https://doi.org/10.1021/acs.chemmater.0c00648.
(29) Uppuluri, R.; Gupta, A. S.; Rosas, A. S.; Mallouk, T. E. Soft Chemistry of Ion-Exchangeable Layered Metal Oxides. Chem. Soc. Rev. 2018, 47 (7), 2401–2430. https://doi.org/10.1039/C7CS00290D.
(30) Muñoz-Santiburcio, D.; Wittekindt, C.; Marx, D. Nanoconfinement Effects on Hydrated Excess Protons in Layered Materials. Nat. Commun. 2013, 4 (1), 2349. https://doi.org/10.1038/ncomms3349.
(31) Muñoz-Santiburcio, D.; Marx, D. Chemistry in Nanoconfined Water. Chem. Sci. 2017, 8 (5), 3444–3452. https://doi.org/10.1039/C6SC04989C.
(32) Tunuguntla, R. H.; Allen, F. I.; Kim, K.; Belliveau, A.; Noy, A. Ultrafast Proton Transport in Sub-1-Nm Diameter Carbon Nanotube Porins. Nat. Nanotechnol. 2016, 11 (7), 639–644. https://doi.org/10.1038/nnano.2016.43.
(33) Augustyn, V.; Gogotsi, Y. 2D Materials with Nanoconfined Fluids for Electrochemical Energy Storage. Joule 2017, 1 (3), 443– 452. https://doi.org/10.1016/j.joule.2017.09.008.
(34) Mitchell, J. B.; Geise, N. R.; Paterson, A. R.; Osti, N. C.; Sun, Y.; Fleischmann, S.; Zhang, R.; Madsen, L. A.; Toney, M. F.; Jiang, D.; Kolesnikov, A. I.; Mamontov, E.; Augustyn, V. Confined Interlayer Water Promotes Structural Stability for High-Rate Electro-chemical Proton Intercalation in Tungsten Oxide Hydrates. ACS Energy Lett. 2019, 4 (12), 2805–2812. https://doi.org/10.1021/acsenergylett.9b02040.
(35) Hammersley, A. P.; Svensson, S. O.; Hanfland, M.; Fitch, A. N.; Hausermann, D. Two-Dimensional Detector Software: From Real Detector to Idealised Image or Two-Theta Scan. High Press. Res. 1996, 14 (4–6), 235–248. https://doi.org/10.1080/08957959608201408.
(36) Juhás, P.; Davis, T.; Farrow, C. L.; Billinge, S. J. L. PDFgetX3 : A Rapid and Highly Automatable Program for Processing Powder Diffraction Data into Total Scattering Pair Distribution Func-tions. J. Appl. Crystallogr. 2013, 46 (2), 560–566. https://doi.org/10.1107/S0021889813005190.
(37) Farrow, C. L.; Juhas, P.; Liu, J. W.; Bryndin, D.; Božin, E. S.; Bloch, J.; Proffen, T.; Billinge, S. J. L. PDFfit2 and PDFgui: Computer Programs for Studying Nanostructure in Crystals. J. Phys. Condens. Matter 2007, 19 (33), 335219. https://doi.org/10.1088/0953-8984/19/33/335219.
(38) Massiot, D.; Fayon, F.; Capron, M.; King, I.; Le Calvé, S.; Alonso, B.; Durand, J.-O.; Bujoli, B.; Gan, Z.; Hoatson, G. Modelling
One- and Two-Dimensional Solid-State NMR Spectra. Magn. Reson. Chem. 2002, 40 (1), 70–76. https://doi.org/10.1002/mrc.984.
(39) Hutter, J.; Iannuzzi, M.; Schiffmann, F.; VandeVondele, J. CP2K: Atomistic Simulations of Condensed Matter Systems. Wiley Interdiscip. Rev. Comput. Mol. Sci. 2014, 4 (1), 15–25. https://doi.org/10.1002/wcms.1159.
(40) VandeVondele, J.; Hutter, J. Gaussian Basis Sets for Accu-rate Calculations on Molecular Systems in Gas and Condensed Phas-es. J. Chem. Phys. 2007, 127 (11), 114105. https://doi.org/10.1063/1.2770708.
(41) Goedecker, S.; Teter, M.; Hutter, J. Separable Dual-Space Gaussian Pseudopotentials. Phys. Rev. B 1996, 54 (3), 1703–1710. https://doi.org/10.1103/PhysRevB.54.1703.
(42) Perdew, J. P.; Burke, K.; Ernzerhof, M. Generalized Gradi-ent Approximation Made Simple. Phys. Rev. Lett. 1996, 77 (18), 3865–3868. https://doi.org/10.1103/PhysRevLett.77.3865.
(43) Kim, Y.-S.; Harris, K. D.; Limoges, B.; Balland, V. On the Unsuspected Role of Multivalent Metal Ions on the Charge Storage of a Metal Oxide Electrode in Mild Aqueous Electrolytes. Chem. Sci.
2019, 10 (38), 8752–8763. https://doi.org/10.1039/C9SC02397F.
(44) Kasuga, T.; Hiramatsu, M.; Hoson, A.; Sekino, T.; Niihara, K. Formation of Titanium Oxide Nanotube. Langmuir 1998, 14 (12), 3160–3163. https://doi.org/10.1021/la9713816.
(45) Ma, R.; Bando, Y.; Sasaki, T. Nanotubes of Lepidocrocite Titanates. Chem. Phys. Lett. 2003, 380 (5–6), 577–582. https://doi.org/10.1016/j.cplett.2003.09.069.
(46) Tsai, C.-C.; Teng, H. Structural Features of Nanotubes Synthesized from NaOH Treatment on TiO2 with Different Post-Treatments. Chem. Mater. 2006, 18 (2), 367–373. https://doi.org/10.1021/cm0518527.
(47) Sasaki, T.; Watanabe, M.; Michiue, Y.; Komatsu, Y.; Izu-mi, F.; Takenouchi, S. Preparation and Acid-Base Properties of a Protonated Titanate with the Lepidocrocite-like Layer Structure. Chem. Mater. 1995, 7 (5), 1001–1007. https://doi.org/10.1021/cm00053a029.
(48) Kataoka, K.; Kijima, N.; Akimoto, J. Ion-Exchange Syn-thesis, Crystal Structure, and Physical Properties of Hydrogen Titani-um Oxide H2Ti3O7. Inorg. Chem. 2013, 52 (24), 13861–13864. https://doi.org/10.1021/ic401144k.
(49) Christiansen, T. L.; Cooper, S. R.; Jensen, K. M. Ø. There’s No Place like Real-Space: Elucidating Size-Dependent Atom-ic Structure of Nanomaterials Using Pair Distribution Function Anal-ysis. Nanoscale Adv. 2020, 2 (6), 2234–2254. https://doi.org/10.1039/D0NA00120A.
(50) Billinge, S. J. L.; Kanatzidis, M. G. Beyond Crystallog-raphy: The Study of Disorder, Nanocrystallinity and Crystallographically Challenged Materials with Pair Distribution Functions. Chem. Commun. 2004, No. 7, 749. https://doi.org/10.1039/b309577k.
(51) Gateshki, M.; Chen, Q.; Peng, L.-M.; Chupas, P.; Petkov, V. Structure of Nanosized Materials by High-Energy X-Ray Diffrac-tion: Study of Titanate Nanotubes. Z. Für Krist. - Cryst. Mater. 2007, 222 (11/2007). https://doi.org/10.1524/zkri.2007.222.11.612.
(52) Feist, T. P.; Davies, P. K. The Soft Chemical Synthesis of TiO2 (B) from Layered Titanates. J. Solid State Chem. 1992, 101, 275–295. https://doi.org/10.1016/0022-4596(92)90184-W.
(53) Armstrong, A. R.; Armstrong, G.; Canales, J.; Bruce, P. G. TiO2-B Nanowires. Angew. Chem. Int. Ed. 2004, 43 (17), 2286–2288. https://doi.org/10.1002/anie.200353571.
(54) Wu, Y.; Yu, J.; Liu, H.-M.; Xu, B.-Q. One-Dimensional TiO2 Nanomaterials: Preparation and Catalytic Applications. J. Nanosci. Nanotechnol. 2010, 10 (10), 6707–6719. https://doi.org/10.1166/jnn.2010.2531.
(55) Zhu, G.-N.; Wang, C.-X.; Xia, Y.-Y. Structural Transfor-mation of Layered Hydrogen Trititanate (H2Ti3O7) to TiO2(B) and Its Electrochemical Profile for Lithium-Ion Intercalation. J. Power Sources 2011, 196 (5), 2848–2853. https://doi.org/10.1016/j.jpowsour.2010.07.023.
(56) Lei, Y.; Sun, J.; Liu, H.; Cheng, X.; Chen, F.; Liu, Z. Atomic Mechanism of Predictable Phase Transition in Dual-Phase H2Ti3O7/TiO2 (B) Nanofiber: An In Situ Heating TEM Investigation.
Chem. - Eur. J. 2014, 20 (36), 11313–11317. https://doi.org/10.1002/chem.201403272.
(57) Wang, N.; Lin, H.; Li, J.; Zhang, L.; Lin, C.; Li, X. Crystal-line Transition from H2Ti3O7 Nanotubes to Anatase NanocrystalCrystal-lines Under Low-Temperature Hydrothermal Conditions. J. Am. Ceram. Soc. 2006, 89 (11), 3564–3566. https://doi.org/10.1111/j.1551-2916.2006.01257.x.
(58) Ma, J.; Reeves, K. G.; Porras Gutierrez, A.-G.; Body, M.; Legein, C.; Kakinuma, K.; Borkiewicz, O. J.; Chapman, K. W.; Groult, H.; Salanne, M.; Dambournet, D. Layered Lepidocrocite Type Structure Isolated by Revisiting the Sol–Gel Chemistry of Anatase TiO2 : A New Anode Material for Batteries. Chem. Mater. 2017, 29 (19), 8313–8324. https://doi.org/10.1021/acs.chemmater.7b02674.
(59) Wang, M.; Jaegers, N. R.; Lee, M.-S.; Wan, C.; Hu, J. Z.; Shi, H.; Mei, D.; Burton, S. D.; Camaioni, D. M.; Gutiérrez, O. Y.; Glezakou, V.-A.; Rousseau, R.; Wang, Y.; Lercher, J. A. Genesis and Stability of Hydronium Ions in Zeolite Channels. J. Am. Chem. Soc.
2019, 141 (8), 3444–3455. https://doi.org/10.1021/jacs.8b07969.
(60) Crocker, M.; Herold, R. H. M.; Wilson, A. E.; Mackay, M.; Emeis, C. A.; Hoogendoorn, A. M. 1 H NMR Spectroscopy of Tita-nia. Chemical Shift Assignments for Hydroxy Groups in Crystalline and Amorphous Forms of TiO2. J. Chem. Soc. Faraday Trans. 1996, 92 (15), 2791–2798. https://doi.org/10.1039/FT9969202791.
(61) Beluze, L.; Badot, J. C.; Weil, R.; Lucas, V. Broadband Di-electric and Resistivity Spectroscopy of WO3·H2O in the Range of 103−1010
Hz: Particle Size Effect. J. Phys. Chem. B 2006, 110 (14), 7304–7308. https://doi.org/10.1021/jp0561524.
(62) Gao, T.; Fjeld, H.; Fjellvåg, H.; Norby, T.; Norby, P. In Situ Studies of Structural Stability and Proton Conductivity of Titan-ate Nanotubes. Energy Environ. Sci. 2009, 2 (5), 517. https://doi.org/10.1039/b821532b.
(63) Cole, K. S.; Cole, R. H. Dispersion and Absorption in Die-lectrics I. Alternating Current Characteristics. J. Chem. Phys. 1941, 9 (4), 341–351. https://doi.org/10.1063/1.1750906.
(64) Berthumeyrie, S.; Badot, J.-C.; Pereira-Ramos, J.-P.; Dubrunfaut, O.; Bach, S.; Vermaut, Ph. Influence of Lithium Insertion on the Electronic Transport in Electroactive MoO3 Nanobelts and Classical Powders: Morphological and Particle Size Effects. J. Phys. Chem. C 2010, 114 (46), 19803–19814. https://doi.org/10.1021/jp106837g.
(65) Badot, J.-C.; Lestriez, B.; Dubrunfaut, O. Interest in Broadband Dielectric Spectroscopy to Study the Electronic Transport in Materials for Lithium Batteries. Mater. Sci. Eng. B 2016, 213, 190– 198. https://doi.org/10.1016/j.mseb.2016.05.012.
(66) Cadène, A.; Rotenberg, B.; Durand-Vidal, S.; Badot, J.-C.; Turq, P. Dielectric Spectroscopy as a Probe for Dynamic Properties of Compacted Smectites. Phys. Chem. Earth Parts ABC 2006, 31 (10), 505–510. https://doi.org/10.1016/j.pce.2006.04.002.
(67) Badot, J.-C.; Ligneel, É.; Dubrunfaut, O.; Guyomard, D.; Lestriez, B. A Multiscale Description of the Electronic Transport within the Hierarchical Architecture of a Composite Electrode for Lithium Batteries. Adv. Funct. Mater. 2009, 19 (17), 2749–2758. https://doi.org/10.1002/adfm.200900379.
(68) Badot, J. C.; Fourrier-Lamer, A.; Baffier, N. Dielectric Study of V2O5-1.6H2O Xerogel in the Broad Frequency Range (105 -1010 Hz). J. Phys. 1985, 46 (12), 2107–2115. https://doi.org/10.1051/jphys:0198500460120210700.
(69) Buchner, R.; Barthel, J.; Stauber, J. The Dielectric Relaxa-tion of Water between 0°C and 35°C. Chem. Phys. Lett. 1999, 306 (1– 2), 57–63. https://doi.org/10.1016/S0009-2614(99)00455-8.
(70) Badot, J.-C.; Baffier, N. Ionic Conductivity and Dielectric Properties of Vanadium Pentoxide Xerogels. J. Mater. Chem. 1992, 2, 8. https://doi.org/10.1039/JM9920201167.
(71) Agmon, N. The Grotthuss Mechanism. Chem. Phys. Lett.
1995, 244 (5), 456–462.
https://doi.org/10.1016/0009-2614(95)00905-J.
(72) Kreuer, K. D.; Rabenau, A.; Messer, R. Proton Conductivi-ty in the Layer Compound H3OUO2AsO4·3H2O (HUAs). Appl. Phys. A 1983, A 32, 45–53. https://doi.org/10.1007/BF00617828.
(73) Boschloo, G.; Fitzmaurice, D. Electron Accumulation in Nanostructured TiO2 (Anatase) Electrodes. J. Phys. Chem. B 1999, 103 (37), 7860–7868. https://doi.org/10.1021/jp983040m.
(74) Augustyn, V.; Simon, P.; Dunn, B. Pseudocapacitive Oxide Materials for High-Rate Electrochemical Energy Storage. Energy Environ. Sci. 2014, 7 (5), 1597–1614. https://doi.org/10.1039/C3EE44164D.
(75) Lübke, M.; Johnson, I.; Makwana, N. M.; Brett, D.; Shear-ing, P.; Liu, Z.; Darr, J. A. High Power TiO2 and High Capacity Sn-Doped TiO2 Nanomaterial Anodes for Lithium-Ion Batteries. J. Pow-er Sources 2015, 294, 94–102. https://doi.org/10.1016/j.jpowsour.2015.06.039.