Method Of Optimal Operation Of Small Dam In Irrigation
8
0
0
Texte intégral
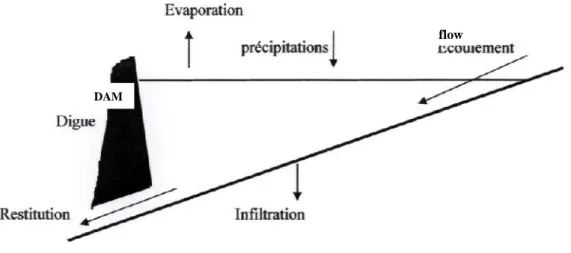
(2) M. Ladjel. J Fundam Appl Sci. 2015, 7(1), 83-90. 84. We consider that in a semiarid climate region a relative increase in the capacity of the water dam, can be beneficial, because it allows storing an excess of water; otherwise it will be destiny for siltation. The hydrological standards “international” are developed and checked in climatic conditions of temperate countries where there is a relative abundance of precipitation during the twelve months of the year. Their application in Arab countries a semiarid climate must be the subject of a critical analysis and of a comprehensive study on the recommended objective or to solve problems. For example, we remark that hydrometric rivers in geometrically deformable beds, remains a problematic. However, the correct genetic commodity of the hydromatic regime, based on appropriate measures, would consider a rational exploitation of water resource [1]. In addition, the operation of a dam or a dam system must use forecasts hydro meteorological as medium term.. 2. ESTABLISHMENT OF WATER BALANCE OF A DAM It considers a dam as a dynamic system whose basic components vary continuously over time. For convenience, we discredited time in monthly intervals. In the beginning, the dam has a volume of water Vi that add the flow E and precipitation P during the month. But at the same time, the water dam is given a quantity of water, in the form of restitution Rs. to the user, a. part of the water stored in the dam are evaporated directly from the water Pev and the other part infiltrates into the subsoil and groundwater supplies [2,3]. The figure below shows the main components of the water balance for Dam.. flow. DAM. Fig. 1. The main components of water balance of water dam.
(3) M. Ladjel. J Fundam Appl Sci. 2015, 7(1), 83-90. 85. The monthly water balance in the water dam equation is expressed as follows [8]:. Vi 1 Vi Pi 1. Ei 1 Rs , i 1 Pev, i 1 Pfil , i 1. (1). Where:. Vi -The volume of water at the beginning of the month; Vi1 -The volume of water at the end;. Pi 1 - Blade precipitated during the month i 1 ; - The mean surface of the water during the month i 1 ;. Ei1 - Water intake during the month i 1 ; Ai 1 - Restitution, during the month i 1 ; Pev , i 1 - The amount of evaporation during the month i 1 ; Pfil , i 1 - The volume of water filtered during the month i 1 ;. 3. IDENTIFICATION OF WATER BALANCE COMPONENTS *ESTIMATES OF FLOW It considers that the flow in the dam during the month i 1 , depend on the precipitation of frequency data P% during that same month and the basin physic of the previous [1,9] month statement. We can use the model of storm flow [4, 5, 6, and 7], we write:. Ei 1,P % i 1,P % .Pi 1,P % was. i 1, P % 1 Pi 1, P %. and. mi 1 . m 1. Ci ln Pi. (2) (3) (4). where:. Ei 1, P % - Flow that month i 1 ; Pi 1, P % - The precipitation during the same month i 1 ; i1,P % - Coefficient of the monthly flow i 1 ;. Pi - Precipitation of the previous month i ;. mi - Parameter dependent on the initial state of saturation of the watershed losses;.
(4) M. Ladjel. J Fundam Appl Sci. 2015, 7(1), 83-90. 86. E Ci ln1 i - Monthly average rainfall remained in the watershed during the previous Pi time interval i . The application of this model’s prediction, after identification of the two parameters mi and. ci , it must be verified by the following criteria [6,7] as:. E. observé. _ E calculé min. The choice of frequency P%, attributed to the monthly rainfall, depends on the risk to lose. Its value ranges from: *P = 100% for zero risk, that correspond with the minimum value of precipitation guarantees 100%, which mean it is limited only for the use of flow warranty. *P = 50% this limitation correspond with the average monthly precipitation amount, the risk is certain for any deviation from the actual observed value must cause a deficiency of restitution on one or several months. For the first case, P = 100%, the operation is limited to the use of water minimum stored in the dam, since the beginning of irrigation season (early April), without taking into account the following month rains. Therefore, we must seek optimal value frequency P%, in order to reduce the margin of risk, while using rain likely falling during the month; knowing that the frequencies of monthly precipitation vary considerably. But they are subject a cyclicality seasonal which shows the existence of any auto correlation between monthly rainfalls. We consider that frequency of the month rainfall of the order of P=75% may well ensure a minor risk towards the need of irrigation.. *DETERMINATION OF LOSS OF WATER IN DAM It was agreed to consider that the losses of water in dam are evaporative losses Pev , from the plan of water and filtration Pfil in the bowl and through the dyke. The volume of losses by filtration depends on the hydro geological of the site conditions it represents a share of monthly average volume V in the dam [8], is the calculus:. Pfil V. (5). The determination of the coefficient can be established on the basic of regional water less study in existing dam; on the basic of the analysis of the water balance of the dam. The.
(5) M. Ladjel. J Fundam Appl Sci. 2015, 7(1), 83-90. 87. volume of evaporation loss is function of the monthly average temperature t of the air and the average area of water in dam [8]. Either:. Pev f (t , ). With . (6). i i 1 Vi Vi 1 and V . Knowing that there is also calculus: f V . 2 2. It is possible to take into consideration two loss types and express them by a single calculus on the basic of the average volume V . The graph-analytical analysis of monthly total water loss PT is existing dams, allows the separation of the loss by filtration and evaporation for the purpose of identification of two calculi (5) & (6). By giving different values losses PT and the loss by filtration Pfil. (i ). (i ). to , there are differences between the total. (i ) V , which represents volumes of evaporation. loss Pev . That all depend on the monthly temperature average air t and the average area of the water plan :. Pev Pr ,t Pinf. (i ). (7). The evaporation volume Pev is equal to the product of the blade evaporated Eev by the area of the water plan , either:. Pev Eev .. (8). Where: the plan evaporated for temperature average data t , admit proportional with temperature average data t . The calculus expressed:. . Eev t t . The giving calculation for different successive values Pfil. (9). (i ). (i ) V determinate the values. of evaporation. These calculation stop when it reaches a better correlation between Eev and t . The graph below develops the procedure for separation, by filtration Pfil V and evaporation losses Pev ..
(6) J Fundam Appl Sci. 2015, 7(1), 83-90. Pev, Pfil, mm,. M. Ladjel. 88. 325 300 275 250 225 200 175 150 125. Pev. 100 75 50. Pfil. 25 0 0. 10. 20. 30. 40. 50. 60. 70. 80. 90. 100. 110. 120. 130. Volume moyen, millions m3. Fig.2. The dependence of water loss in the volume of water in the dam. The estimate of losses by evaporation Pev must match the minimum average frequency. P % min of the worst monthly temperature average the most favorable ( P 25% ). 4. ESTABLISHMENT OF DIAGRAM OF OPERATION Hydrological operation involves managing water stored in the dam, taking into account the probable additional contributions that allergens increase the volume of water store and monthly refunds Rs , i 1 , knowing that the volume of refund remains consistent with the regime of irrigation. By replacing the model of flow m. and those losses by seepage . and. evaporation , in the hydrological balance equation (1), and after a few transformations, it gets the expression of the volume of water in the dam at the end of interval time i 1 :. Vi1 Vi Pi1, 75% . Ei1, 75% Rs , i1 Pev, i1 Pfil , i1 Or in the form: 2 1 B Vi 1 Vi Ei 1, 75% Rs , i 1 B B . With:. B 2 aVi Pi 1, 75% aVi t i 1, 25% . Vi - Volume of water at the end of the month i ; Vi 1 - Volume of water at the end of the month i 1 ;. (10).
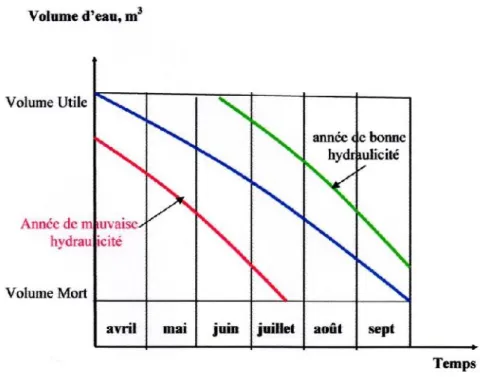
(7) M. Ladjel. J Fundam Appl Sci. 2015, 7(1), 83-90. 89. Pi 1, 75% - Monthly average rainfall maximum frequency P 75% ; Ei1,75% - Monthly mean maximum flow-rate P 75% ;. t i1, 25% - Air temperature, minimum average frequency P 25% . Rs , i 1 - The return for the month i 1 . With the help of calculus (10), it process a calculation in chronological reverse of emptying of dam during the months of irrigation, it is to say since the dead volume Vmort and up to strong volume Vutil [8]. For various irrigation schemes, there are curves different from references, which will serve as exploitation guide, because we must always maintain the volume of water in the dam, higher or equal than the one indicate by the curve any data. Otherwise, we can construct exploitation curves, for different levels of hydrolicite for the year of good water conditions with maximum monthly contribution, the operator may increase the refund and remit the surplus flow without prejudice to the system of irrigation in the coming month. For the year with bad hydrolicite, with minimum monthly contributions, it can estimate the deficit that undergoes the refund during the coming months. Moreover reserves may be exhausted before term. Figure 3 shows the normal operating curve (blue) and operating curves in terms of abundance (green) and deficit (red).. Fig.3. The curves of dam.
(8) M. Ladjel. J Fundam Appl Sci. 2015, 7(1), 83-90. 90. 5. CONCLUSION The optimal operation of a small dams based on monthly water balance, must use the forecast probabilities hydra metrological. The identification of the parameters of the model of the flow is easily feasible with common hydrological data. The choice of values of calculating frequencies, weather (monthly rainfall and temperature) components must minimize the risk of deficits of the return of the water of irrigation. The establishment of a graph of operating with these three branches facilitate the management of waters of the dam.. 6. REFERENCES [1] Бефани А. Н. Вопросы региональной гидрологии. Паводочный сток. Киев, УМК ВО, 1989, 132 стр. [2] Горошков И. Ф. Гидрологические расчеты. Ленинград, Гидрометеоиздат, 1979, 631 стр. [3] Железняк И. А. Регулирование паводочного стока. Ленинград, Гидрометеоиздат, 1965, 326 стр. [4] Ladjel Mahmoud:'' The methods for determining the hydrological characteristics of small watersheds. "Communication, National Seminar on Withholding Collinear, Sétif, 1986. [5] Ladjel Mahmoud'' Contribution to the calculation of dams to protect urban areas against storm floods'' 3rd National Seminar on Water Resources, 26,27 and 28 October 1998, Biskra.. [6] Ladjel Mahmoud'' Forecast streamflow during low flow''. Scientists days INRGREF, Hammamet, 29 and 30 October 1998, Tunisia. [7] Ladjel Mahmoud'' Projections of monthly flow in the Ighil-Emda dam. Workshop on dams. I.G.C. Abu Bakr University Belkaïd, 30 and 31 May 1999, Tlemcen. [8] Плешков Я. ф. Регулирование речного стока -водохозяйственные росчеты-. Ленинград, Гидрометеоиздат, 1975, 558 стр. [9] Соколовский Д. Л.Речного сток. Ленинград, Гидрометеоиздат, 1968, 539 стр.. How to cite this article Ladjel M. Method of optimal operation of small dam in irrigation. J Fundam Appl Sci.2015, 83-90..
(9)
Figure
Documents relatifs
This problem may be cast in two main statical frameworks: an Eulerian one [Xia03], based on vector valued measures (more precisely normal 1-currents) called transport paths, and
In South Africa, the policy of apartheid and, in particular, the Tomlinson Commis- sion of 1955 forged a strong link between irrigation and terri tory becau se, in an effort
This study demonstrated how the measures of NDVI, surface temperature and evapotranspiration (ET) were derived from the available satellite images for the Macalister
Recognizing the realities the government has focused on the need of higher contribution of farmers through participation in different development stages of irrigation management to
The current users of water from the Mlazi River in the study area are 74 commercial farmers, the Entembeni and Hopewell communities, some emerging farmers, a forestry area, the
LOUBOUTIN, Explicit upper bounds for residues of Dedekind zeta functions and values of L-functions at s = 1, and explicit lower bounds for relative class numbers
Free surface flow, two-phase flow, shallow water equations, dam break problem, finite volume method.. The second author was supported by the Marie Curie Fellowship
its food requirement9 and the rate of increase in demand for food exceeds the rate of increase in agricultural production. Because aridity is the major
