SEMANTIC ENRICHMENT OF POINT CLOUD BY AUTOMATIC EXTRACTION AND
ENHANCEMENT OF 360° PANORAMAS.
A. Tabkha 1, R. Hajji 1, R. Billen 2, F. Poux 2, *
1 Geomatics and Surveying Engineering, Hassan 2 Agronomic and Veterinary Institute, Rabat, Morocco 2 Geomatics Unit, University of Liège, 4000 Liège, Belgium - fpoux @uliege.be
Commission II
KEY WORDS: 3D Point cloud, Semantic information, Feature extraction, point cloud representation, Deep learning, Image
recognition.
ABSTRACT:
The raw nature of point clouds is an important challenge for their direct exploitation in architecture, engineering and construction applications. Particularly, their lack of semantics hinders their utility for automatic workflows (Poux, 2019). In addition, the volume and the irregularity of the structure of point clouds makes it difficult to directly and automatically classify datasets efficiently, especially when compared to the state-of-the art 2D raster classification. Recently, with the advances in deep learning models such as convolutional neural networks (CNNs) , the performance of image-based classification of remote sensing scenes has improved considerably (Chen et al., 2018; Cheng et al., 2017). In this research, we examine a simple and innovative approach that represent large 3D point clouds through multiple 2D projections to leverage learning approaches based on 2D images. In other words, the approach in this study proposes an automatic process for extracting 360° panoramas, enhancing these to be able to leverage raster data to obtain domain-base semantic enrichment possibilities. Indeed, it is very important to obtain a rigorous characterization for use in the classification of a point cloud. Especially because there is a very large variety of 3D point cloud domain applications. In order to test the adequacy of the method and its potential for generalization, several tests were performed on different datasets. The developed semantic augmentation algorithm uses only the attributes X, Y, Z and camera positions as inputs.
1. INTRODUCTION
LIDAR (Light Detection and Ranging) and photogrammetry/computer vision techniques make it possible to acquire large volume of 3D data as point clouds, in a limited time frame and with great precision. However, the post-processing phases do not follow this acquisition simplicity, since point clouds still present major challenges for the automatic management, recognition and understanding. An important part of the research is focused on optimizing and improving these analysis and production processes (Poux et al., 2018, 2017; Poux and Billen, 2019a) Indeed, the volume and irregularity of the LIDAR point cloud structure make it difficult to associate a class with a point (Guinard et al., 2017).
According to (Morton et al., 2011), it appears that the segmentation of dense, unstructured and noisy data is a predominant problem. The manual segmentation of clouds with several billion points is extremely heavy and imprecise, so the search for automation of such a process is essential.
This issue has been the subject of several scientific studies, particularly in remote sensing (Poux et al., 2016; Poux and Billen, 2019b). The classification of image scenes is an active, stimulating and controlled task for many applications. More recently, with advances in in-depth learning models, particularly using convolutional neural networks (CNNs), the performance of the classification of remote sensing image scenes has been significantly improved through powerful representations of the functions learned by CNNs (Chen et al., 2018; Wang et al., 2018). In recent years, deep learning algorithms have become very effective tools for label and multi-label classification, and various implementations of these algorithms have been published for
* Corresponding author
developers as Application Programming Interfaces (APIs). The most salient approaches have been published by many research groups in: Imagga, Watson IBM, Clarifai, Microsoft, Wolfram Alpha, Google, Caffe, DeepDetect, OverFeat and TensorFlow. (Kubany et al., 2019).
In this article, we examine a simple and innovative approach that represent large 3D point clouds through multiple 2D projections to leverage learning approaches based on 2D images. In other words, the approach in this study proposes an automatic process for extracting 360° panoramas, enhancing these to be able to leverage raster data to obtain domain-base semantic enrichment possibilities. Indeed, it is very important to obtain a rigorous characterization for use in the classification of a point cloud. Especially because there is a very large variety of 3D point cloud domain applications. In order to test the adequacy of the method and its potential for generalization, several tests were performed on different datasets. The developed semantic augmentation algorithm uses only the attributes X, Y, Z and camera positions as inputs. Thus, the main objectives of this work can be summarized in three fundamental points:
- Propose a process that allows to build a 2D panoramic scene from a 3D cloud, in order to take advantage of image recognition databases Image processing. - Apply the necessary treatments to obtain a
homogeneous rendering of the panoramic scene. - Incorporate the results into an Artificial Intelligence
platform.
This project is at the origin of a new research path, knowing that the results of this study make it possible to directly exploit the canonical link between the point cloud and the cylindrical projection applied to obtain the panoramic scene. This link is
The International Archives of the Photogrammetry, Remote Sensing and Spatial Information Sciences, Volume XLII-2/W17, 2019 6th International Workshop LowCost 3D – Sensors, Algorithms, Applications, 2–3 December 2019, Strasbourg, France
used to match the semantic information (added a priori to the 360° image) to the initial point cloud, which lacks all the information that characterizes its class/field.
2. WORKFLOW AND CHALLENGES
In this section, we describe the point cloud analysis methodology used to add semantic information. Our automatic procedure is serialized in three steps, as shown in the figure below. In section 2.1, we describe the constitution of the panoramic image grid. In section 2.2, we discuss the processing processes necessary to homogenize the renderings and enhance identification. Afterwards, in Section 2.3, we define the idea behind semantic enrichment through the use of intelligent image recognition systems. Lastly, we provide some examples illustrating the relevance of the adopted sequence
Figure 1. This Diagram shows a Methodological workflow for the semantic enhancement and automatic classification. A point cloud goes through several serialized steps (diamonds) to obtain a classified point cloud (red square).
2.1 Panoramic projection
This section is mainly dedicated to explaining the solution developed to overcome the various challenges. It should be pointed out that the objective is to take full advantage of the recognition algorithms already trained on consistent databases in order to add semantic information on a point cloud. To be able to use these algorithms, we must go through a projection of the point cloud to have an image on which we can apply automatic categorization processes.
2.1.1 Theoretical approach
Several projections have been proposed in the literature, each of them converts the 3D object into a 2D grid with specific features. Projection of 3D data by a spherical or cylindrical transformation has been a common practice to represent 3D data in a planar format (David, 2006). Such projections help the data projected to remain invariant to rotations around the main axis of the projection and facilitate the processing of 3D data due to the Euclidean grid structure of the resulting projections. In the rest of
this section we will discuss the principle of the cylindrical transformation because it is the most adapted to our case, where we try to generate a panoramic image (equirectangulaire grid), while maintaining a homogeneous aesthetic aspect. Also for its simplicity since the cylinder is a developable surface.
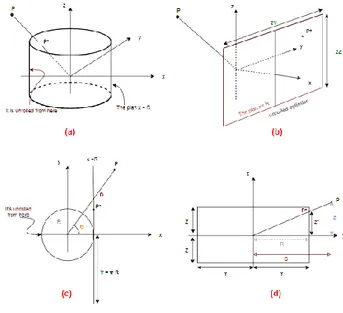
Figure 2.a below shows a cylinder centred on the origin. It is easy to visualize how each point P of the space is projected at a point P* on the cylinder. The figure beside 2.b shows the unrolled cylinder, so that the point P still in the same position (x,y,z) of the space, and its projection moves with the cylinder.
Figure 2. Panoramic projection.
(a) : Projection cylinder, (b) : unrolled cylinder, (c) : cylinder seen from above, (d) : Plan of projection.
As shown in Figure 2.b, the projection of all points will be on a plane 𝑥=𝑅. So, it is easy to deduct the x* abscesses, which will only be a constant (equal to R) that can be simplified to zero. The y* coordinate must correspond to the length of the arc formed by the angle ϴ, which is equal to R*ϴ. The angle ϴ depends only on the x and y coordinates of the point P and not on the z.
Finally, the expression of the P* coordinates is: (𝑥∗, 𝑦∗, 𝑧∗) = (0, ±𝑅 𝚹, 𝑧𝑌 𝜋√𝑥2+𝑦2 ) With, 𝚹 = arcsin ( 𝑦 √𝑥2+ 𝑦2) = arcos ( 𝑥 √𝑥2+ 𝑦2) = arctg ( 𝑦 𝑥 ) However, in our case, the position of the observer (camera) is not necessarily in the origin of the "Scene" space, it can be in any position. Therefore, before projecting, it is first necessary to proceed to a simple translation of the point cloud by the subtraction of the coordinates (xc, yc, zc) of the camera as shown in the figure 3 below.
The International Archives of the Photogrammetry, Remote Sensing and Spatial Information Sciences, Volume XLII-2/W17, 2019 6th International Workshop LowCost 3D – Sensors, Algorithms, Applications, 2–3 December 2019, Strasbourg, France
Figure 3. Transformation Process.
(a) : Viewpoint selection (camera position), (b) : Point cloud translation, (c) : Application of the cylindrical projection. The application of these mathematical concepts on a three-dimensional point cloud gives the following results.
Figure 4. Projection results.
(a) : Initial Points cloud (with Potree), (b) : Projected cloud
2.1.2 Image Generation
At this stage, the projection algorithm is well validated. A flat point cloud is available, which represents a virtual view from a specified camera position. However, it is not yet an image. The module that manages image creation in the python environment is the PIL module. The inputs must be stored in tuples (R, G, B) to read with Pillow Ordered by pixels. For example, if we want to create a 4x4 image, the table structure must have the following shape:
#pixels = [ # [(54, 54, 54), (232, 23, 93), (71, 71, 71), (168, 167, 167)], # [(204, 82, 122), (54, 54, 54), (168, 167, 167), (232, 23, 93)], # [(71, 71, 71), (168, 167, 167), (54, 54, 54), (204, 82, 122)], # [(168, 167, 167), (204, 82, 122), (232, 23, 93), (54, 54, 54)] #]
In our case, we want to create a panoramic image. In a practical way, we are talking about a grid of pixels with a length that is twice as long as its width, which is practically (1572 x 786). This is not a random choice of resolution, but it is the solution that offers the best compromise between the image quality and the execution time. We examined five different resolutions, namely (500 x 1000), (687 x 1572), (1000 x 2000), (1572 x 3144) and (3144 x 6288) to come up with this conclusion.
The first approach proposes to build an empty table (= matrix). This table will normally contain 1572 x 786 = 1 235 592 tuples of (R, G, B). Thus, for each pixel, it is necessary to go through the whole table of new coordinates, to look for all the points that correspond to this pixel. Then, we keep only the nearest point at the camera position. This method, despite its simplicity, presents a very high execution time that takes a couple of hours, which is inefficient and unfruitful from a technical point of view.
Figure 5. Image Construction Diagram
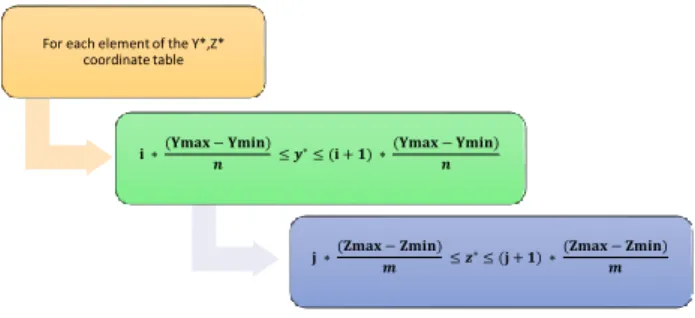
On the implementation side, this approach results in a triple loop where we go through the table of Y* and Z*, we look for the parameter “i” that allows y* to check the formula in Figure 5. Then, we look for the “j” that confirms the inequality mentioned above.
The solution developed to overcome this problem is based on a reverse perception of the issue. Rather than searching the right points for each pixel, it is easier to predict the appropriate pixel for each point when calculating his new coordinates (y*, z*). Thus, the Image grid is formed at the same time as the table of new coordinates. The mathematical trick is to deduce “i” and “j” directly from y* and z*.The new configuration of the program then becomes as follows:
Figure 6. The improved Diagram.
For each element of the Y*,Z* coordinate table 𝐢 ∗(𝐘𝐦𝐚𝐱 − 𝐘𝐦𝐢𝐧) 𝒏 ≤ 𝒚 ∗≤ (𝐢 + 𝟏) ∗(𝐘𝐦𝐚𝐱 − 𝐘𝐦𝐢𝐧) 𝒏 𝐣 ∗(𝐙𝐦𝐚𝐱 − 𝐙𝐦𝐢𝐧) 𝒎 ≤ 𝒛∗≤ (𝐣 + 𝟏) ∗ (𝐙𝐦𝐚𝐱 − 𝐙𝐦𝐢𝐧) 𝒎
For each component as soon as it is calculated
𝑖 ≤ (𝑦∗∗ 𝑛
𝑌𝑚𝑎𝑥 − 𝑌𝑚𝑖𝑛) ≤ (𝑖 + 1)
𝐣 ≤ (𝒛∗∗ 𝒎
𝐙𝐦𝐚𝐱 − 𝐙𝒎𝒊𝒏) ≤ (𝐣 + 𝟏)
The International Archives of the Photogrammetry, Remote Sensing and Spatial Information Sciences, Volume XLII-2/W17, 2019 6th International Workshop LowCost 3D – Sensors, Algorithms, Applications, 2–3 December 2019, Strasbourg, France
It becomes explicit that the i is only the entire part of the ratio: 𝑦∗∗ ( 𝑛
(Ymax−Ymin)) ; (n : the number of divisions) This method has reduced the computing time (6.971.911 points) from about 6 hours to only 4 minutes1, which is a considerable
and practical improvement.
Figure 7. Choosing the camera position (Potree)
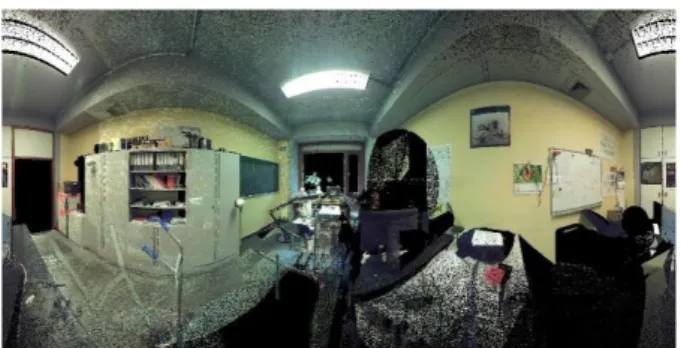
Finally, the resulting image is illustrated in Figure 8:
Figure 8. The panoramic image
2.2 Image processing
The challenge in this study is not limited to generating an image from a point cloud. Once obtained as in Figure 8, we apply a method to homogenise this rendering (image), as illustrated bellow. The resulting image (Figure 8) from step 2.1 has some anomalies that can be summarized in three main types: the occurrence of noise, the presence of empty areas, and artefacts related to the point cloud.
The objective is to achieve a well-balanced panoramic view. This means reducing noise, and filling in gaps homogeneously. To do so, several tests were carried out using several approaches. At first, we tried to use directly some of the image processing libraries of homogenization that are available on Python, specifically the "Open CV" library. However, the results was not very satisfying. The noise reduction algorithms integrated in this library make changes over the entire image and produce a degradation of the sharp areas of the image, as shown in the following figures. This figure is obtained by using a median filter, which proceeds by replacing the value of a pixel with the median value of the pixels in a local window, to reduce noise. If we compare it with the initial image (Figure 8), we can see that there is a decrease of noise. However, this reduction remains insufficient because some parts with the black colour have also expanded, (we mention here the case of lamps for example).
1 This experiment was performed on a PC (Processor: : Intel® Core™ i5 CPU ; RAM : 6 Go ; GeForce GT 240)
Figure 9. Example of a median filter application with OpenCV The two main enhancements are presented in the following extracts:
Figure 10. Noise attenuation and void reduction ①. .
Figure 11. Loss of detail due to the spread of voids ②. However, the presence of voids is still maintained, and the boundaries of objects have become blurred as in figure 12.
Figure 12. The boundaries are blurred ③.
A second enhancement, depicted in Figure 13, shows the effect of using a Gaussian filter: the entire image has become blurred.
Figure 13. Example of Gaussian filter application with OpenCV
The International Archives of the Photogrammetry, Remote Sensing and Spatial Information Sciences, Volume XLII-2/W17, 2019 6th International Workshop LowCost 3D – Sensors, Algorithms, Applications, 2–3 December 2019, Strasbourg, France
Therefore, the solution developed to solve the problem at this stage is to apply a contour filter to preserve edges in the noise elimination process. However, the nature of our (virtual) image is an obstacle, as the developed techniques and algorithms are more adapted to realistic images.
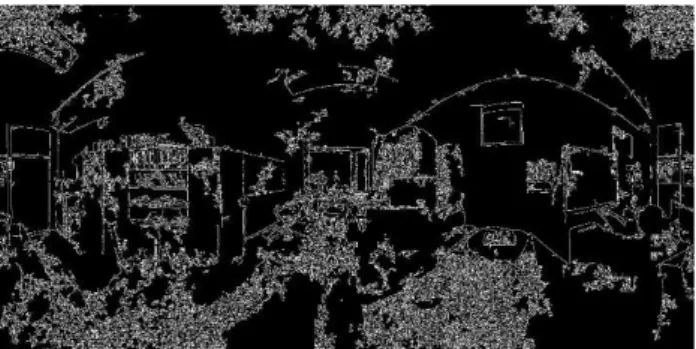
In image treatment, the Canny Filter is one of the filters that is widely used for its consistency in edge detection. Yet, the presence of several artefacts and discontinuities gives unpleasant results as illustrate in Figure 14.
Figure 14. Application of the Canny filter for edge detection.
Experimentation has shown that the first two approaches mentioned above are inappropriate to address homogenization problems. Therefore, we developed a processing method taking
in consideration the different irregularities mentioned above. The diagram presented in Figure 15 includes a sequence of steps chosen to homogenize the resulting image from the previous section. Two main phases can be highlighted:
Phase I: from step E.1 to step E.4. The main purpose of this phase is to fill the gaps in the image in order to make the result more homogeneous.
Phase II: illustrated by the last step E.5. It allows to reduce the artifacts related to the different scan positions by a static filter that takes into consideration an image of the intensity. The results of the process achieved in this section are summarized in three images that highlight the progress made in this work. In order to facilitate the reader's task, a numbering of the improvements is used. The location of the numbers indicates the areas where to compare an image with its background.
First, the Initial Image as conceived by the first part of this study (a) is characterized by an abundance of empty pixels and scan artifacts.
The second Image (b) presents an intermediate step (precisely after step E.2). It has undergone a first filling that mainly attacks small agglomerations of empty pixels.
As a result, several changes are noted:
①: It is clear that these areas have been filled in a homogeneous way, especially on the bookshelf.
②: Disappearance of empty pixels
③: This area represents the ideal example that underlines the idea behind this Algorithm. Since the poster has been completed perfectly so the interpolation of the wall in this corner is considerably good.
④: The PC screen is well homogenized, in addition the vacuum next to it has been interpolated properly.
⑤: Recovery of a large part of the office. However, what remains impressive is the recovery of the text within the papers and that was not perceptible on the initial Image (Figure 16).
Figure 15. Image treatment process used in the program
Figure 16. Retrieving Text from papers.
In the end, the final image (c) shows the reduction of artefacts related to several scans, while completing the empty areas with padding. Numbered are several effects
⑥: Decrease in dotted lines of different colors (artefacts), especially in the ceiling and at the back of the stage.
⑦: Effects of padding in areas with huge voids.
⑧: Improved recovery of the desktop part, with noise cleaning. ⑨: This zone is mentioned to effectively prove that despite all the modifications and interpolations reported, the contours are still not preserved. See even the small details are kept. The fine writings at the table level as an example.
Final Image
Completion (E.5)
The use of local statistical filter (with the intensity image)
Second Filling (E.4)
5x5 window filtering and filling a whole matrix of 9 pixels with the median (fill in the coarse gaps)
Sharpening and Consolidation of contours (E.3)
Repeat the filter 3x3 many times (over 40 ) to complete the small slots
First Filling of Gaps (E.2)
Application of 3x3 and then 5x5 Filters on the empty parts of the image
Initiation (E.1)
Definition of 3 x 3 and 5 x 5 Filters
The International Archives of the Photogrammetry, Remote Sensing and Spatial Information Sciences, Volume XLII-2/W17, 2019 6th International Workshop LowCost 3D – Sensors, Algorithms, Applications, 2–3 December 2019, Strasbourg, France
Figure 17. Image processing: (a): initial image, (b) : intermediary image, (c) : final image after treatments. The result is a 360° Virtual Image homogenised and enhanced to be as representative as possible of the reality.
Indeed, visual comfort is a very important factor in evaluating the results obtained. Nevertheless, this one criterion alone remains subjective. This is why tests where each time performed on the "Imagga" web platform over these results were properly interpreted, which is a second aspect to validate the designed processes.
2.3 Semantic enhancement
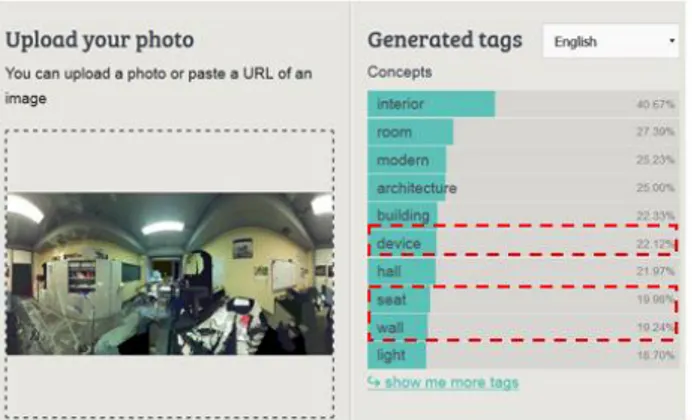
The last step consists in sending the image after processing to a web server API which has automatic categorization, extraction and advanced colour search tools using CNN techniques (Kubany et al., 2019)(“ImaggaAPI”). These algorithms are already trained, using a large image database, ready for a direct usage. The idea is to use the features of the "Requests" module to send the image to the server, analyse it and retrieve the recognition results in JSON format and only the best ten predictions are retained for semantic enrichment.
The information retained is reflected in the initial cloud (X, Y, Z) via the image to point cloud indexation. The application on our processed image earlier gives encouraging results. Since we find that the most probable prediction mentions "interior" and "room" which is the case in our image. In addition, there are the domains of "architecture" and "building" that properly identify the domain of this image. Indeed, when analysing all the results obtained, we can see that even certain parts of the image have been detected. We name here for example: "device", "seat" and "wall" which proves this statement (figure18).
These results illustrate the relevance of this program and the potential it has. However, there are certain criteria that determine the accuracy of predictions. We are mainly talking about two major criteria: the quality of the point cloud and the position of the camera. The denser the cloud is, the fewer empty pixels there will be then we will have less interpolation. The same applies to TLS scan data; the closer the camera position is to the scanner
position (from which the acquisition is made) , The less occlusion areas there would be which reduce the voids and that bring on enough interpolation and will, accordingly, enhance the results. The calculation time is about 1 minute / 638 579 points. However, this depends mainly on the machine's capabilities, since the processing consists of, in fact, paths through the image matrix, searching for empty pixels to fill them properly.
Figure 18. Image Recognition with the "Imagga" web interface.
Figure 19. Extract of the results obtained by our Algorithm.
3. RESULTS
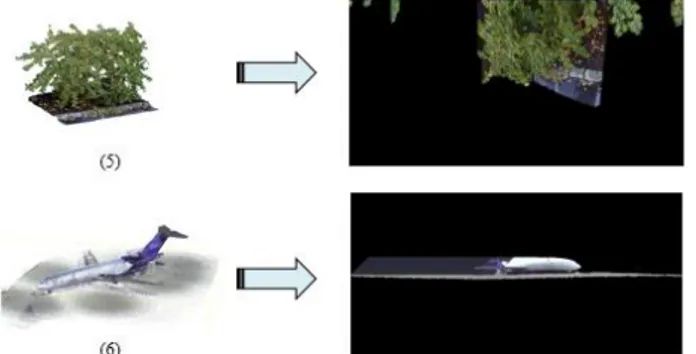
This section presents the results obtained by six point clouds. The first two cases were obtained thanks to survey missions carried out by the team of the geomatics unit at the university. The rest of the clouds were downloaded via the internet in order to have a significant sample of the different point clouds.
The International Archives of the Photogrammetry, Remote Sensing and Spatial Information Sciences, Volume XLII-2/W17, 2019 6th International Workshop LowCost 3D – Sensors, Algorithms, Applications, 2–3 December 2019, Strasbourg, France
Figure 20. Panoramic images of different Point clouds. Generally, the results obtained are suitable for the domain of the multiple point clouds tested. It should be remembered that the results are tied to the position of the camera. These predictions may change with other points of view and their accuracy as well. However, a generation of several images of different positions contain many of the same terms that are repeated.
Figure 21. Predictions for each cloud
4. DISCUSSIONS
The dozens of tests established in this study allow us to validate the principle of the approach developed. In other words, the semantic enrichment of a point cloud using panoramic views. This last point is the most important part of this new approach. Since the use of simple images creates a new problem of orientation. The predictions in this case change in each direction as illustrated in the figures 22 below which are renderings of the same point cloud in two opposite directions.
Figure 22. Different predictions for each direction. Certainly, the developed process is characterized by its simplicity and automation, but the algorithm does not escape certain imperfections. There are several aspects to be improved, including the question of the camera position, which is one of the important criteria for the identification phase by neural networks. An optimal choice of position also helps to minimize execution time, thus improving program efficiency.
Nevertheless, there are several recommendations to be taken into consideration either to use the algorithm properly or to refine this work towards more advanced research perspectives:
The International Archives of the Photogrammetry, Remote Sensing and Spatial Information Sciences, Volume XLII-2/W17, 2019 6th International Workshop LowCost 3D – Sensors, Algorithms, Applications, 2–3 December 2019, Strasbourg, France
1. The use of a software or algorithm to visualize the point clouds beforehand, in order to determine a suitable position, or to compute a suitable point of view
2. In studies subsequent to this work, it is strongly
recommended to use the option "training of custom tags or categories" in the Imagga platform to train it on this new type of "virtual" images, which could improve accuracy.
3. We can think of making a comparative study with other
developed platforms, namely: Microsoft's Computer Vision, TensorFlow, to determine the most suitable application for the panoramic images generated in our case.
4. Acculturation is also recommended on studies established
for the optimal choice of a position for the visualization of a 3D scene.
5. Finally, the integration of object detection technology (such
as SSDMobileNet) into this algorithm is a very interesting perspective. We move to a higher level that is the identification of objects in a panoramic view, and then give a classification to the set of points that correspond to it via the canonical link we have.
5. CONCLUSION
Finally, it is clarified that the goal of this work is to set up an automatic process that facilitates the addition of semantic information to the 3D point cloud while exploiting robust recognition algorithms in Photogrammetry. The algorithm developed offers a high flexibility to change several parameters (the projection adopted, the size and shape of the resulting image, the number of predictions to be taken into consideration, etc.). However, the importance of this study is due to the fact that it opens up several research perspectives in the field of semantic segmentation on a cloud of points.
Several research directions are drawn constituting a research agenda: improving classification algorithms; developing an optimization device for the choice of point of view to improve the results; integrating this solution with automatic navigation systems. This work is the subject of a domain-related approach by adopting a new perspective toward point cloud classification. Mainly, the addition of semantic information and domain detection from a raw 3D dataset can improve the accuracy of 3D segmentation algorithms as it identifies the scope of possibilities.
REFERENCES
Chen, Z., Wang, S., Hou, X., Shao, L., Org, L.S., 2018. Recurrent Transformer Networks for Remote Sensing Scene Categorisation.
Cheng, G., Han, J., Lu, X., 2017. Remote Sensing Image Scene Classification: Benchmark and State of the Art. Proc. IEEE 105, 1865–1883. https://doi.org/10.1109/JPROC.2017.2675998 David, S., 2006. Transformations and Projections in Computer Graphics, Science.
Guinard, S., Landrieu, L., Vallet, B., 2017. Pré-segmentation pour la classification faiblement supervisée de scènes urbaines à partir de nuages de points 3D LIDAR.
Kubany, A., Ben Ishay, S., Ohayon, R.-S., Shmilovici, A., Rokach, L., Doitshman, T., 2019. Semantic Comparison of State-of-the-Art Deep Learning Methods for Image Multi-Label Classification. arXiv Prepr. arXiv 1–10.
Morton, P., Douillard, B., Underwood, J., 2011. An evaluation of dynamic object tracking with 3D LIDAR. Proc. 2011 Australas.
Conf. Robot. Autom. 7–9.
Poux, F., 2019. The Smart Point Cloud: Structuring 3D intelligent point data. Liège.
Poux, F., Billen, R., 2019a. A Smart Point Cloud Infrastructure for intelligent environments, in: Lindenbergh, R., Belen, R. (Eds.), Laser Scanning: An Emerging Technology in Structural Engineering, ISPRS Book Series. Taylor & Francis Group/CRC Press, United States. https://doi.org/in generation
Poux, F., Billen, R., 2019b. Voxel-Based 3D Point Cloud Semantic Segmentation: Unsupervised Geometric and Relationship Featuring vs Deep Learning Methods. ISPRS Int. J. Geo-Information 8, 213. https://doi.org/10.3390/ijgi8050213 Poux, F., Hallot, P., Neuville, R., Billen, R., 2016. SMART POINT CLOUD: DEFINITION AND REMAINING CHALLENGES. ISPRS Ann. Photogramm. Remote Sens. Spat. Inf. Sci. IV-2/W1, 119–127. https://doi.org/10.5194/isprs-annals-IV-2-W1-119-2016
Poux, F., Neuville, R., Nys, G.-A., Billen, R., 2018. 3D Point Cloud Semantic Modelling: Integrated Framework for Indoor Spaces and Furniture. Remote Sens. 10, 1412. https://doi.org/10.3390/rs10091412
Poux, F., Neuville, R., Van Wersch, L., Nys, G.-A., Billen, R., 2017. 3D Point Clouds in Archaeology: Advances in Acquisition, Processing and Knowledge Integration Applied to Quasi-Planar
Objects. Geosciences 7, 96.
https://doi.org/10.3390/geosciences7040096
Wang, P., Gan, Y., Shui, P., Yu, F., Zhang, Y., Chen, S., Sun, Z., 2018. 3D Shape Segmentation via Shape Fully Convolutional Networks.
The International Archives of the Photogrammetry, Remote Sensing and Spatial Information Sciences, Volume XLII-2/W17, 2019 6th International Workshop LowCost 3D – Sensors, Algorithms, Applications, 2–3 December 2019, Strasbourg, France