Pépite | Modélisation expérimeentale des écoulements sanguins dans les artères
167
0
0
Texte intégral
(2) Thèse de Hesham Elkanani, Université de Lille, 2018. ©2018 Tous droits réservés.. lilliad.univ-lille.fr.
(3) Thèse de Hesham Elkanani, Université de Lille, 2018. Université de Lille 1 – Science et Technologies. Order number : 42588. Ecole Doctorale Science pour l’Ingénieure (EDSPI 72) Laboratoire De Mécanique de Lille (LML – FRE3723). Dissertation submitted for the degree of Doctor of Philosophy. Numerical and experimental modeling of blood flow in the arteries Hesham ELKANANI. Thesis defended the 19 January 2018 in front of jury:. Shahrour Isam. Professor. LML, Universite de Lille 1. President. Al-Bahkali Essam. Professor. King Saud University, KSA. Reviewer. Erchiqui Fouad. Professor. University of Quebec, Canada. Reviewer. Ozdemir Zuhal. Lecturer. The University of Scheifield, UK. Examiner. Naji Hassen. Professor. LML, Universite de Lille 1. Examiner. Souli Mhamed. Professor. LML, Universite de Lille 1. Supervisor. ©2018 Tous droits réservés.. lilliad.univ-lille.fr.
(4) Thèse de Hesham Elkanani, Université de Lille, 2018. ©2018 Tous droits réservés.. lilliad.univ-lille.fr.
(5) Thèse de Hesham Elkanani, Université de Lille, 2018. Université de Lille 1 – Science et Technologies. Numéro d’order : 42588. Ecole Doctorale Science pour l’Ingénieure (EDSPI 72) Laboratoire De Mécanique de Lille (LML – FRE3723). Thèse présentée devant l’Université de Lille 1 pour obtenir le grade de Docteur Spécialité : Mécanique par. Hesham ELKANANI. Modélisation expérimentale des écoulements sanguins dans les artères. Thèse soutenue le 19 Janvier 2018 devant le jury composé de :. Shahrour Isam. Professeur LML, Universite de Lille 1. Président du jury. Al-Bahkali Essam. Professeur Université King Saud, KSA. Rapporteur. Erchiqui Fouad. Professeur Université du Québec, Canada. Rapporteur. Ozdemir Zuhal. Lecturer. L'Université de Sheffield , UK. Examinateur. Naji Hassen. Professor. LML, Universite de Lille 1. Examinateur. Souli Mhamed. Professeur. LML, Université de Lille 1. Directeur de thèse. ©2018 Tous droits réservés.. lilliad.univ-lille.fr.
(6) Thèse de Hesham Elkanani, Université de Lille, 2018. ©2018 Tous droits réservés.. lilliad.univ-lille.fr.
(7) Thèse de Hesham Elkanani, Université de Lille, 2018. The Université Lille 1 – Science et Technologies neither endorse nor censure authors’ opinions expressed in the theses: these opinions must be considered to be those of their authors.. ©2018 Tous droits réservés.. lilliad.univ-lille.fr.
(8) Thèse de Hesham Elkanani, Université de Lille, 2018. ©2018 Tous droits réservés.. lilliad.univ-lille.fr.
(9) Thèse de Hesham Elkanani, Université de Lille, 2018. Keywords: blood flow, artery, pulse wave velocity (pwv), coupled eulerian lagrangian (cel), fluid structure interaction (fsi), smoothed particles hydrodynamics (sph), noise, vibration and harshness (nvh) Mots clés : flux sanguin, artère, vitesse de l'onde pulsée (pwv), couplage lagrangien eulérien (cel), interaction de la structure fluide (fsi), hydrodynamique des particules lissées, bruit, vibrations et dureté (nvh). ©2018 Tous droits réservés.. lilliad.univ-lille.fr.
(10) Thèse de Hesham Elkanani, Université de Lille, 2018. ©2018 Tous droits réservés.. lilliad.univ-lille.fr.
(11) Thèse de Hesham Elkanani, Université de Lille, 2018. This thesis has been prepared at:. Laboratoire de Mecanique de Lille FRE 3723 Av. Paul Langevin Cite Scientifique 59650 Villeneuve d’Ascq France (33)(0)3 20 33 71 52 (33)(0)3 20 33 71 53 [email protected] Web site http://www.univ-lille1.fr/. ©2018 Tous droits réservés.. lilliad.univ-lille.fr.
(12) Thèse de Hesham Elkanani, Université de Lille, 2018. ©2018 Tous droits réservés.. lilliad.univ-lille.fr.
(13) Thèse de Hesham Elkanani, Université de Lille, 2018. Abstract. xiii. Art is science made clear. Wilson Mizner. Science is organized knowledge. Wisdom is organized life. Immanuel Kant. Science without religion is lame, religion without science is blind. Albert Einstein. The science of today is the technology of tomorrow. Edward Teller. ©2018 Tous droits réservés.. lilliad.univ-lille.fr.
(14) Thèse de Hesham Elkanani, Université de Lille, 2018. Abstract. xiv. ©2018 Tous droits réservés.. lilliad.univ-lille.fr.
(15) Thèse de Hesham Elkanani, Université de Lille, 2018. Abstract. xv. Numerical and experimental modeling of blood flow in the arteries. Abstract The aim of this thesis is to investigate blood flow in arteries using Fluid-Structure Interaction (FSI) numerical approach. There are different approaches which could be used, Finite Element (FE) method for modelling artery wall and either FE or Smoothed Particles Hydrodynamic (SPH) method for blood modeling. In biomedical applications there are very few experimental data accessible in the literatures. In order to investigate the appropriate numerical method to solve our biomedical problem, we apply both FE and SPH methods in well-known applications where the experimental data are available. The first application was Noise, Vibration and Harshness (NVH) and random vibration fatigue analysis of both landing gear of unmanned aerial vehicle and pre-stressed airplane seat tube, where we apply FE method to estimate the life time of the proposed applications. Those are two projects where we published two journal papers and three conference papers as listed in Appendix (A). The aim of those two projects is to validate our fatigue life estimation method to be apply on biomedical problems such as plaque rupture and arteries’ valves fatigue life. Due to time restriction we considered those applications as a future work. We apply SPH method in investigate the membrane inflation application where the experiment data are available and we got promising results and hence draw some conclusions. From that study we published one journal paper and one conference paper (Appendix A). Finally, we use Coupled Eulorian Lagrangian (CEL) approach for investigation of Pulse Wave Velocity (PWV) in large arteries where we compare our results with both the theoretical theory and previous work published in the literatures. From this study we conclude the significant parameters affecting both the accuracy and the computational cost where we published a journal paper (Appendix A). This thesis follows the practices gathered from the mentioned simulation problems. Those practices draw the conclusion about the best practice for modeling blood flow in arteries. This conclusion is that FE method is the most suitable method for modeling blood as it uses less number of elements comparing with SPH method which needs more number of particles and hence more computation time. Keywords: blood flow, artery, pulse wave velocity (pwv), coupled eulerian lagrangian (cel), fluid structure interaction (fsi), smoothed particles hydrodynamics (sph), noise, vibration and harshness (nvh). Laboratoire de Mecanique de Lille FRE 3723 Av. Paul Langevin - Cite Scientifique - 59650 Villeneuve d’Ascq - France ©2018 Tous droits réservés.. lilliad.univ-lille.fr.
(16) Thèse de Hesham Elkanani, Université de Lille, 2018. Résumé. xvi. Modélisation expérimentale des écoulements sanguins dans les artères. Résumé Le but de cette thèse est d'étudier le flux sanguin dans les artères en utilisant l'approche numérique par interaction fluide-structure (FSI). Il existe différentes approches qui pourraient être utilisées, la méthode des éléments finis (FE) pour modéliser la paroi artérielle et FE ou la méthode hydrodynamique de particules lissées (SPH) pour la modélisation du sang. Dans les applications biomédicales, il existe très peu de données expérimentales accessibles dans les littératures. Afin d'étudier la méthode numérique appropriée pour résoudre notre problème biomédical, nous appliquons les méthodes FE et SPH dans des applications bien connues où les données expérimentales sont disponibles. La première application était le bruit, la vibration et la dureté (NVH) et l'analyse aléatoire de la fatigue vibratoire du train d'atterrissage d'un véhicule aérien sans pilote et d'un tube de siège d'avion précontraint où nous appliquons la méthode FE pour estimer la durée de vie des applications proposées. Il s'agit de deux projets dans lesquels nous avons publié deux documents de journal et trois documents de conférence qui figurent à l'annexe (A). Le but de ces deux projets est de valider notre méthode d'estimation de la durée de vie de la fatigue à appliquer à des problèmes biomédicaux tels que la rupture de la plaque et la durée de vie de la fatigue des valves artérielles. En raison de la restriction de temps, nous avons considéré ces applications comme un travail futur. Nous appliquons la méthode SPH dans l'étude de l'application de l'inflation membranaire où les données expérimentales sont disponibles et nous avons obtenu des résultats prometteurs et donc tirer quelques conclusions. À partir de cette étude, nous avons publié un journal et un document de conférence (annexe A). Enfin, nous utilisons l'approche couplée Eulorian Lagrangian (CEL) pour l'étude de la vélocité de l'onde de pulsation (PWV) dans les grandes artères où nous comparons nos résultats avec la théorie et les travaux précédents publiés dans les littératures. À partir de cette étude, nous concluons les paramètres significatifs affectant à la fois l'exactitude et le coût de calcul où nous avons publié un journal (Annexe A). Cette thèse suit les pratiques issues des problèmes de simulation mentionnés. Ces pratiques tirent la conclusion sur les meilleures pratiques pour modéliser le flux sanguin dans les artères. Cette conclusion est que la méthode FE est la méthode la plus appropriée pour modéliser le sang car elle utilise moins de nombre d'éléments en comparaison avec la méthode SPH qui nécessite plus de nombre de particules et donc plus de temps de calcul. Mots clés : flux sanguin, artère, vitesse de l'onde pulsée (pwv), couplage lagrangien eulérien (cel), interaction de la structure fluide (fsi), hydrodynamique des particules lissées, bruit, vibrations et dureté (nvh). ©2018 Tous droits réservés.. lilliad.univ-lille.fr.
(17) Thèse de Hesham Elkanani, Université de Lille, 2018. Acknowledgements I would like to express my deepest gratitude to Prof. M’Hamed Souli, my thesis supervisor, and Prof. Essam Al-Bahkali for all their guidance, continuous encouragement and support during the preparation of this thesis. My sincere gratitude is also due to my advisory committee, Prof. Isam Shahrour, Prof. Hassen Naji, Prof. Fouad Erchiqui and Dr. Zuhal Ozdemir for having accepted to be examiners of my thesis. Without support of my dear friend Dr. Mohamed Amdi, I could not overcome any difficulty in my hard times. His kind assistance during the registration and re-registration every year is gratefully acknowledged. I would like to thank my wife Noha for her love, continuous help and patience. She always gives me the reason to live and progress. Heartfelt thanks are also due to my older sun Eng. Ahmed for his endless and invaluable morale support. No words can express my appreciation and gratitude to my family.. xvii. lilliad.univ-lille.fr.
(18) Thèse de Hesham Elkanani, Université de Lille, 2018. Acknowledgements. xviii. ©2018 Tous droits réservés.. lilliad.univ-lille.fr.
(19) Thèse de Hesham Elkanani, Université de Lille, 2018. Contents Abstract. xv . Résumé. xvi . Acknowledgements. xvii . Contents. xix . List of Tables. xxi . List of Figures. xxiii . Introduction. 1 . 1 . Chapter 1. 12 . 2 . Chapter 2. 45 . 3 . Chapter 3. 71 . 4 . Conclusion and Perspective. 113 . 5 . Bibliography. 116 . 6 . Appendix A: List of the Published Papers. 128 . 7 . Appendix B: List of Elements Conversion Keyword Code. 130 . 8 . Appendix C: Letter of Appreciation. 136 . 9 . Table of Contents. 137 . xix. lilliad.univ-lille.fr.
(20) Thèse de Hesham Elkanani, Université de Lille, 2018. Contents. xx. ©2018 Tous droits réservés.. lilliad.univ-lille.fr.
(21) Thèse de Hesham Elkanani, Université de Lille, 2018. List of Tables. xxi. List of Tables Table 2-1 Properties of air used in the simulation ............................................................ 60 Table 2-2 Mesh details report ........................................................................................... 64 Table 3-1 Life time values obtained using different theoretical methods ........................ 76 Table 3-2 Fatigue life obtained by the numerical predictions methods used in LS-DYNA® ......................................................................................................................................... 108 . ©2018 Tous droits réservés.. lilliad.univ-lille.fr.
(22) Thèse de Hesham Elkanani, Université de Lille, 2018. List of Tables. xxii. ©2018 Tous droits réservés.. lilliad.univ-lille.fr.
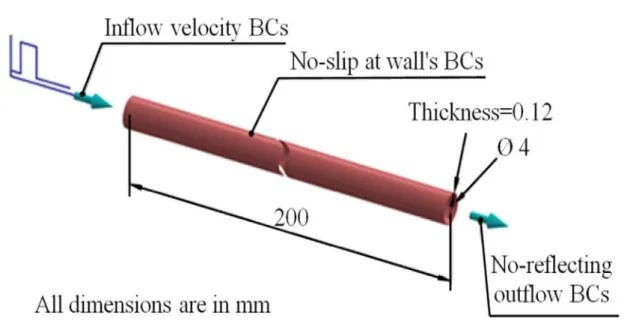
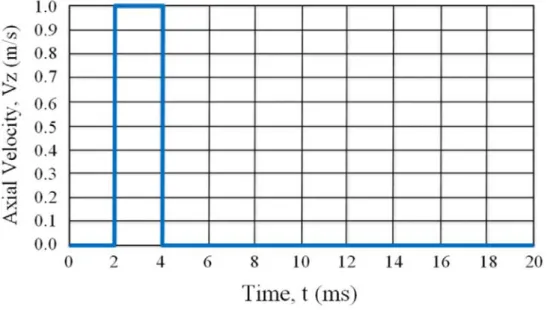
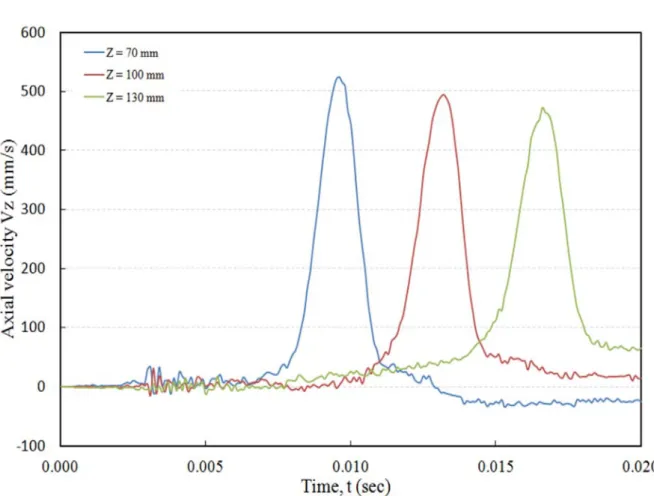
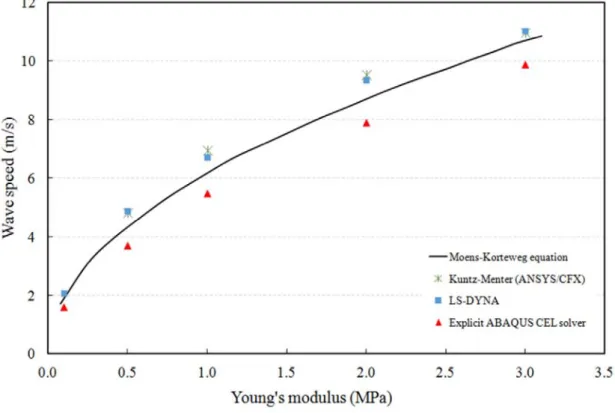
(23) Thèse de Hesham Elkanani, Université de Lille, 2018. List of Figures Figure 1-1 Genesis of pressure pulses: after the opening of the aortic valve the pulse propagates through the aorta exchanging energy between the aortic wall and the blood flow. Adapted from [19]. .................................................................................................. 15 Figure 1-2 Geometrical and mass model of a volume of blood moving along an artery. R: arterial radius, dx: arterial length, P: influx pressure, P+dP: outflux pressure, Q: influx blood flow, Q+dQ: outflux blood flow, V: blood velocity, τ: wall shear stress, and ρ: blood density. .................................................................................................................... 17 Figure 1-3 Biomechanical model of the arterial wall. R: internal arterial radius, h: thickness, dx: segment length, σθ: wall circumferential stress, and P: arterial pressure. .. 20 Figure 1-4 The dependency of PWV with age for central elastic arteries (dashed line) and peripheral muscular arteries (continuous line). Adapted from [19]. ................................. 24 Figure 1-5 Consequences of increased arterial stiffness on central blood pressure: increase of systolic and decrease of diastolic central pressures. Pulsatile Pressure is defined as the difference of both pressure amplitudes. PPn stands for PP under normal condition. .......................................................................................................................... 25 Figure 1-6 Vicious circle of events resulting from endothelial dysfunction and augmented arterial stiffness. ................................................................................................................ 25 Figure 1-7 This double oblique view of the thoracic aorta from a magnetic resonance angiogram (MRA) (A) is used to show five slices from which aortic mean velocity waveforms are derived from a flow sensitive MR imaging sequence. (B) From the five velocity waveforms a temporal shift can be appreciated as the aorta is traversed. This shift can be used to compute the pulse wave velocity either regionally, for example from any two of these waveforms, or globally, using all of the waveforms. Note that maximum velocity decreases progressively at downstream slice locations; maximum velocity decreases for a number of reasons, including resistance to flow and loss of flow volume. xxiii. lilliad.univ-lille.fr.
(24) Thèse de Hesham Elkanani, Université de Lille, 2018. List of Figures. xxiv. from vessels branching from the aorta. The 5 flow waveforms in (B) are derived from the 5 slices in (A). [30] ........................................................................................................... 27 Figure 1-8 Sampling an aortic pressure waveform at 80 ms (A), 40 ms (B), 20 ms (C), and 10 ms (D) as compared to sampling at 1 ms. These high temporal resolution 1 ms data were acquired in the aorta of a pig with a fiber optic intravascular pressure sensor. For (A), (B), and (C) the waveform was downsampled to demonstrate that the shape of the waveform is highly dependent on adequate sampling of the data. [3] ........................ 30 Figure 1-9 The long elastic tube model and boundary conditions .................................... 32 Figure 1-10 Meshed parts of the model ............................................................................ 34 Figure 1-11 Inlet boundary conditions, a velocity pulse in the axial direction................. 34 Figure 1-12 : Three different time frames of the radial disturbance of the tube wall due to wave propagation. The displacement of the structure has been magnified by factor of 5. The unit of the scale is mm. .............................................................................................. 36 Figure 1-13 Axial velocity waveforms at different locations along the tube center line for artery with Young’s modulus of 3.0 MPa. ........................................................................ 38 Figure 1-14 Arrival time for two progressive waveforms indicated by foot-to-foot method............................................................................................................................... 39 Figure 1-15 Model with Young’s modulus, E = 3.0 MPa: (a) 3D mesh plot of the wall radial deflection against temporal and spatial coordinates. It shows the peaks of the forward waves. (b) 2D contour plot of the wall radial deflection. The slope of the peaks regression line indicates the PWV. ................................................................................... 40 Figure 1-16 PWV as function of young’s modulus: comparison of numerical results and idealized theory. ................................................................................................................ 41 Figure 1-17 Effect of ageing on elastic properties of arteries, incremental Young's modulus plotted against age for normal human aorta at a pressure of 100 mm Hg [37]. . 42 Figure 1-18 Normal values for PWV (average according to age (1455 subjects), boxes contain 50% of the data and bars contain the remainder; horizontal lines indicate medians) [38] plotted with the corresponding values obtained from our approach. ........ 43 Figure 2-1 - Lagrangian and Advection phases in multi-material ALE formulation ....... 52 Figure 2-2 FEM model, mesh and nodes (left) and SPH model, particles (right) ............ 54 Figure 2-3 Kernel Function and its support domain for a 2D function ............................ 55 . ©2018 Tous droits réservés.. lilliad.univ-lille.fr.
(25) Thèse de Hesham Elkanani, Université de Lille, 2018. List of Figures. xxv. Figure 2-4 Description of Penalty Coupling Algorithm ................................................... 57 Figure 2-5 Description of Penalty Contact algorithm between slave particle and master structure............................................................................................................................. 58 Figure 2-6 Test rig used in the experiment ....................................................................... 59 Figure 2-7 The model used for membrane inflation simulation ....................................... 61 Figure 2-8 Bubble height evolution with various values for α ......................................... 62 Figure 2-9 Element conversion ......................................................................................... 63 Figure 2-10 Internally generated particles per parent element illustrated for three particles per isoparametric direction (Courtesy of Dassault Systèmes) [36] .................................. 63 Figure 2-11 Initial air particles distribution at t = 0 s. ...................................................... 65 Figure 2-12 Fluid material and structure displacement at t = 0.3 s .................................. 65 Figure 2-13 Fluid material and structure displacement at t = 0.6 s .................................. 66 Figure 2-14 - Bubble height time evolution for two different EOS for air comparing with experimental data. ............................................................................................................. 67 Figure 2-15 Bubble height time evolution with different mesh resolution comparing with experimental data .............................................................................................................. 68 Figure 2-16 Equivalent pressure stress for a sample of elements represent the air .......... 69 Figure 2-17 Bubble height time evolution for C01=115590 Pa obtained with ALE method ........................................................................................................................................... 69 Figure 3-1 Finite element model used in the study ........................................................... 74 Figure 3-2 Beam on the shaker table. ............................................................................... 75 Figure 3-3 The shaker test was conducted virtually in the work space of nCode DesignLife......................................................................................................................... 76 Figure 3-4 Vibration engine parameters ........................................................................... 77 Figure 3-5 Material data editor ......................................................................................... 78 Figure 3-6 Spectral analysis of the stationary random response....................................... 88 Figure 3-7 Frequency domain methods and their common applications .......................... 89 Figure 3-8 Description of Penalty Contact algorithm between slave node and master node ........................................................................................................................................... 94 Figure 3-9 Seat Support Tube (SST) ................................................................................ 95 Figure 3-10 S-N fatigue curve used for the SST material ................................................ 96 . ©2018 Tous droits réservés.. lilliad.univ-lille.fr.
(26) Thèse de Hesham Elkanani, Université de Lille, 2018. List of Figures. xxvi. Figure 3-11 Finite element model of the SST................................................................... 97 Figure 3-12 Uniform pressure load applied to the SST. ................................................... 97 Figure 3-13 Propeller aircraft vibration exposure............................................................. 98 Figure 3-14 Input acceleration PSD.................................................................................. 99 Figure 3-15 Stress PSD at critical point.......................................................................... 100 Figure 3-16 (a) Cumulative damage ratio by Dirlik method and (b) the broken SST. ... 101 Figure 3-17 Geometry details of the landing gear (all dimensions are in millimeter) .... 103 Figure 3-18 Landing gear................................................................................................ 104 Figure 3-19 Input acceleration PSD................................................................................ 105 Figure 3-20 S-N fatigue curve used for the landing gear material ................................. 106 Figure 3-21 Stress PSD at critical point.......................................................................... 108 Figure 3-22 Cumulative damage ratio by Dirlik method ................................................ 109 Figure 3-23 RMS of Sx stress at the critical point using Dirlik method ......................... 109 Figure 3-24 Life vs landing gear’s leg thickness ............................................................ 110 . ©2018 Tous droits réservés.. lilliad.univ-lille.fr.
(27) Thèse de Hesham Elkanani, Université de Lille, 2018. List of Figures. xxvii. ©2018 Tous droits réservés.. lilliad.univ-lille.fr.
(28) Thèse de Hesham Elkanani, Université de Lille, 2018. Introduction Context Fluid Structure Interaction (FSI) has become more and more the focus of computational engineering in many problems. These problems are computer time consuming and require new stable and accurate coupling algorithms in order to be solved. Over the last few decades, both the new development of coupling algorithms and the advancement of computer performance have enabled some of the problems to be solved and have led to more physical problems that were inaccessible in the past. In the future this trend is likely to continue and to take more realistic problems into account such that those found in many medical applications specially blood flow in arteries. The aim of this thesis is to investigate blood flow in arteries using FSI numerical approach. There are different approaches which could be used, Finite Element (FE) method for modelling artery wall and either FE method or Smoothed Particles Hydrodynamic (SPH) method for blood modeling. In biomedical applications there are very few experimental data accessible in the literatures. In order to investigate the appropriate numerical method to solve our biomedical problem, we apply both FE and SPH methods in well-known applications where the experimental data are available. The first application was Noise, Vibration and Harshness (NVH) and random vibration fatigue analysis of a notched aluminum beam. The second one is a pre-stressed airplane seat tube. The third one is landing gear of unmanned aerial vehicle, where we apply FE method to estimate the life time of the proposed applications. The last two applications are two projects where we published one ISI paper, with two citations till now, one SCOPUS paper and three conference papers as listed in Appendix (A). The aim of those two projects is to validate our fatigue life estimation method to be applied on biomedical problems such as plaque rupture and arteries’ valves fatigue life. Due to time restriction we considered those. 1. lilliad.univ-lille.fr.
(29) Thèse de Hesham Elkanani, Université de Lille, 2018. Introduction. 2. applications as a future work. We apply SPH method for investigating the membrane inflation application where the experiment data are available and we got promising results and hence draw some conclusions. From this study, we published an ISI journal paper. Finally, we use Coupled Eulorian Lagrangian (CEL) approach for investigating Pulse Wave Velocity (PWV) of blood flow in large arteries where we validate our results with the theoretical theory, previous work done with different finite elements commercial packages and in vivo data published in the literatures. From this study, we conclude the significant parameters affecting both the accuracy and the computational cost where we published an ISI journal paper (Appendix A). This thesis follows the practices gathered from the mentioned simulation problems that simulated using Abaqus®, nCode DesignLife® and LS-DYNA® finite element commercial packages. Those practices draw the conclusion about the best practice for modeling blood flow in arteries. This conclusion is that FE method is the most suitable method for modeling blood as it uses less number of elements comparing with SPH method which needs more number of particles and hence more computation time. The following collaboration projects supported this thesis: . Numerical Investigation of Pulse Wave Propagation in Arteries Using Fluid Structure Interaction Capabilities, King Saud University, Deanship of Scientific Research, College of Engineering Research Center.. . Experimental and numerical investigation for membrane deployment using SPH and ALE formulations, King Saud University, Deanship of Scientific Research, College of Engineering Research Center.. . Failure and fatigue life estimate of a pre-stressed aircraft seat support tube, King Saud University, Deanship of Scientific Research, College of Engineering Research Center.. . NVH and Random Vibration Fatigue Analysis of a Landing Gear’s Leg for an UnManned Aerial Vehicle Using Modal Analysis, King Saud University, Deanship of Scientific Research, College of Engineering Research Center.. ©2018 Tous droits réservés.. lilliad.univ-lille.fr.
(30) Thèse de Hesham Elkanani, Université de Lille, 2018. Introduction. 3. State of the Art Pulse Wave Velocity (PWV) PWV is the rate at which a pressure wave propagates along a blood vessel. It is inversely related to vascular compliance and clinicians are considered it as an indication of human blood vessels’ stiffness. The computation of PWV with magnetic resonance imaging (MRI) was first discussed in 1989 [1]. Renewed interest facilitated by faster and more robust MR imaging sequences has led to a recent rapid increase in reported studies with MRI-based PWV measurements. The differences between gold standard, clinical standard, and MRI-based measurements must be understood in the context of global versus regional PWV measurements. The pulse wave can be understood as a wave superimposed on the flow/pressure waveform of the blood. This superimposed pulse wave accelerates and decelerates as it traverses distally in the vasculature relative to the stiffness of the vessel in a given vascular segment. With some of the methods described below, PWV is evaluated regionally in a small area of the vasculature [for example, computing PWV from the temporal shift between two subsequent velocity waveforms. As a result, this PWV measurement is subject to sampling error, such that the area of evaluation could be in a region of stiffness, giving an elevated PWV, or the area of evaluation could be in an area of less stiffness, giving a lower PWV. If a vessel is heterogeneous in stiffness, a PWV measurement could be erroneous depending on the area selected for evaluating PWV. Some methods of computing PWV, including applanation tonometry, Doppler ultrasound and some MRI-based methods, evaluate PWV globally over a very large region of the vasculature [for example, computing PWV from the temporal shift amongst a series of velocity waveforms. While global PWV measurements are minimally prone to sampling bias, areas of stiffness and elevated PWV will be averaged with normal areas of the vasculature. This averaging suppresses differences between individuals with a healthy vasculature and individuals with sporadic areas of stiffness.. ©2018 Tous droits réservés.. lilliad.univ-lille.fr.
(31) Thèse de Hesham Elkanani, Université de Lille, 2018. Introduction. 4. The gold standard of measuring PWV is via the use of flow meters or catheter-based pressure probes. Both pressure and flow waveforms within the vasculature can be used to detect the superimposed pulse wave. While these methods provide highly accurate measurements of PWV, the invasiveness involved in placing them intravascularly limits their use to animal studies or to patients otherwise undergoing cardiac catheterization. Fiber optic probes can be used to measure pressure waveforms. Simultaneous data collection from two probes with a known distance between them are needed to measure PWV, such that the temporal shift between the two pressure waveforms can be used to compute PWV in the region between the tips of the two probes. Fiber optic probes use a Fabry-Perot. interferometer. configuration. [2]. and. transmit. pressure. via. a. microelectromechanical system (MEMS), which houses a diaphragm that deflects in proportion to the amount of strain imparted on it. The pressure sensors contain temperature and pressure resistors. The pressure resistor is a strain gauge attached to a membrane that deforms under pressure; the measurements are corrected via measurements with the temperature resistor. The outer diameter of these pressure probes is often less than 0.5 mm, which minimizes flow disturbances created by their presence within the vasculature. The pressure probes can be inserted with minimal invasiveness via an arterial cut down. PWV also can be measured with transit-time ultrasound flow meters [3]. These flow meters are placed perivascularly and use an ultrasonic wave to measure flow. Within a given flow meter one ultrasonic wave is transmitted with the direction of flow and another wave is transmitted against the direction of flow. The difference in transit time between the upstream and downstream ultrasonic waves is directly proportional to the velocity of blood within a vessel. Regional PWV could be computed by noting the temporal shift between the flow waveforms of two ultrasonic flow meters separated by a known distance. This distance would need to be measured in vivo with a measuring tape after the flow meters are placed surgically. It may be difficult to measure accurately the separation distance, particularly if the distance between the two flow meters is large and the vessel is tortuous. The greater invasiveness needed to place the ultrasound flow meters perivascularly is a disadvantage of this method relative to the pressure probes. ©2018 Tous droits réservés.. lilliad.univ-lille.fr.
(32) Thèse de Hesham Elkanani, Université de Lille, 2018. Introduction. 5. Both the pressure probes and the ultrasonic flow meters provide a number of advantages that allow for highly accurate PWV measurements. The pressure probes have a high sampling rate, on the order of 100-2,000 Hz. While the two probes can be separated by a substantial distance for global PWV measurements, the high temporal resolution of these probes allows for the assessment of regional PWV. For example, if a subject’s PWV is on the order of 10 m/s, and the sampling rate is 1,000 Hz, the two probes need to be separated by as little as 1 cm. Ultrasonic flow meters provide yet higher sampling rates, on the order of >1 MHz. There is effectively no minimum separation distance needed between two ultrasonic flow meters for computing PWV. Another advantage of the high temporal resolution provided by the pressure probes and ultrasonic flow meters is that pressure and flow waveforms are measured in real-time, and thus numerous cardiac cycles can be obtained in a few seconds. A PWV measurement can be obtained for every cardiac cycle, and thus averaged over all cardiac cycles, to account for any variability in PWV. A final advantage of both the fiber optic pressure probes and ultrasonic flow meters is that they can be made MR-compatible; these methods therefore allow for the direct validation of MRI-based PWV measurements.. Smoothed Particles Hydrodynamic Method (SPH) “SPH provides a fascinating tool that has some of the properties of molecular dynamics while retaining the attributes of the macroscopic equations of continuum mechanics.” J. J. Monaghan [48]. The majority of state-of-the-art simulation tools for continuum mechanics relate to meshbased Finite-Volume (FV) or Finite-Element (FE) solvers. Such traditional grid-based numerical methods provide a good predictive accuracy and can be applied to a wide range of engineering problems. However, these approaches have limitations, especially if it comes to applications that involve: large relative motions, multiple interacting rigid structures, multiple phases and continua, complex free surface flows, large deformations, and fragmentation of solids.. ©2018 Tous droits réservés.. lilliad.univ-lille.fr.
(33) Thèse de Hesham Elkanani, Université de Lille, 2018. Introduction. 6. Contrary to this, mesh-free methods solve the governing equations without a rigid alignment to grid structures or discrete topologies. That way, many of the above mentioned drawbacks of mesh-based procedures can easily be overcome. Several mesh-free techniques have been developed in the last decades; good summaries are given e.g. in a review paper of Belytschko et al. [49], the PhD thesis of Chaniotis [50] and the book of Liu [6]. Some of the formulations still incorporate grids as necessary ingredients of the numerical method. On the contrary, Smoothed-Particle-Hydrodynamics (SPH) can be considered a truly mesh-free approach. In SPH, the continuum is descritised by set of finite particles that can arbitrarily move. By using an interpolation technique known as reproducing kernel approximation, field values can be approximated at a certain point as a weighted average over a set of nearby particles. The method was originally developed in 1977 independently by Lucy [51] and Gingold and Monaghan [52] to study cosmological problems. Since then, it has considerably matured [48], [53], [54] and was successfully used to study problems from a large variety of disciplines. Its highly diverse range of applications has recently been extended to marine, hydraulic, geoenvironmental and geotechnical engineering problems. Published examples include, but are not limited to, general free-surface flows [55], ship dynamics [56], landslide simulations [57], [58] reservoir flushing [59], flood simulations [60] or embankment failures [61], [62]. The SPH method developed originally for solving astrophysics problem has been extended to solid mechanics by Libersky et al. [63] to model problems involving large deformation including high velocity impact. SPH method provides many advantages in modeling severe deformation as compared to classical FEM formulation which suffers from high mesh distortion. The method was first introduced by Lucy [64] and Gingold and Monaghan [65] for gas dynamic problems and for problems where the main concern is a set of discrete physical particles than the continuum media. The method was extended to solve high velocity impact in solid mechanics, CFD applications governed by Navier-Stokes equations and fluid structure interaction problems.. ©2018 Tous droits réservés.. lilliad.univ-lille.fr.
(34) Thèse de Hesham Elkanani, Université de Lille, 2018. Introduction. 7. It is well known from previous papers, that SPH method suffers from lack of consistency, that can lead to poor accuracy of motion approximation. Unlike Finite Element, interpolation in SPH method cannot reproduce constant and linear functions.. NVH and Random Vibration Analysis Most real fatigue loadings are random processes in respect of frequency and stress amplitude. Estimating fatigue damage with Power Spectrum Density (PSD) was first proposed by Rice [76] in 1954. The stress power spectra density (PSD) represents the frequency domain approach input into the fatigue. This is a scalar function that describes how the power of the time signal is distributed among frequencies [77]. Mathematically this function can be obtained by using a Fourier transform of the stress time history’s autocorrelation function, and its area represents the signal’s standard deviation. It is clear that PSD is the most complete and concise representation of a random process [78]. Finite element analysis is very efficient in taking the PSD of applied loads and determining the PSD of the resulting stresses at various points in the structure. A method of taking the PSD of stress and calculating fatigue lives therefore has attractions. Much of the early work on fatigue analysis from PSD’s was carried out by NASA in order to determine the fatigue damage caused by vibration and buffeting of space vehicles. Finite element analysis is very efficient in taking the Power Spectral Density (PSD) of applied loads and determining the PSD of the resulting stresses at various points in the structure. A method of taking the PSD of stress and calculating fatigue lives therefore has attractions. Random response linear dynamic analysis is used to predict the response of a structure subjected to a nondeterministic continuous excitation that is expressed in a statistical sense by a cross-spectral density (CSD) matrix. The random response procedure uses the set of eigenmodes extracted in a previous eigenfrequency step to calculate the corresponding power spectral densities (PSD) of response variables (stresses, strains, displacements, etc.) and, hence—if required—the variance and root mean square values of these same. ©2018 Tous droits réservés.. lilliad.univ-lille.fr.
(35) Thèse de Hesham Elkanani, Université de Lille, 2018. Introduction. 8. variables. This section provides brief definitions and explanations of the terms used in this type of analysis based on the book by Clough and Penzien [80]. Examples of random response analysis are the study of the response of an airplane to turbulence; the response of a car to road surface imperfections; the response of a structure to noise, such as the “jet noise” emitted by a jet engine; and the response of a building to an earthquake.. ©2018 Tous droits réservés.. lilliad.univ-lille.fr.
(36) Thèse de Hesham Elkanani, Université de Lille, 2018. Introduction. 9. ©2018 Tous droits réservés.. lilliad.univ-lille.fr.
(37) Thèse de Hesham Elkanani, Université de Lille, 2018. Introduction. 10. Thesis objectives and development The objectives of this thesis are as follows: . Investigation and implementation a reliable model for PWV assessment in arteries.. . Validation of SPH, ALE, FSI and CEL methods in Abaqus®.. . Validation of fatigue life time estimation in LS-DYNA® and nCode DesignLifeV coupled Abaqus®.. Chapter 1 presents a reliable computational scheme to serve in pulse wave velocity (PWV) assessment in large arteries. In this investigation, the simulation of PWV was conducted using a three-dimension elastic tube representing an artery. The constitutive material model specific for vascular applications was applied to the tube material. The fluid was defined with an equation of state representing the blood material. The onset of a velocity pulse was applied at the tube inlet to produce wave propagation. The Coupled Eulerian−Lagrangian (CEL) modeling technique with fluid-structure interaction (FSI) was implemented. The scaling of sound speed and its effect on results and computing time is discussed. Two methods were used to assist the PWV measurement.. In chapter 2, we present experimental and numerical investigation for membrane deployment using SPH and ALE formulations. The new formulations SPH method (Smooth Particle Hydrodynamic), which have been developed for FSI applications using mesh free methods, is introduced. The mathematical and numerical implementation of the ALE and SPH formulations are, also, described in this chapter. To validate the statement, we perform a simulation of membrane deployment generated by high pressurized gas.. In chapter 3, Noise, Vibration, and Harshness (NVH) study is applied to three case studies: fatigue life prediction of a notched aluminium beam using Abaqus® and nCode DesignLife®, fatigue life estimate of a pre-stressed aircraft seat support tube and fatigue life estimate of landing gear's leg. In this study we investigate the effect of pre-stresses on modal analysis and demonstrate different methods used for life time estimation. A notched. ©2018 Tous droits réservés.. lilliad.univ-lille.fr.
(38) Thèse de Hesham Elkanani, Université de Lille, 2018. Introduction. 11. aluminum beam is considered as a benchmark for many literatures [4] where the experimental data and results obtained using other commercial codes are available. So, it was selected as a first case study in order to test our approach for random vibration analysis and fatigue life prediction.. ©2018 Tous droits réservés.. lilliad.univ-lille.fr.
(39) Thèse de Hesham Elkanani, Université de Lille, 2018. 1. 1Chapter Chapter 1. Numerical Investigation of Pulse Wave Propagation in Arteries Using Fluid Structure Interaction Capabilities Partly adapted from postprint version of:. Numerical Investigation of Pulse Wave Propagation in Arteries Using Fluid Structure Interaction Capabilities Hisham Elkenani1, Essam Al-Bahkali1 and Mhamed Souli2 1. Department of Mechanical Engineering, King Saud University, P.O. Box 800, Riyadh. 11421, Saudi Arabia 2. Laboratoire de Mécanique de Lille, UMR CNRS 8107, Villeneuve-d’Ascq, France. Published in: Computational and Mathematical Methods in Medicine Volume 2017, Article ID 4198095, Pages 1-12, 2017 https://doi.org/10.1155/2017/4198095. 12. lilliad.univ-lille.fr.
(40) Thèse de Hesham Elkanani, Université de Lille, 2018. Chapter 1 1.1 Introduction. 13. In this chapter, we present a reliable computational scheme to serve in pulse wave velocity (PWV) assessment in large arteries. PWV is the rate at which a pressure wave propagates along a blood vessel. It is inversely related to vascular compliance and clinicians are considered it as an indication of human blood vessels’ stiffness. In this investigation, the simulation of PWV was conducted using a three-dimension elastic tube representing an artery. The constitutive material model specific for vascular applications was applied to the tube material. The fluid was defined with an equation of state representing the blood material. The onset of a velocity pulse was applied at the tube inlet to produce wave propagation. The Coupled Eulerian−Lagrangian (CEL) modeling technique with fluidstructure interaction (FSI) was implemented. The scaling of sound speed and its effect on results and computing time is discussed, and we concluded that a value of 60 m/s was suitable for simulating vascular biomechanical problems. Two methods were used to assist the PWV measurement: foot-to-foot measurement of velocity waveforms and slope of the regression line of the wall radial-deflection wave peaks throughout a contour plot. Both methods showed coincident results. Results were approximately 6% less than those calculated from the Moens−Korteweg equation, which describes the PWV in elastic tubes. The proposed method was able to describe the increase in the stiffness of the walls of large human arteries via the PWV estimates.. 1.1 Introduction Computational analysis of cardiovascular problems incorporating FSI is a challenging problem. Detailed analysis of the blood flow field and artery wall behavior can assist in clinicians’ assessment of vascular diseases [5]. The first person to investigate a formula for the velocity of pressure waves in a thin elastic tube was Young [6] in 1808. Womersley [7] investigated the dynamic response of a tube with a sinusoidal flow and defined an analytical solution for the flow domain. In this study, we investigated the propagation of a pulse wave through an elastic vessel. This application is of clinical relevance as PWV measurements are currently considered to be the clinical gold standard measure of arterial stiffness [8]. PWV is typically a. ©2018 Tous droits réservés.. lilliad.univ-lille.fr.
(41) Thèse de Hesham Elkanani, Université de Lille, 2018. Chapter 1 1.1 Introduction. 14. disturbance’s propagation speed through a vessel resulting from the flow pressure. As blood is an almost-incompressible fluid [9] [10] [11], the finite PWV is mainly the result of the FSI between the local pressure of the blood on the vessel wall and the resultant wall deformation it causes. To validate the obtained results, we used the same model used by Kuntz et al. [12] and Penrose et al. [13] who validated their simulation, conducted with ANSYS-CFX commercial software, with the theoretical results obtained by the Moens−Korteweg equation [14]. Moatamedi et al. [15] and Souli et al. [16] used the same model in their study and validated their simulation, conducted with LS-DYNA commercial package, with those obtained from the Moens−Korteweg equation. Shahmirzadi et al. [17] validated their work conducted with ABAQUS explicit solver with the Moens−Korteweg equation, but they used a different model. Fukui et al. [18] implemented their model using the commercial code Radioss (Altair Engineering) to investigate the effect of both elasticity and wall thickness on PWV through a long elastic tube. Because PWV techniques will be at the center of this thesis’ medical application, a comprehensive analysis of the phenomena and clinical and technical implications of measuring PWV is now provided. Section 1.1 initiates the discussion with a formal definition of the PWV parameter. Section 1.2 provides theoretical evidence on the relationship between PWV and arterial stiffness. Section 1.3 studies clinical aspects and applications of PWV, going from the non‐invasive assessment of arterial stiffness to the generation of cardiovascular risk factor markers. Section 1.4 provides a comprehensive summary of the state of the art in PWV measuring techniques. The subsequent sections demonstrate the numerical model and validation of the obtained results with both theoretical theory and in vivo data.. 1.1.1. Definition of Pulse wave velocity. In cardiovascular research and clinical practice, PWV refers to the velocity of pressure pulses that propagate along the arterial tree. In particular, one is interested in those pressure pulses generated during left ventricular ejection: at the opening of the aortic valve, the sudden rise of aortic pressure is absorbed by the elastic aorta walls. Subsequently a pulse. ©2018 Tous droits réservés.. lilliad.univ-lille.fr.
(42) Thèse de Hesham Elkanani, Université de Lille, 2018. Chapter 1 1.1 Introduction. 15. wave naturally propagates along the aorta exchanging energy between the aortic wall and the aortic blood flow (Figure 1-1).. Systole. Initially, the pressure pulse is absorbed by the elastic arterial wall. Diastole. Energy is then exchanged between the arterial wall and the blood flow. Figure 1-1 Genesis of pressure pulses: after the opening of the aortic valve the pulse propagates through the aorta exchanging energy between the aortic wall and the blood flow. Adapted from [19]. At each arterial bifurcation, a fraction of the energy is transmitted to the following arteries, while a portion is reflected backwards. Note that one can easily palpate the arrival of arterial pressure pulses at any superficial artery, such as the temporal, carotid or radial artery: already in the year 1500, traditional Chinese medicine performed clinical diagnosis by palpating the arrival of pressure pulses at the radial artery [20]. But why do clinicians nowadays gather interest in the velocity of such pulses, and especially in the aorta? The reason is that the velocity of propagation of aortic pressure pulses depends on the elastic and geometric properties of the aortic wall. We will show later that while arterial stiffness is difficult to measure non‐invasively, PWV is nowadays available in vivo to clinicians. Hence, the PWV parameter is an easily‐accessible potential surrogate for the constitutive properties of the arterial wall.. ©2018 Tous droits réservés.. lilliad.univ-lille.fr.
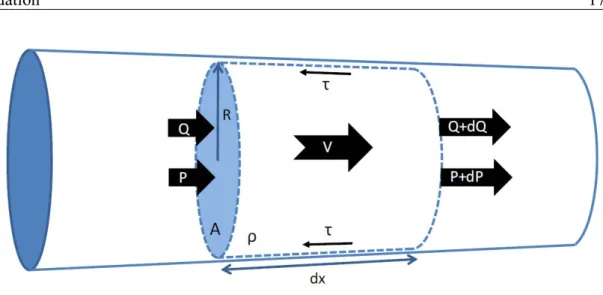
(43) Thèse de Hesham Elkanani, Université de Lille, 2018. Chapter 1 1.2 Pulse wave velocity and stiffness: the Moens‐Korteweg equation. 16. 1.2 Pulse wave velocity and stiffness: the Moens‐Korteweg equation It has already been stated that modifications of the biomechanical properties of the arterial wall will induce changes at the velocity at which pressure pulses travel along it. The goal of the current section is to provide a simple mathematical model supporting this relationship. In particular, the proposed model [21] aims at establishing the relationship between PWV and biomechanical characteristics such as wall stiffness, wall thickness and arterial diameter via the commonly‐known Moens‐Korteweg equation. The derivation of the equation relies on a mass model of a volume of blood moving through an arterial segment (Figure 1-2), as well as on a model of the biomechanics of the arterial wall (Figure 1-3). Both models assume that the volume of blood V induces a flow Q while undergoing a pressure P. The geometry of the models is defined by an arterial length dx, an internal arterial radius R, a constant internal area A, and an arterial wall thickness h. Blood density is assumed to be ρ, wall shear stress τ, and wall circumferential stress σθ. The Moens‐Korteweg derivation startthe law of mass conservation, i.e.: . ( 1-1 ). 0. ©2018 Tous droits réservés.. lilliad.univ-lille.fr.
(44) Thèse de Hesham Elkanani, Université de Lille, 2018. Chapter 1 1.2 Pulse wave velocity and stiffness: the Moens‐Korteweg equation. 17. . Figure 1-2 Geometrical and mass model of a volume of blood moving along an artery. R: arterial radius, dx: arterial length, P: influx pressure, P+dP: outflux pressure, Q: influx blood flow, Q+dQ: outflux blood flow, V: blood velocity, τ: wall shear stress, and ρ: blood density.. Imposing as well the law of momentum conservation (Newton’s law) one obtains:. 2. 2. 2. . ( 1-2 ). Assuming now wall shear stress (friction) to be negligible, and assuming A to be constant along dx (compared to V) Eq. 1-2 becomes:. ©2018 Tous droits réservés.. lilliad.univ-lille.fr.
(45) Thèse de Hesham Elkanani, Université de Lille, 2018. Chapter 1 1.2 Pulse wave velocity and stiffness: the Moens‐Korteweg equation. 18. ( 1-3 ). We define now arterial compliance to be expression of Eq. 1-1, and assuming . . Recalling the mass conservation. to be constant in time, one obtains:. 0. . 0 ( 1-4 ). . . . . 0. 0. We rewrite now the momentum conservation expression of Eq.1-3 in order to contain the. term as well, assuming A to be a constant arterial section: ( 1-5 ). ©2018 Tous droits réservés.. lilliad.univ-lille.fr.
(46) Thèse de Hesham Elkanani, Université de Lille, 2018. Chapter 1 1.2 Pulse wave velocity and stiffness: the Moens‐Korteweg equation. 19. Finally including the modified momentum expression of Eq. 1-5 into the modified mass expression of Eq.1-4, one obtains the following wave equation:. ( 1-6 ). Therefore, according to the proposed model, a pressure wave. ,. travels along an. arterial segment obeying a wave equation, i.e.. ( 1-7 ). with a propagation speed determined by:. ( 1-8 ). The propagation speed of a pressure pulse travelling along an artery is thus expected to be inversely related to the arterial compliance, i.e. the more compliant the artery the slower the pulse will propagate. Eq. 1-8 is known as Bramwell‐Hill equation [22]. Developing further the definition of arterial compliance one obtains:. . 2. ( 1-9 ). ©2018 Tous droits réservés.. lilliad.univ-lille.fr.
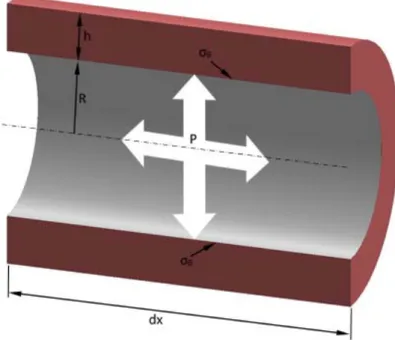
(47) Thèse de Hesham Elkanani, Université de Lille, 2018. Chapter 1 1.2 Pulse wave velocity and stiffness: the Moens‐Korteweg equation. 20. . Figure 1-3 Biomechanical model of the arterial wall. R: internal arterial radius, h: thickness, dx: segment length, σθ: wall circumferential stress, and P: arterial pressure.. And by inserting Eq.1-9 into the Eq. 1-8 a modified Bramwell‐Hill equation is obtained:. ( 1-10 ). 2. Unfortunately, both the Bramwell‐Hill equation and its modified version are unable to predict the propagation speed of pressure pulses along an artery from the stiffness of its wall. In the following we aim at expressing the term. appearing in the modified. Bramwell‐Hill equation as a function of the wall Young’s modulus. Based on the arterial wall biomechanical model proposed by Figure 1-3, we start by applying the momentum conservation law to all tangential components:. ©2018 Tous droits réservés.. lilliad.univ-lille.fr.
(48) Thèse de Hesham Elkanani, Université de Lille, 2018. Chapter 1 1.2 Pulse wave velocity and stiffness: the Moens‐Korteweg equation. 21. 0 2. 2. 0. ( 1-11 ). obtaining the so‐called Laplace law. By differentiating Eq. 1-11 one obtains:. ( 1-12 ). Assuming the arterial wall to be incompressible and thin, i.e.. ≪ ,. 2 ( 1-13 ). one obtains a differenced Laplace law in the form:. 2. ( 1-14 ). At this point, we recall the concept of Young’s elastic modulus and we aim at introducing it into Eq. 1-14. The Young’s elastic modulus describes the measured arterial wall stress (. ) when a given strain ( ) is applied to it, i.e.:. ( 1-15 ) Merging now the geometrical description of the arterial wall (Eq. 1-14) together with the introduced biomechanical variable of Eq. 1-15, one obtains:. 2 ( 1-16 ) 2. Assuming now the. term to be negligible, one obtains the searched relationship between. and Young’s modulus of the arterial wall:. ©2018 Tous droits réservés.. lilliad.univ-lille.fr.
(49) Thèse de Hesham Elkanani, Université de Lille, 2018. Chapter 1 1.3 Clinical Aspects of Pulse Wave Velocity. 22. ( 1-17 ). Finally introducing the Young’s modulus expression of Eq. 1-17 into the modified Bramwell‐Hill expression of Eq. 1-10, one obtains the so‐called Moens‐Korteweg equation:. PWV. ( 1-18 ). 2. Accordingly, the speed of propagation of a pressure pulse along the arterial wall depends on: . the biomechanics properties of the wall: and in particular its stiffness. or. Young’s modulus, . the geometry of the wall, and in particular its thickness h and radius R,. . and the density of blood.. Even though the derivation of the Moens‐Korteweg model relies on several (and severe) simplifications, it provides an intuitive insight on the propagation phenomenon in arteries predicting that the stiffer the artery (increased. ) the faster a pressure pulse will. propagate along it. Therefore, for large elastic arteries such the aorta where the thickness to radius ratio is almost invariable, PWV is expected to carry relevant information related to arterial stiffness.. 1.3 Clinical Aspects of Pulse Wave Velocity Recall that the present thesis aims at exploiting PWV as a technique to non‐invasively and non‐occlusively measure blood pressure. Nevertheless, it is of capital importance to understand the clinical context in which PWV techniques have been historically developed. Therefore, this section reviews the clinical aspects and implications of PWV measurements, and in particular, in relation to the assessment of arterial stiffness. Cardiovascular disease is the leading cause of morbidity and mortality in western countries and is associated with changes in the arterial structure and function. It is today generally. ©2018 Tous droits réservés.. lilliad.univ-lille.fr.
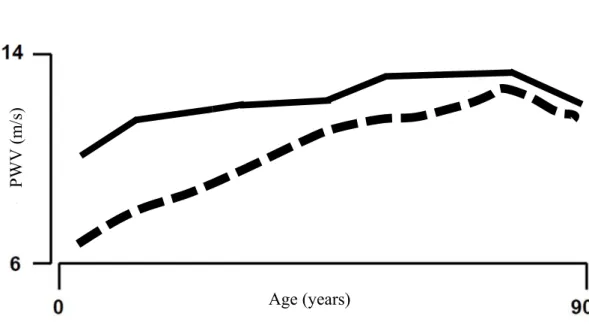
(50) Thèse de Hesham Elkanani, Université de Lille, 2018. Chapter 1 1.3 Clinical Aspects of Pulse Wave Velocity. 23. accepted that arterial stiffening has a central role in the development of such diseases. Aortic PWV is considered the gold standard for the assessment of arterial stiffness and is one of the most robust parameters for the prediction of cardiovascular events [23]. Because the structure of the arterial wall differs between the central (elastic) and the peripheral (muscular) arteries, several PWV values are encountered along the arterial tree, with increasing stiffness when moving to the periphery. Because carotid‐to‐femoral PWV is considered as the standard measurement of aortic arterial stiffness, we will refer to it as simply PWV. In the following we review the most important factors determining PWV of elastic arteries, we analyze the pathophysiological consequences of increased arterial stiffness and, we highlight the clinical relevance of PWV as an independent marker of cardiovascular risk.. 1.3.1 Major determinants of Pulse Wave Velocity Before elucidating the role that PWV plays in the generation and diagnosis of pathological situations, it is necessary to understand which are its determinant factors under normal conditions. It is currently accepted that the four major determinants of PWV are age, blood pressure, gender and heart rate. Age affects the wall properties of central elastic arteries (aorta, carotid, iliac) in a different manner than in muscular arteries (brachial, radial, femoral, popliteal). With increasing age the pulsatile strain breaks the elastic fibers, which are replaced by collagen [24]. These changes in the arterial structure lead to increased arterial stiffness, and consequently to increased central PWV (Figure 1-4). On the other hand, there is only little alteration of distensibility of the muscular, i.e. distal, arteries with age [23], [25]. This fact supports the use of generalized transfer functions to calculate the central aortic pressure wave from the radial pressure wave in adults of all ages.. ©2018 Tous droits réservés.. lilliad.univ-lille.fr.
(51) Thèse de Hesham Elkanani, Université de Lille, 2018. 24. PWV (m/s). Chapter 1 1.3 Clinical Aspects of Pulse Wave Velocity. Age (years) Figure 1-4 The dependency of PWV with age for central elastic arteries (dashed line) and peripheral muscular arteries (continuous line). Adapted from [19].. Arterial blood pressure is also a major determinant of PWV. Increased blood pressure is associated with increased arterial stiffness and vice versa. Ejection of blood into the aorta generates a pressure wave that travels along the whole arterial vascular tree. A reflected wave that travels backwards to the ascending aorta is principally generated in the small peripheral resistance arterioles. With increasing arterial stiffness, both the forward and the reflected waves propagate more rapidly along the vessels. Consequently, instead of reaching back the aorta during the diastole, the reflected pulse wave reaches it during the systole. This results in an increase of aortic pressure during systole and reduced pressure during diastole, thus leading to an increase of the so‐called Pulsatile Pulse (PP) parameter (Figure 1-5). Asmar studied large untreated populations of normotensive and hypertensive subjects and found that the two major determinants of PWV were age and systolic blood pressure in both groups [22]. This result confirms the close interdependence between systolic blood pressure and arterial stiffness.. ©2018 Tous droits réservés.. lilliad.univ-lille.fr.
(52) Thèse de Hesham Elkanani, Université de Lille, 2018. Chapter 1 1.3 Clinical Aspects of Pulse Wave Velocity. 25. Figure 1-5 Consequences of increased arterial stiffness on central blood pressure: increase of systolic and decrease of diastolic central pressures. Pulsatile Pressure is defined as the difference of both pressure amplitudes. PPn stands for PP under normal condition.. Figure 1-6 Vicious circle of events resulting from endothelial dysfunction and augmented arterial stiffness.. ©2018 Tous droits réservés.. lilliad.univ-lille.fr.
(53) Thèse de Hesham Elkanani, Université de Lille, 2018. Chapter 1 1.4 The State of the Art in PWV Measuring Techniques. 26. Concerning gender, studies in children revealed no gender difference in PWV, whereas in young and middle age, healthy adult men displayed higher PWV values compared to women [26], [27]. Indeed premenopausal women show lower carotid‐radial PWV values than age matched men, but carotid‐femoral PWV is found to be similar. Once women become postmenopausal, PWV values become similar to those of age‐matched men [26]. Heart rate is related to PWV through two independent mechanisms. Firstly, heart rate influences PWV because of the frequency‐dependant viscoelasticity of the arterial wall: if heart rate increases, the time allowed to the vessels to distend is reduced, resulting in an increased rigidity of the arterial wall. Hence, increasing rate is associated with increasing arterial stiffness. In a recent study [28], it was showed that particularly in hypertensive patients increased heart rate was one of the major determinants of accelerated progression of arterial stiffness. Secondly, heart rate is related to PWV through the influence of the sympathetic nervous system: sympathetic activation is associated with increased stiffness of the arteries [29] due to an increase in heart rate, blood pressure and smooth muscle cells tonus.. 1.4 The State of the Art in PWV Measuring Techniques The computation of PWV with magnetic resonance imaging (MRI) was first discussed in 1989 [1]. Renewed interest facilitated by faster and more robust MR imaging sequences has led to a recent rapid increase in reported studies with MRI-based PWV measurements. The purpose of this review is to summarize and synthesize the state-of-the-art in MRIbased PWV measurements. In addition, both gold standard and clinical standard methods of computing PWV will be reviewed briefly. The differences between gold standard, clinical standard, and MRI-based measurements must be understood in the context of global versus regional PWV measurements (Figure 1-7). The pulse wave can be understood as a wave superimposed on the flow/pressure waveform of the blood. This superimposed pulse wave accelerates and decelerates as it traverses distally in the vasculature relative to the stiffness of the vessel in a given vascular segment. With some of the methods described below, PWV is evaluated regionally in a small area of the vasculature [for example, computing PWV from the temporal shift ©2018 Tous droits réservés.. lilliad.univ-lille.fr.
(54) Thèse de Hesham Elkanani, Université de Lille, 2018. Chapter 1 1.4 The State of the Art in PWV Measuring Techniques. 27. between two subsequent velocity waveforms (Figure 1-7B). As a result, this PWV measurement is subject to sampling error, such that the area of evaluation could be in a region of stiffness, giving an elevated PWV, or the area of evaluation could be in an area of less stiffness, giving a lower PWV. If a vessel is heterogeneous in stiffness, a PWV measurement could be erroneous depending on the area selected for evaluating PWV. Some methods of computing PWV, including applanation tonometry, Doppler ultrasound and some MRI-based methods, evaluate PWV globally over a very large region of the vasculature [for example, computing PWV from the temporal shift amongst a series of velocity waveforms (Figure 1-7B). While global PWV measurements are minimally prone to sampling bias, areas of stiffness and elevated PWV will be averaged with normal areas of the vasculature. This averaging suppresses differences between individuals with a healthy vasculature and individuals with sporadic areas of stiffness.. Figure 1-7 This double oblique view of the thoracic aorta from a magnetic resonance angiogram (MRA) (A) is used to show five slices from which aortic mean velocity waveforms are derived from a flow sensitive MR imaging sequence. (B) From the five velocity waveforms a temporal shift can be appreciated as the aorta is traversed. This shift can be used to compute the pulse wave velocity either regionally, for example from any two of these waveforms, or globally, using all of the waveforms. Note that maximum velocity decreases progressively at downstream slice locations; maximum velocity decreases for a number of reasons, including resistance to flow and loss of flow volume from vessels branching from the aorta. The 5 flow waveforms in (B) are derived from the 5 slices in (A). [30]. ©2018 Tous droits réservés.. lilliad.univ-lille.fr.
(55) Thèse de Hesham Elkanani, Université de Lille, 2018. Chapter 1 1.5 Gold Standard Measurements of Pulse Wave Velocity. 28. 1.5 Gold Standard Measurements of Pulse Wave Velocity The gold standard of measuring PWV is via the use of flow meters or catheter-based pressure probes. Both pressure and flow waveforms within the vasculature can be used to detect the superimposed pulse wave. While these methods provide highly accurate measurements of PWV, the invasiveness involved in placing them intravascularly limits their use to animal studies or to patients otherwise undergoing cardiac catheterization. Fiber optic probes can be used to measure pressure waveforms. Simultaneous data collection from two probes with a known distance between them are needed to measure PWV, such that the temporal shift between the two pressure waveforms can be used to compute PWV in the region between the tips of the two probes. Fiber optic probes use a Fabry-Perot. interferometer. configuration. [2]. and. transmit. pressure. via. a. microelectromechanical system (MEMS), which houses a diaphragm that deflects in proportion to the amount of strain imparted on it. The pressure sensors contain temperature and pressure resistors. The pressure resistor is a strain gauge attached to a membrane that deforms under pressure; the measurements are corrected via measurements with the temperature resistor. The outer diameter of these pressure probes is often less than 0.5 mm, which minimizes flow disturbances created by their presence within the vasculature. The pressure probes can be inserted with minimal invasiveness via an arterial cut down. PWV also can be measured with transit-time ultrasound flow meters [3]. These flow meters are placed perivascularly and use an ultrasonic wave to measure flow. Within a given flow meter one ultrasonic wave is transmitted with the direction of flow and another wave is transmitted against the direction of flow. The difference in transit time between the upstream and downstream ultrasonic waves is directly proportional to the velocity of blood within a vessel. Regional PWV could be computed by noting the temporal shift between the flow waveforms of two ultrasonic flow meters separated by a known distance. This distance would need to be measured in vivo with a measuring tape after the flow meters are placed surgically. It may be difficult to measure accurately the separation distance, particularly if the distance between the two flow meters is large and the vessel is tortuous.. ©2018 Tous droits réservés.. lilliad.univ-lille.fr.
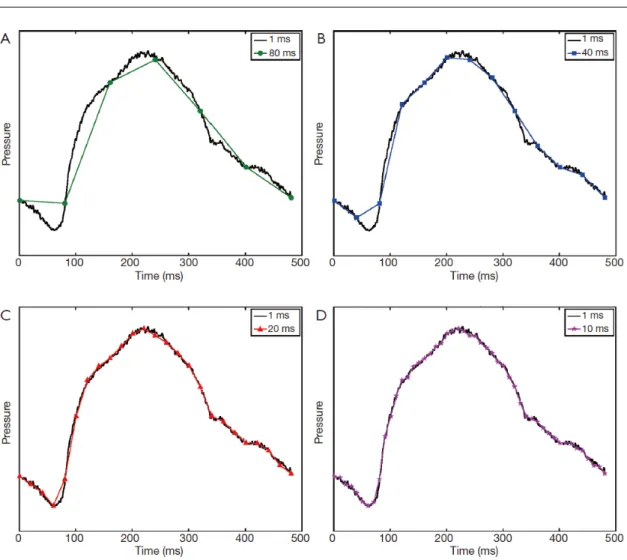
(56) Thèse de Hesham Elkanani, Université de Lille, 2018. Chapter 1 1.5 Gold Standard Measurements of Pulse Wave Velocity. 29. The greater invasiveness needed to place the ultrasound flow meters perivascularly is a disadvantage of this method relative to the pressure probes. Both the pressure probes and the ultrasonic flow meters provide a number of advantages that allow for highly accurate PWV measurements. The pressure probes have a high sampling rate, on the order of 100-2,000 Hz. While the two probes can be separated by a substantial distance for global PWV measurements, the high temporal resolution of these probes allows for the assessment of regional PWV. For example, if a subject’s PWV is on the order of 10 m/s, and the sampling rate is 1,000 Hz, the two probes need to be separated by as little as 1 cm. Ultrasonic flow meters provide yet higher sampling rates, on the order of >1 MHz. There is effectively no minimum separation distance needed between two ultrasonic flow meters for computing PWV. Another advantage of the high temporal resolution provided by the pressure probes and ultrasonic flow meters is that pressure and flow waveforms are measured in real-time, and thus numerous cardiac cycles can be obtained in a few seconds. A PWV measurement can be obtained for every cardiac cycle, and thus averaged over all cardiac cycles, to account for any variability in PWV. A final advantage of both the fiber optic pressure probes and ultrasonic flow meters is that they can be made MR-compatible; these methods therefore allow for the direct validation of MRI-based PWV measurements. The above methods provide high temporal resolution such that the shape of the pressure or velocity/flow waveform can be accurately depicted. On the other hand, sampling at lower temporal resolution can substantially change the shape of the waveform (Figure 1-8). As discussed below, PWV is computed from MR data using various characteristics of the waveform, such as the peak and foot of the waveform. As the temporal distance between sampling points becomes greater, the discretization error increases and there is a greater likelihood that these waveform characteristics will be misrepresented, leading to inaccurate PWV measurements.. ©2018 Tous droits réservés.. lilliad.univ-lille.fr.
(57) Thèse de Hesham Elkanani, Université de Lille, 2018. Chapter 1 1.6 Flow in an Elastic Vessel. 30. Figure 1-8 Sampling an aortic pressure waveform at 80 ms (A), 40 ms (B), 20 ms (C), and 10 ms (D) as compared to sampling at 1 ms. These high temporal resolution 1 ms data were acquired in the aorta of a pig with a fiber optic intravascular pressure sensor. For (A), (B), and (C) the waveform was downsampled to demonstrate that the shape of the waveform is highly dependent on adequate sampling of the data. [3]. 1.6 Flow in an Elastic Vessel The transient progression of a pressure pulse through a tube has been investigated by many researchers over the years. A good review of this research is available [31]. The first work on wave propagation in an elastic tube was presented by Moens and Korteweg at the end of the 19th century [14]. It is based on Newton’s work on the speed of sound in air. Taking E as the wall’s Young’s Modulus, h as the thickness of the wall, R as the inner radius, and ρ is the fluid density, and relating the change in radius to the applied pressure, the wave ©2018 Tous droits réservés.. lilliad.univ-lille.fr.
Figure
+7

![Figure 1-18 Normal values for PWV (average according to age (1455 subjects), boxes contain 50% of the data and bars contain the remainder; horizontal lines indicate medians) [38] plotted with the corresponding values obtained from our approach](https://thumb-eu.123doks.com/thumbv2/123doknet/3648460.107620/70.892.134.764.310.657/according-subjects-remainder-horizontal-indicate-corresponding-obtained-approach.webp)
Documents relatifs