1 2 3 4 5 6 7 8 9 10 11 12 13 14 15 16 17 18 19 20 21 22 23 24 25 26 27 28 29 30 31 32 33 34 35 36 37 38 39 40 41 42 43 44 45 46 47 48 49 50 51 52 53 54 55 56 57 58 59 60 61 62
Inflamm‐aging does not simply reflect increases in pro‐inflammatory markers
1Vincent Morrisette‐Thomasa, Alan A. Cohena*, Tamàs Fülöpb, Éléonore Riescoc, Véronique Legaulta, Qing Lia, 2
Emmanuel Milota, Françis Dusseault‐Bélangera, Luigi Ferruccid 3 4 a Groupe de recherche PRIMUS, Department of Family Medicine, University of Sherbrooke, CHUS‐Fleurimont, 5 3001 12eAvenue North, Sherbrooke, QC, J1H 5N4, Canada 6 7 b Research Center on Aging, Department of medecine, University of Sherbrooke, CSSS‐IUGS, 1036 rue Belvédère 8 Sud, Sherbrooke, QC, J1H 4C4, Canada 9 10 cResearch Center on Aging, CSSS‐IUGS, and Faculty of Physical education and sport, Department of 11 Kinanthropology, University of Sherbrooke, Sherbrooke, Canada. 12 13 d Laboratory of Clinical Epidemiology, Italian National Research Council on Aging Geriatric Department, 14 Florence, Italy. 15 16 *Corresponding author: Alan.Cohen@USherbrooke.ca, (819) 346‐1110 x12589, (819) 820‐6419 (fax) 17 Word count: 4600; 5 Tables; 5 Figures; 30 References 18 19
3 4 5 6 7 8 9 10 11 12 13 14 15 16 17 18 19 20 21 22 23 24 25 26 27 28 29 30 31 32 33 34 35 36 37 38 39 40 41 42 43 44 45 46 47 48 49 50 51 52 53 54 55 56 57 58 59 60 61
Abstract
20Many biodemographic studies use biomarkers of inflammation to understand or predict chronic disease and 21
aging. Inflamm‐aging, i.e. chronic low‐grade inflammation during aging, is commonly characterized by pro‐ 22
inflammatory biomarkers. However, most studies use just one marker at a time, sometimes leading to 23
conflicting results due to complex interactions among the markers. A multidimensional approach allows a more 24
robust interpretation of the various relationships between the markers. We applied principal components 25
analysis (PCA) to 19 inflammatory biomarkers from the InCHIANTI study. We identified a clear, stable structure 26
among the markers, with the first axis explaining inflammatory activation (both pro‐ and anti‐inflammatory 27
markers loaded strongly and positively) and the second axis innate immune response. The first but not the 28
second axis was strongly correlated with age (r=0.56, p<0.0001, r=0.08 p>0.05), and both were strongly 29
predictive of mortality (hazard ratios (95% CI): 1.33 (1.16‐1.53) and 0.87 (0.76‐0.98) respectively) and multiple 30
chronic diseases, but in opposite directions. Both axes were more predictive than any individual markers for 31
baseline chronic diseases and mortality. These results show that PCA is able to uncover a novel biological 32
structure in the relationships among inflammatory markers, and that the key axes of this structure play 33 important roles in chronic disease. 34 35
Highlights
36 ►The main axis of variation indicates a more activated (but not necessarily more inflamed) system. 37 ►A second key axis, undescribed until now, describes innate immune activation. 38 ►Multivariate analyses provide a better understanding of changes in inflammation among the elderly. 39 ►The main axis has biological impacts on chronic diseases and mortality. 40 ►Key axes of variation in inflammatory markers are associated with health outcomes independently of age. 41 42Abbreviations
43 PCA, Principle component analysis; PCA1, First principal axis; PCA2, Second principal axis; OR, Odds ratio; HR, 44 Hazard ratio; AIC, Akaike information criterion; hsCRP, High sensitivity C‐reactive protein; IFN‐ɤ, Interferon‐ ɤ; 45IL, Interleukin; MCP, Monocyte chemoattractant protein‐1; MIP, Macrophage inflammatory protein‐1b; 46
SGP130, Soluble glycoprotein 130; TNF‐α, Tumor necrosis factor‐alpha; STNF‐R, Soluble TNF receptor; TGF, 47 Transforming growth factor; TRAIL, TNF‐related apoptosis‐inducing ligand 48
Keywords
49 Inflammation; Biomarker; Multivariate; Aging; Chronic disease 503 4 5 6 7 8 9 10 11 12 13 14 15 16 17 18 19 20 21 22 23 24 25 26 27 28 29 30 31 32 33 34 35 36 37 38 39 40 41 42 43 44 45 46 47 48 49 50 51 52 53 54 55 56 57 58 59 60 61 62
1. Introduction
5152 Inflammation is known to be important in aging and age‐related diseases, including heart disease (Strandberg& 53 Tilvis, 2000), diabetes (Barzilay et al., 2001), cancer (Il'yasova et al., 2005), and Alzheimer’s disease (Akiyama et 54 al., 2000), among others, and is sometimes suggested as a principal aging mechanism (Finch, 2010). We often 55
refer to this phenomenon as “inflamm‐aging” (Franceschi et al., 2000) to indicate a chronic low‐grade 56 inflammation
that occurs with advancing age. It is provoked by a continuous antigenic load and stress, with the 57 persistence of inflammatory stimuli over time representing a biological background creating a predisposition to 58 age‐related diseases/ disabilities. Most epidemiological studies of inflammation have relied on a single marker 59 as a measure of inflammatory state, often C‐reactive protein (CRP) (Strandberg& Tilvis, 2000), interleukin‐6 (IL‐ 60
6) (Bruunsgaard, 2002), or tumor necrosis factor‐alpha (TNF‐α) (Bruunsgaard et al., 1999). However, as the 61
inflammatory system is known to be complex and involve multiple feedback mechanisms, focusing on only one 62
inflammatory marker may explain conflicting results observed in the literature (Scheller, Chalaris, Schmidt‐ 63
Arras, & Rose‐John, 2011; Yudkin, Kumari, Humphries, & Mohamed‐Ali, 2000). In one of the few studies to take 64
a multivariate approach, Bandeen‐Roche et al. (Bandeen‐Roche, Walston, Huang, Semba, & Ferrucci, 2009) 65
showed that a single axis of variation was not sufficient to summarize seven common markers, and that there 66
appear to be separate up‐ and down‐regulation components to the system (i.e. a simultaneous increases or 67
decreases of multiple biomarkers to regulate the system at a higher or lower levels of activity). Accordingly, 68
multivariate approaches can contradict the need to incorporate multiple markers. 69
While many of the direct regulatory relationships among inflammatory markers are known (Cesari et al., 2004; 70
Hansson, 2005; Singh& Newman, 2011; Tracy, 2002), this information cannot always be translated into an 71
understanding of how markers co‐vary in populations or across long timescales, and thus of how to interpret 72
different inflammatory profiles in a clinical or public health context. An understanding of the multivariate 73
relationships among inflammatory markers thus has the potential to provide clinically relevant interpretations 74
of changing inflammatory markers, and to help understand the underlying (unobservable) biological processes 75
that govern organisation of the inflammatory system at longer timescales. Our goal was to identify stable 76
groups of key inflammatory markers through multivariate tools that provide a better understanding of changes 77
in inflammation system during aging. 78
Here, we applied principal components analysis (PCA) to a set of 19 inflammatory biomarkers in InCHIANTI 79
database, a cohort of mostly elderly Italians (Ferrucci et al., 2000). PCA identifies key “axes” that summarize 80
the ways in which individuals differ across the ensemble of variables (Jolliffe, 2005). The axes are expressed as 81
linear combinations of the original variables and the coefficients can thus be used to arrive at a biological 82
3 4 5 6 7 8 9 10 11 12 13 14 15 16 17 18 19 20 21 22 23 24 25 26 27 28 29 30 31 32 33 34 35 36 37 38 39 40 41 42 43 44 45 46 47 48 49 50 51 52 53 54 55 56 57 58 59 60 61 interpretation of each axis. PCA is a multivariate, data‐driven approach that lets the data speak for themselves; 83
a related method, factor analysis, tests the correspondence between the axes and a priori hypotheses. We 84
opted for PCA in this case because we were not certain that there was a sufficient understanding of 85
inflammatory system function and feedback mechanisms at time scales of years to generate robust a priori 86
hypotheses. Axes identified through PCA were validated using population subsets as independent samples, and 87
scores on these axes were then tested for associations with health outcomes, including mortality, and 13 88
chronic diseases (Cohen et al., 2010; Dusseault‐Belanger, Cohen, Hivert, Courteau, & Vanasse, 2013). Our 89
results do not support simple increases in inflammation with age, but it is possible to identify key axes of 90 variation in inflammatory markers that predict health outcomes independently of age. 91 92
2. Methods
93 942.1 Data
95This study uses data from “Invecchiare in Chianti” (Aging in the Chianti area, InCHIANTI), a prospective 96
population‐based study of the elderly, developed by the Laboratory of Clinical Epidemiology of the Council of 97
Italian National Research on Aging (INRCA), Florence, Italy. The study population for these analyses included 98
1453 participants aged between 20 and 102 years old, of which 75% were aged 65 and over, randomly selected 99
from residents in two towns in the Chianti area (Greve in Chianti and Bagno a Ripoli, Tuscany, Italy) using a 100
multi‐level stratified sampling method. Initial data collection started in September 1998 and was completed in 101
March 2000. Three and 6‐year follow‐up assessments of the InCHIANTI study population were performed in the 102
years 2001‐2003 and 2004‐2006. A detailed description of the sampling procedure and the method of data 103
collection have been published elsewhere (Ferrucci et al., 2000). The ethics committee (INRCA) approved the 104
entire study protocol. For PCA, logistic regression and survival analysis, we used 1010 participants aged 21‐96 105
having full biomarker data at baseline. Only the first visit was used for PCA and logistic regression, due to 106 limited inflammatory biomarker data at later visits. Participants with biomarker or comorbidity measurements 107 that were missing were excluded. 108 109
2.2 Biomarkers
110We studied 19 inflammatory biomarkers selected based on their availability and relevance. Details of the 111 methods of measurement of these biomarkers can be found in previous studies (Bandeen‐Roche et al., 2009; 112 Cesari et al., 2004; Ferrucci et al., 2000; Varadhan et al., 2014). Included inflammatory markers are as follows: 113 Among the cytokines, Interleukin (IL)‐1β, which causes a number of different auto‐inflammatory syndromes; IL‐ 114
3 4 5 6 7 8 9 10 11 12 13 14 15 16 17 18 19 20 21 22 23 24 25 26 27 28 29 30 31 32 33 34 35 36 37 38 39 40 41 42 43 44 45 46 47 48 49 50 51 52 53 54 55 56 57 58 59 60 61 62
1RA, which is a member of the IL‐1 family that binds to IL‐1 receptors but does not induce any intracellular 115 response; IL‐6, which could act as pro and anti‐inflammatory cytokine; IL‐8, which is a chemokine; IL‐10, which 116 is anti‐inflammatory and inhibits the synthesis of IFN‐ɤ and TNF‐α; IL‐12 and IL‐18, which are pro‐inflammatory; 117 and IL‐15, which is derived from T cells and stimulates proliferation of natural killer cell activation. 118
The receptors selected for our analyses were: SGP130, which prevents IL‐6 from binding to the membrane 119 receptor, and soluble (s)IL‐6R, which forms a ligand–receptor complex with IL‐6 that is capable of stimulating a 120 variety of cellular responses. Interferon IFN‐ is critical for innate and adaptive immunity. We also measured 121 transforming growth factor TGF‐β1, tumor necrosis factors TNF‐α, and TRAIL. Two of their receptors, STNF‐RI 122 and STNF‐RII, were also included. 123 We had data on two chemokines MCP and MIP, the latter of which induces the production of IL‐6 and TNF‐α. In 124
addition, we used high sensitivity C‐reactive protein (hsCRP), which is a clinical marker of systemic 125 inflammatory state. The main characteristics of the participants and the markers used are shown in Table 1. 126 127
2.3 Comorbidities
128 We selected 13 chronic conditions based on sufficient prevalence for meaningful analysis. Each was assessed at 129 baseline and at follow‐up visits. The conditions are: high blood pressure, lung, kidney, liver and cardiovascular 130disease, stroke, angina, congestive heart failure, diabetes, arthritis, cancer, myocardial infarction and 131 Parkinson. Detailed data were available from which to evaluate the presence or absence of chronic diseases; 132 when possible we coded each patient as 0 (no disease), 1 (having the disease), or 0.5 (ambiguous). Details are 133 available in the online supplement. We excluded the participants with an intermediate state to facilitate model 134
interpretation; alternative models counting them as positive or negative did not meaningfully change results 135
(data not shown). From the 13 comorbidities we created a new variable named “comorbidity” which has a 136
value of 1 if an individual has one or more of the 13 diseases mentioned above and 0 otherwise. Information 137
on prevalence of the comorbidities is shown in Table 1. Percentages for the comorbidities represent the 138
proportion of individuals that had the chronic disease at baseline (with the exception of mortality) or 139 developed it in one of the follow‐ups, for a total of 2785 visits with 1010 individuals. 140 141 142 143 144
3 4 5 6 7 8 9 10 11 12 13 14 15 16 17 18 19 20 21 22 23 24 25 26 27 28 29 30 31 32 33 34 35 36 37 38 39 40 41 42 43 44 45 46 47 48 49 50 51 52 53 54 55 56 57 58 59 60 61 Table 1 145 Main Characteristics of the Sample Population 146 Mean ± SD or % (N = 1010) Sociodemographic characteristics Age (year) 67.7 ± 16 Gender (female) 57.6 Site (Greve) 41.9 Comorbidities % Mortality 14.1 Comorbidity° 30.1 Cardiovascular disease 12.0 Congestive heart failure 2.91 Stroke 2.48 Kidney disease 2.05 Diabetes 5.24 Liver disease 1.90 Arthritis 7.94 Cancer 1.83 High blood pressure 21.5 Myocardial infarction 3.52 Angina 2.01 Lung disease 5.92 Parkinson 1.00 Note: SD=Standard deviation; °Any of the comorbid conditions that follow. 147 148 Table 2 149 Main Characteristics of the Inflammatory Markers 150 Mean ± SD (N = 1010) Age correlation a Inflammatory markers hsCRP (μg/ml) 4.32 ± 6.65 0.15** IFN‐ɤ (pg/ml) 23.14 ± 267.83 0.01 IL‐1β (pg/ml) 0.28 ± 1.33 0.02 IL‐1RA (pg/ml) 147.72 ± 101.12 0.07* IL‐6 (pg/ml) 3.25 ± 2.33 0.31** sIL‐6R (ng/ml) 104.74 ± 58.71 0.04 IL‐8 (pg/ml) 11.06 ± 147.93 0.02 IL‐10 (pg/ml) 90.59 ± 355.44 ‐0.13** IL‐12 (pg/ml) 14.05 ± 166.36 0.01
3 4 5 6 7 8 9 10 11 12 13 14 15 16 17 18 19 20 21 22 23 24 25 26 27 28 29 30 31 32 33 34 35 36 37 38 39 40 41 42 43 44 45 46 47 48 49 50 51 52 53 54 55 56 57 58 59 60 61 62 IL‐15 (pg/ml) 2.50 ± 0.59 0.19** IL‐18 (pg/ml) 383.60 ± 140.54 0.21** MCP (pg/ml) 53.11 ± 328.30 0.02 MIP (pg/ml) 88.63 ± 159.07 0.09* SGP130 (ng/ml) 305.32 ± 60.40 0.25** STNF‐RI (pg/ml) 1375.8 ± 643.05 0.48** STNF‐RII (pg/ml) 2620 ± 779.97 0.51** TGF‐β1 (pg/ml) 12063 ± 7342.67 0.02 TNF‐α (pg/ml) 6.35 ± 46.19 0.02 TRAIL (pg/ml) 75.5 ± 40.59 0.01 Note:a=Pearson’s correlation with age at baseline; SD=Standard deviation; hsCRP=High sensitivity C‐reactive protein; IFN‐ 151
ɤ=Interferon‐ɤ; IL=Interleukin; IL‐1RA=Interleukin‐1 receptor antagonist; sIL‐6R=Soluble IL‐6 receptor; MCP=Monocyte 152
chemoattractant protein‐1; MIP=Macrophage inflammatory protein‐1b; SGP130=Soluble glycoprotein 130; STNF‐ 153
R=Soluble TNF receptor; TGF=Transforming growth factor; TNF‐α= Tumor necrosis factor‐alpha; TRAIL=TNF‐related 154 apoptosis‐inducing ligand; *p<0.05; **p<0.01. 155 156
2.4 Statistical Analyses
157 We first transformed our data to meet the assumption of normality needed for the PCA. We used a logarithmic 158transformation for all variables except SGP130 and TNF‐α, which were already normally distributed. 159
Subsequently, variables were standardized by subtracting their mean and dividing by their standard deviation. 160
Thereafter, we performed a PCA on the 19 biomarkers. The stability of each of the axes under random 161
sampling was then tested using bootstrap methods based on Daudin's algorithm (Daudin, Duby, & Trecourt, 162
1988). This method produces random samples of the same size where each individual can be selected more 163
than once in the same sample. From the original database, we thus synthesized 5000 other databases and 164
performed a PCA on each of them. This allowed us to construct confidence intervals and to verify the variation 165
of the components in each axis as well as the proportion of variance explained. In addition, a similar approach 166
using non‐random sampling was performed to determine whether axis stability and interpretation were 167
conserved even across mutually exclusive and potentially biologically different sub‐populations. The groups 168 used for this included men, women, residents of Greve in Chianti or Bango a Ripoli, and age groups (<65, 65+ 169 years). 170 For the two axes found to be stable, we computed a "score" for each individual. This "score" represents the 171 position of an individual on the principal axis. We then assessed the correlation between participant age and 172 score on each of these two main axes. These scores were then divided by their respective standard deviations 173 so that they would have the same scales (and thus comparable effect sizes) as individual markers in regression 174 analyses (below). 175
3 4 5 6 7 8 9 10 11 12 13 14 15 16 17 18 19 20 21 22 23 24 25 26 27 28 29 30 31 32 33 34 35 36 37 38 39 40 41 42 43 44 45 46 47 48 49 50 51 52 53 54 55 56 57 58 59 60 61
Relationships between PCA scores and baseline comorbidities were assessed using logistic regression 176
controlling for age as a cubic spline. Splines were fit using the bs function in the fda package in R. The same 177
model was fit for individuals who died before the first follow‐up to assess mortality. Odds ratios (ORs) were 178 then estimated for the scores of the two main axes. Models were also assessed with stratified sex. We did not 179 include additional covariates (e.g. BMI, smoking habit, education) because they are likely to be upstream from 180 physiological variables in causal pathways and there is a substantial risk of eliminating the variance of interest 181 with control. 182
Using longitudinal data on chronic diseases and excluding individuals with the respective baseline chronic 183
disease, we fitted a survival analysis using a Cox proportional hazard function controlling for age as a cubic 184 spline. Due to limited inflammatory biomarker data at later visits, only the baseline scores of the two main axes 185 were included in the models. The survival models indicated whether a high baseline score increases or reduces 186 the likelihood of incidence. Hazard ratios (HRs) per unit score were estimated and can be interpreted as above. 187 188
3. Results
189 1903.1 Principal component analysis
191 We performed PCA on 19 inflammatory biomarkers transformed and standardized on 1010 individuals aged 21‐ 192 96 years. The first principal axis (PCA1) explained 19% of the total variance among the inflammatory markers 193 and the second (PCA2) explained 10% for a cumulative of 29% (Figure 1). Only the first two axes were stable 194 across 5000 random (bootstrapped) samples. 1953 4 5 6 7 8 9 10 11 12 13 14 15 16 17 18 19 20 21 22 23 24 25 26 27 28 29 30 31 32 33 34 35 36 37 38 39 40 41 42 43 44 45 46 47 48 49 50 51 52 53 54 55 56 57 58 59 60 61 62 1 2 0.10 0.1 2 0.1 4 0 .16 0 .18 0.20 Axes P ro por tion of var ia n ce 3 5 7 9 11 13 15 17 19 0. 0 2 0. 04 0. 0 6 0. 08 Axes 196 Figure 1: Boxplot of variance explained for each of the 19 axes using 5000 random samples from the bootstrap. 197 The first two axes (PCA1 and PCA2) are presented separately to allow appropriate y‐axis scaling. 198 Using these 5000 iterations, we calculated the correlation between the original scores and those created by the 199 bootstrap samples. A strong correlation for the same axis across bootstrap samples would indicate that the axis 200 interpretation is robust to fluctuation in sample composition. The correlation varies between 99% and 99.99% 201 for PCA1 and varies between 91% and 99.99% for PCA2 with a 95% confidence (Figure 2). 202 1 2 0.92 0.9 4 0 .96 0.98 1.0 0 Axes Co rre la tio n 3 5 7 9 11 13 15 17 19 0 .00 .2 0 .40 .6 0 .81 .0 Axes 203
3 4 5 6 7 8 9 10 11 12 13 14 15 16 17 18 19 20 21 22 23 24 25 26 27 28 29 30 31 32 33 34 35 36 37 38 39 40 41 42 43 44 45 46 47 48 49 50 51 52 53 54 55 56 57 58 59 60 61 Figure 2: Boxplot of correlations between the original scores and those created by the 5000 random samples 204 from the bootstrap for each of the 19 axes. 205
Starting with the 3rd axis, axis order is occasionally inversed in bootstrap samples, leading to very low 206
correlations, but even among the non‐inversed samples it is clear that the correlations are much weaker than 207
for the first two axes, which need to be shown with a separate y‐axis scale to indicate variation. 208
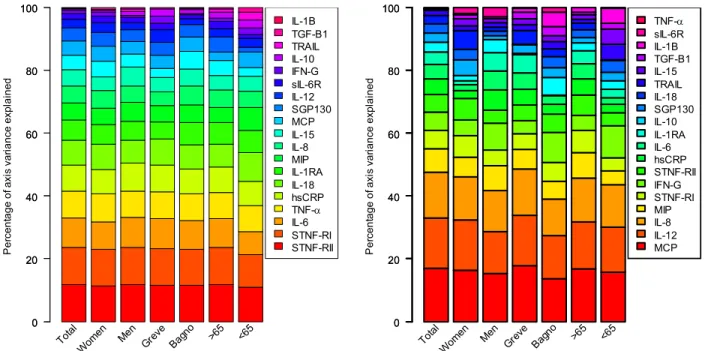
The stability of the main axis loadings across non‐random samples is shown in Figure 3. The order and 209 importance of the axis loadings is essentially unchanged even in mutually exclusive subsamples. 210 P e rc en tage of axi s var ia n ce expl a ined 0 20 40 60 80 100 0 20 40 60 80 100 Total Wom en Men Greve Bagn o >65 <65 IL-1B TGF-B1 TRAIL IL-10 IFN-G sIL-6R IL-12 SGP130 MCP IL-15 IL-8 MIP IL-1RA IL-18 hsCRP TNF- IL-6 STNF-RI STNF-RII Perc en tage of axi s var ia n ce expl a ined 0 20 40 60 80 100 0 20 40 60 80 100 Total Wom en Men Grev e Bagn o >65 <65 TNF- sIL-6R IL-1B TGF-B1 IL-15 TRAIL IL-18 SGP130 IL-10 IL-1RA IL-6 hsCRP STNF-RII IFN-G STNF-RI MIP IL-8 IL-12 MCP 211
Figure 3: Strength and stability of axis loadings for PCA1 (left) and PCA2 (right) across non‐random, often 212
mutually exclusive population subsamples (the entire population, women, men, those from Greve in Chianti, 213 those from Bagno a Ripoli, those aged less than 65, those aged more than 65). Here, each color represents one 214 of the 19 markers, ordered from bottom to top by their importance in the full population analysis, represented 215 by the height of the color. 216
A particular group of markers comprising: STNF‐RI, STNF‐RII, IL6, TNF‐α, hsCRP, IL‐18, IL1‐RA appears to be 217
dissociated from all others, as graphically represented PCA1 (Figure 4). A similar observation was made for 218
MCP, IL‐8 and IL‐12 on PCA2 (Figure 4). Since each group is the most representative in its respective axis, they 219
drive the interpretation of the axes, though the markers explaining PCA2 also loaded moderately on PCA1. 220
Note that the markers that load most heavily on PCA1 include both pro‐ and anti‐inflammatory markers, and 221
that they load in the same direction. In other words, PCA1 explains the degree to which an individual has 222
simultaneously high (or low) levels of both pro‐ and anti‐inflammatory markers. 223
3 4 5 6 7 8 9 10 11 12 13 14 15 16 17 18 19 20 21 22 23 24 25 26 27 28 29 30 31 32 33 34 35 36 37 38 39 40 41 42 43 44 45 46 47 48 49 50 51 52 53 54 55 56 57 58 59 60 61 62 224 225 Figure 4: Biplot of loadings for the first two PCA axes. A loading far from zero on a given axis indicates that the 226
variable in question plays an important role in determining the axis. Green names are anti‐inflammatory 227 markers, red names are pro‐inflammatory, blue names are part of the innate immune system and black names 228 are the rest. 229 230 Based on key markers that compose the two stable groups, we conducted a PCA and assessed the scores for 231
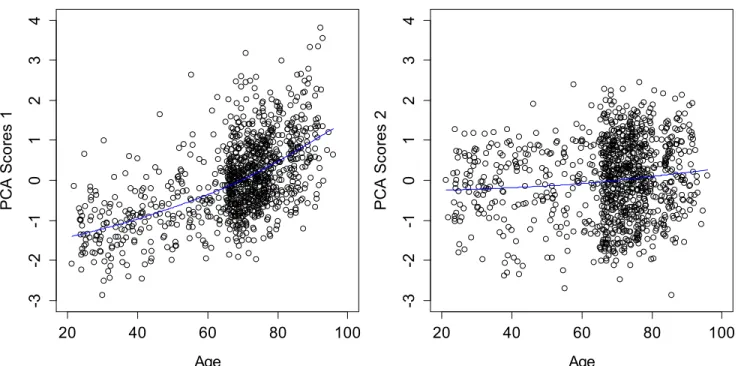
participants for the first two axes. PCA1 showed a relatively strong correlation with age (r=0.56, p <0.0001, 232 Figure 5‐left), whereas PCA2 showed no significant association with age (Figure 5‐right). Note that hsCRP, IL‐ 233 1RA, IL‐6, IL‐10, IL‐15, IL‐18, MIP, SGP130, STNF‐RI, and STNF‐RII were significantly correlated with age (Table 234 1), but by incorporating the correlation structure of the PCA, we obtain a higher correlation than any measure 235 alone. 236 237
3 4 5 6 7 8 9 10 11 12 13 14 15 16 17 18 19 20 21 22 23 24 25 26 27 28 29 30 31 32 33 34 35 36 37 38 39 40 41 42 43 44 45 46 47 48 49 50 51 52 53 54 55 56 57 58 59 60 61 20 40 60 80 100 -3 -2 -1 0 1 2 3 4 Age PCA Sc o re s 1 20 40 60 80 100 -3 -2 -1 0 1 2 3 4 Age PCA Sc o re s 2 238 Figure 5: Correlations between age and the standardized scores for PCA1 (left), PCA2 (right). Blue lines indicated 239 cubic spline fits 240
241
3.2 Logistic regression models
242 We used logistic regression to calculate the ORs of the 13 comorbidities and mortality for scores after adjusting 243 for age. The ORs and respective 95% confidence intervals are shown in Table 2. Note that ORs are per unit PCA; 244the scale of PCA1 (after being standardized for comparison purposes) goes from roughly ‐3 to +3, so the OR 245
between the individual with the lowest score and the highest score is the OR to the sixth power, 2.346 ≈ 164 for 246
mortality, for example. ORs for key individual markers associated with the main axes were also included in the 247
table for comparison. As expected from the unchanged order and importance of the axis loadings between 248
genders, no significant differences were observed between men and women in the logistic models (data 249 available in the supplementary content). 250 251
3.3 Survival analysis
252 From the scores assessed at baseline with PCA, we used a survival analysis to assess the long‐term effect of a 253high or low score on the two main axes for the 13 comorbidities and mortality after adjusting for age. The 254
hazard ratios (HRs) and 95% confidence intervals are shown in Table 3. Stratification by sex did not 255
meaningfully change the results (data available in the supplementary content). 256
3 4 5 6 7 8 9 10 11 12 13 14 15 16 17 18 19 20 21 22 23 24 25 26 27 28 29 30 31 32 33 34 35 36 37 38 39 40 41 42 43 44 45 46 Table 3 257 Results from the logistic regressions for baseline comorbidities 258
Note:a Scores of the PCA1 adjusted for age; b Scores of the PCA2 adjusted for age; OR=Odds ratio; CI=Confidence intervals; ‘p<0.10; *p<0.05; **p<0.01. The joint model 259 included both PCA1 and PCA2 as simultaneous predictors of chronic diseases, controlling for age. Each inflammatory marker was modeled separately for its effect on 260 each chronic disease controlling for age. 261
Joint Model
Separate models
Comorbidity conditionsn
OR (95% CI)
PCA1
aOR (95% CI)
PCA2
bSTNF‐RI
IL‐6
hsCRP
OR
TNF‐α
IL‐12
IL8
MCP
Mortality 135 2.34** (1.72‐3.25) 0.63**(0.48‐0.82) 2.00** 1.98** 1.98** ‐ ‐ ‐ ‐ Comorbidity 686 1.50** (1.23‐1.84) 0.78**(0.66‐0.90) 1.33** 1.32** 1.28** ‐ ‐ ‐ ‐ Cardiovascular disease 184 1.57**(1.26‐1.96) 0.69**(0.57‐0.83) 1.43** 1.52** 1.26** 1.23* ‐ 0.83* ‐ Congestive heart failure 48 2.02** (1.42‐2.91) 0.43**(0.30‐0.61) 1.90** 1.75** 1.41* 1.35* ‐ ‐ 0.64* Stroke 46 2.05**(1.49‐2.86) 0.74*(0.55‐0.98) 1.88** ‐ 1.69** 1.28* ‐ ‐ ‐ Kidney disease 26 2.84**(1.41‐5.81) 0.79(0.40‐1.37) 2.49** 2.36* ‐ 1.88* ‐ ‐ ‐ Diabetes 112 1.61** (1.28‐2.04) 0.95(0.79‐1.15) 1.25* 1.42** 1.17* ‐ ‐ ‐ 1.22* Liver disease 41 1.28(0.88‐1.85) 0.66*(0.47‐0.90) 1.62* ‐ ‐ ‐ ‐ ‐ 0.62* Arthritis 91 1.04(0.80‐1.36) 0.74*(0.58‐0.93) ‐ ‐ ‐ ‐ ‐ 0.77* ‐ Cancer 16 1.68’(0.97‐2.83) 0.82(0.50‐1.32) ‐ ‐ ‐ ‐ ‐ ‐ ‐ High blood pressure 422 1.11(0.94‐1.29) 0.94(0.83‐1.07) ‐ ‐ ‐ ‐ ‐ ‐ ‐ Myocardial Infarction 31 1.15(0.74‐1.75) 0.96(0.66‐1.38) ‐ ‐ ‐ ‐ ‐ ‐ ‐ Angina 43 1.32(0.92‐1.87) 0.87(0.79‐1.18) ‐ ‐ ‐ ‐ ‐ ‐ ‐ Lung disease 130 1.16(0.93‐1.45) 0.87(0.72‐1.05) ‐ 1.44** 1.36** ‐ ‐ ‐ ‐ Parkinson 9 0.69(0.28‐1.54) 0.52(0.22‐1.09) ‐ ‐ ‐ ‐ ‐ ‐ ‐3 4 5 6 7 8 9 10 11 12 13 14 15 16 17 18 19 20 21 22 23 24 25 26 27 28 29 30 31 32 33 34 35 36 37 38 39 40 41 42 43 44 45 Table 4 262 Results from the survival analysis for comorbidities 263
Joint Model
Separate models
Comorbidity conditionsn
HR (95% CI)
PCA1
aHR (95% CI)
PCA2
bSTNF‐RI
IL‐6
hsCRP
HR
TNF‐α
IL‐12
IL8
MCP
Mortality 257 1.33**(1.16‐1.53) 0.87*(0.76‐0.98) 1.30** 1.28** 1.21** ‐ ‐ ‐ ‐ Comorbidity 153 1.23*(1.03‐1.49) 0.87’(0.74‐1.02) ‐ ‐ 1.33** ‐ ‐ ‐ ‐ Cardiovascular disease 151 1.10(0.92‐1.32) 1.04(0.89‐1.22) ‐ 1.32** 1.35** 0.81* ‐ ‐ ‐ Congestive heart failure 33 1.16(0.78‐1.73) 0.85(0.59‐1.22) ‐ 1.53* 1.47* ‐ ‐ ‐ ‐ Stroke 23 1.26(0.80‐1.99) 0.99(0.68‐1.47) ‐ 1.63* ‐ ‐ ‐ ‐ ‐ Kidney disease 31 1.74**(1.16‐2.61) 1.14(0.81‐1.62) 2.76** ‐ ‐ ‐ ‐ ‐ 1.54* Diabetes 34 1.26(0.86‐1.86) 1.07(0.78‐1.49) ‐ ‐ ‐ ‐ ‐ ‐ ‐ Liver disease 12 0.72(0.35‐1.49) 0.57(0.29‐1.12) ‐ ‐ ‐ ‐ ‐ ‐ ‐ Arthritis 130 1.09(0.88‐1.34) 0.95(0.81‐1.13) ‐ ‐ ‐ ‐ ‐ ‐ ‐ Cancer 35 0.90(0.61‐1.34) 1.24(0.90‐1.69) ‐ ‐ ‐ ‐ ‐ ‐ ‐ High blood pressure 178 1.25*(1.05‐1.49) 0.86*(0.75‐0.99) ‐ ‐ 1.19* ‐ ‐ ‐ ‐ Myocardial Infarction 67 0.74*(0.55‐0.99) 1.08(0.85‐1.36) 0.71* ‐ ‐ 0.77* ‐ ‐ ‐ Angina 13 0.88(0.46‐1.68) 1.89*(1.06‐3.36) ‐ ‐ ‐ ‐ ‐ ‐ ‐ Lung disease 35 1.24(0.86‐1.81) 1.09(0.80‐1.48) ‐ 1.53* ‐ 1.58* ‐ ‐ ‐ Parkinson 19 0.84(0.48‐1.45) 0.84(0.52‐1.36) ‐ ‐ ‐ ‐ ‐ ‐ ‐Note: a Scores of the first axis adjusted for age; b Scores of the second axis adjusted for age; HR=Hazard ratio; CI=Confidence intervals; ‘p<0.10; *p<0.05; **p<0.01. The 264
joint model included both PCA1 and PCA2 as simultaneous predictors of chronic diseases, controlling for age. Each inflammatory marker was modeled separately for 265
its effect on each chronic disease controlling for age. 266
3 4 5 6 7 8 9 10 11 12 13 14 15 16 17 18 19 20 21 22 23 24 25 26 27 28 29 30 31 32 33 34 35 36 37 38 39 40 41 42 43 44 45 46 47 48 49 50 51 52 53 54 55 56 57 58 59 60 61 62
4. Discussion
267268 The present study used a multivariate approach to assess the relationship between inflammatory markers, age, 269
chronic diseases, and mortality in an elderly population. A traditional understanding of “Inflamm‐aging” 270
suggests that low‐grade inflammation increases during aging and can be measured by levels of pro‐ 271
inflammatory markers (Singh& Newman, 2011). Contrary to this idea, our results showed that the main axis of 272
variation we detected – which can clearly be interpreted as a measure of Inflamm‐aging given its associations 273
with individual markers, age, and health outcomes – implied simultaneous changes in both pro‐ and anti‐ 274
inflammatory markers (STNF‐RI, STNF‐RII, IL‐6, TNF‐α, hsCRP, IL‐18 and IL‐1 RA). Individuals thus varied in terms 275
of the overall activation of their inflammatory systems much more than in terms of the pro‐ vs. anti‐ 276
inflammatory balance, with individuals that showed high levels of pro‐inflammatory markers also tending to 277
show high levels of anti‐inflammatory markers. We did not detect an axis representing pro‐ versus anti‐ 278
inflammatory balance, indicating that such a balance does not explain important variation at the population 279
level. 280
Overall, we detected two predominant, highly stable axes of variation in the inflammatory system. Together, 281
these axes explained 29% of the total variance among the inflammatory markers, enough to indicate their 282
importance, but far less than 100%. The remaining axes were unstable, suggesting that complex system 283
dynamics determine a large part of the variance in ways that cannot be easily characterized by approaches 284
such as PCA. Nonetheless, the two axes identified have clear, interesting biological interpretations. Obviously, 285
had we included more markers, we might have obtained a different axis structure, perhaps detecting other 286
important axes, or other markers associated with PCA1 and PCA2. However, given the stability of our results in 287
subpopulations and the concordance of this study with others (Bandeen‐Roche et al., 2009; Varadhan et al., 288
2014), the core interpretations of PCA1 and PCA2 would almost certainly remain unchanged. 289
The first axis was driven largely by STNF‐RI, STNF‐RII, IL‐6, TNF‐α, hsCRP, IL‐18 and IL‐1 RA and was strongly 290
correlated with age. As STNF‐RI, STNF‐RII and IL‐6 are individually correlated with age and known to be 291
associated with health outcomes (Diniz et al., 2010; Fernandez‐Real et al., 2001; Il'yasova et al., 2005; Safranow 292
et al., 2009) the result is not unexpected. However, the combination of these variables through PCA leads to a 293
stronger correlation than any variable alone. As noted above, the loadings for PCA1 indicate that it is not a 294
simple measure of more inflammation: it is driven by higher levels of both pro‐ and anti‐inflammatory markers, 295
indicating a more activated (but not necessarily more inflamed) inflammatory system. One interpretation 296
would be that increasing levels of pro‐inflammatory markers with age stimulate a corresponding augmentation 297
3 4 5 6 7 8 9 10 11 12 13 14 15 16 17 18 19 20 21 22 23 24 25 26 27 28 29 30 31 32 33 34 35 36 37 38 39 40 41 42 43 44 45 46 47 48 49 50 51 52 53 54 55 56 57 58 59 60 61
in anti‐inflammatory markers, with varying outcomes depending on the nature of the stimulation, the pre‐ 298 existing physiological reserve, and the current immune background. 299 Inflammation is well known to be associated with many chronic diseases such as diabetes, atherosclerosis and 300 cardiovascular disease (Hansson, 2005; Schmidt et al., 1999), and this was confirmed here. The ORs indicating 301 the baseline presence of chronic diseases based on the first axis were surprisingly large (considering that the 302
ORs are per unit PCA, and the PCAs range from –3 to 3), and were significant for mortality, presence of any 303
comorbidity, and individual chronic diseases such as cardiovascular disease, congestive heart failure, stroke, 304
kidney disease and diabetes. For most of the remaining chronic diseases, sample sizes were too small to be 305
conclusive. The majority of these diseases are related to the cardiovascular system. The causes of 306
cardiovascular diseases are diverse but atherosclerosis and/or hypertension are the most common (Epstein& 307
Ross, 1999; Sowers, Epstein, & Frohlich, 2001). Interestingly the relationship was not significant for 308
hypertension, despite a large sample, suggesting an independent contribution of inflammation to 309
cardiovascular disease. This supports the study of Pearson et al. (Pearson et al., 2003) who showed that in the 310
case of inflammatory markers, the association with cardiovascular disease might reflect a response to other, 311
established risk factors (eg, obesity, diabetes, hyperlipidemia, cigarette smoking) or due to inflammatory 312
processes as part of atherosclerotic disease. Furthermore, PCA1 often predicted outcomes more strongly than 313
the individual markers, particularly for prevalence rather than incidence. 314
The strong associations between PCA1 and health outcomes at baseline shown via logistic regression do not 315
address causality. Indeed, it is likely that diseased states feed back into inflammatory systems, and that the 316
elevated levels of PCA1 are as much consequence as cause of chronic diseases. This is borne out by the survival 317
analyses, where effect sizes were generally much smaller and rarely significant, though still almost always 318
positive. The lack of significance, but not the smaller effect sizes, is also probably due to the often much 319
smaller sample sizes for incidence rather than prevalence for many diseases. Nonetheless, there were still clear 320
associations for mortality and kidney disease, and, unlike in the logistic regressions, hypertension incidence 321
was associated with high PCA1 scores. Together, these results are consistent with biological impacts of PCA1 on 322
chronic diseases and mortality, but also with effects of chronic diseases on PCA1, forming positive feedback 323 loops. These effects appear to be heterogeneous across diseases, with, for example, PCA1 having a potentially 324 large effect on kidney disease, and cardiovascular disease having a potentially large effect on PCA1. 325 Given these results with chronic diseases, we should hesitate to interpret PCA1 as a measure of aging or part of 326 the aging process. Although the correlation between PCA1 and age is strong, it is possible that changes in PCA1 327
reflect chronic disease processes in feedback loops, and that the age‐PCA1 correlation is due to age‐related 328
increases in chronic disease risk. Just as no older individual (80+) in our sample had a very low score on PCA1, 329
3 4 5 6 7 8 9 10 11 12 13 14 15 16 17 18 19 20 21 22 23 24 25 26 27 28 29 30 31 32 33 34 35 36 37 38 39 40 41 42 43 44 45 46 47 48 49 50 51 52 53 54 55 56 57 58 59 60 61 62 no individual at these ages was completely free from chronic diseases, and we have very little statistical power 330 to address the possibility of disease‐independent Inflamm‐aging. However, PCA2 was strongly associated with 331
chronic diseases but not age, so we cannot exclude the possibility that PCA1 is linked to aging as well as to 332
chronic diseases. In any case, PCA1 suggests that Inflamm‐aging is a generalized dysregulation of the 333
inflammatory system, but that this dysregulation proceeds in a relatively predictable fashion and results in a 334
coherent restructuration of the levels of multiple key inflammatory markers. 335
Another recent study applied survival analysis and PCA to biomarkers of inflammation from InCHIANTI to 336 develop clinical predictors of mortality up to 10 years (Varadhan et al., 2014). They used a weighted summary 337 score (WSS) and principal component summary score (PCS) based on five markers chosen for their association 338 with mortality (IL‐6, STNF‐RI, hsCRP, IL‐18 and IL1‐RA), as well as an inflammatory index score (IIS) based on the 339 two best markers (IL‐6 and STNF‐R1). IIS had the strongest predictive power for 1‐ , 2‐ and 10‐year mortality. 340 The most important markers that drive the interpretation of our main axis are STNF‐RI, STNF‐RII and IL‐6. Table 341 5 shows the correlations between PCA1 and the measures in the study of Varadhan et al. (2014) as well as the 342 HRs both assessed with the InChianti participants (n=1010) for mortality. HRs of IIS and WSS perform slightly 343 better than PCA1, but the overall effects are comparable considering the confidence intervals. 344 Table 5 345 Correlation matrix and Hazard ratios comparison for mortality 346
Measure PCA1 PCS IIS WSS HR(95% CI)
PCA1 1 ‐ ‐ ‐ 1.33(1.16‐1.53)
PCS 0.88 1 ‐ ‐ 1.18(1.04‐1.34)
IIS 0.86 0.84 1 ‐ 1.47(1.26‐1.72)
WSS 0.91 0.93 0.92 1 1.54(1.26‐1.88)
Notes: PCA1 = Scores from the first axis of PCA with 19 biomarkers; PCS = Scores from the first axis of PCA with 5 347
biomarkers; ISS = Inflammatory index score was calculated as follows ISS=1/3 IL‐6 + 2/3 STNF‐RI; WSS = Weighted 348 summary score was calculated as a weighted sum of the 5 biomarkers. 349 350 While the approaches of the two studies are similar, Varadhan et al. (2014) has clinical prediction as a primary 351
goal, whereas we emphasize biological understanding. In this sense the two studies are confirmatory and 352
complementary, despite some potentially important methodological differences (e.g. variable selection 353
criteria). We provide evidence of two stable biological processes; they provide a clinically relevant measure of 354
the first. 355
3 4 5 6 7 8 9 10 11 12 13 14 15 16 17 18 19 20 21 22 23 24 25 26 27 28 29 30 31 32 33 34 35 36 37 38 39 40 41 42 43 44 45 46 47 48 49 50 51 52 53 54 55 56 57 58 59 60 61
In addition, a previous analysis using the Leiden 85‐plus study showed that an unopposed pro‐inflammatory 356
response is beneficial for survival in the oldest (Wijsman, Maier, de Craen, van den Biggelaar, & Westendorp, 357
2011). Furthermore, low‐pro and low‐anti‐inflammatory markers showed an increase in mortality, contrasting 358
with our results. However, their result did not apply in a subsample of individuals aged 90+, and our study 359
cohort is composed mainly of younger individuals, suggesting a possibility strong non‐linear interaction of 360
these effects with age. 361
The second biological process we identified is explained largely by MCP, IL‐12 and IL‐8. This axis can be 362
interpreted as reflecting aspects of the innate immune response. The innate immune system comprises the 363
cells and mechanisms that defend the body against immediate infectious agents regardless of prior exposure. 364
Innate immune cells include natural killer cells, granulocytes (mast cells, eosinophils and basophils) and 365
phagocytes (macrophages, neutrophils and dendritic cells), and the main role of MCP, IL‐12 and IL‐8 is to 366
attract and stimulate these cells. While PCA2 is highly stable and appears to represent important variation in 367
the state of the inflammatory system, it does not appear to be directly related to the aging process. As MCP, IL‐ 368
12 and IL‐8 were not significantly correlated with age, the weak correlation with age was not unexpected. It 369
may reflect genetic variation in the structure of the immune system or transient variation in inflammatory state 370
based on minor, short‐term immune challenges occurring through all physiological systems independent of 371 age. 372 373 However, PCA2 was associated with roughly the same chronic diseases as PCA1, but in the opposite direction 374 (i.e. OR/HR less than 1), meaning that an increase in PCA2 is protective for the chronic diseases. Additionally, 375 while effect sizes for PCA1 and individual markers moved in parallel, PCA2 was often a stronger predictor (e.g. 376
congestive heart failure) or weaker predictor (e.g. kidney disease) than PCA1 and the individual markers, 377 confirming its complementary role in chronic disease. We can see from Figure 4 that MCP, IL‐12 and IL‐8 also 378 loaded positively on the first axis. This means that Inflamm‐aging seems to be incorporating part of the innate 379 immune activation in our dataset, despite the opposing predictive values of the two for chronic diseases. Other 380 studies suggest that extrinsic (environmental) factors become increasingly important in the elderly, and as age 381 is associated with a breakdown of the epithelial barriers of the skin, lung and gastrointestinal tract, the innate 382 immune system is more challenged (Gomez, Boehmer, & Kovacs, 2005), perhaps needed as a counterbalance 383 to age‐related changes in the more sophisticated components of the first axis. This might explain the stability 384 of the axis in our data. 385 386
4.1 Limitations
3873 4 5 6 7 8 9 10 11 12 13 14 15 16 17 18 19 20 21 22 23 24 25 26 27 28 29 30 31 32 33 34 35 36 37 38 39 40 41 42 43 44 45 46 47 48 49 50 51 52 53 54 55 56 57 58 59 60 61 62 We showed that PCA was stable for the two main axes across InCHIANTI, but analyses need to be replicated in 388 other data sets to look for a general trend across populations. The small sample sizes for some conditions like 389 cancer or Parkinson’s disease (1.83% and 1% of the sample respectively) make the logistic regressions results 390 sensitive to perturbations. Also, there were substantial missing values among the 13 chronic diseases, and we 391 were unable to incorporate medication status into our models; still, results agree with the study of Varadhan et 392 al. (2014). The availability of the visits (a maximum of four visits with a 3‐year space between each) and the 393 missing values of several markers at follow‐ups is a constraint when using the Cox proportional hazards model. 394 395
5. Conclusions
396Multivariate analysis of inflammatory biomarkers appears to show an augmentation in overall activation of 397
inflammatory systems with aging, but not necessarily in levels of inflammation per se, as is generally supposed. 398
In this sense, simple use of IL‐6 or CRP as inflammatory markers may be a bit misleading, even though they 399
correlate well with overall activation and predict chronic diseases. When considered altogether, the markers 400
STNF‐RI, STNF‐RII, IL‐6, TNF‐α, hsCRP, IL‐18 and IL‐1 RA are, as a group, strongly associated with chronic 401
diseases and mortality in this elderly population. A second key axis, hitherto unappreciated in the scientific 402
literature, describes innate immune system activation and may be protective against many chronic diseases 403
and mortality. The combination of the two axes suggests that Inflamm‐aging is not simply an increase in pro‐ 404
inflammatory markers but may be a fine balance between them. Future studies of inflammation should 405
continue to use multiple markers and take systems‐based approaches to estimate the relevant underlying 406 biological processes. 407 408 Fundings 409 Alan A. Cohen is a member of the FRQ‐S‐supported Centre de recherche sur le vieillissement and Centre de recherche 410 Étienne Le‐Bel, and is a funded Research Scholar of the FRQ‐S. This research was supported by CIHR grant #s 110789, 411 120305, 119485 and by NSERC Discovery Grant # 402079‐2011. 412 413
References
414 415 Akiyama, H., Barger, S., Barnum, S., Bradt, B., Bauer, J., Cole, G. M., Cooper, N. R., Eikelenboom, P., Emmerling, 416 M., Fiebich, B. L., Finch, C. E., Frautschy, S., Griffin, W. S. T., Hampel, H., Hull, M., Landreth, G., Lue, L., 417 Mrak, R., Mackenzie, I. R., McGeer, P. L., O’Banion, M. K., Pachter, J., Pasinetti, G., Plata–Salaman, C., 4183 4 5 6 7 8 9 10 11 12 13 14 15 16 17 18 19 20 21 22 23 24 25 26 27 28 29 30 31 32 33 34 35 36 37 38 39 40 41 42 43 44 45 46 47 48 49 50 51 52 53 54 55 56 57 58 59 60 61 Rogers, J., Rydel, R., Shen, Y., Streit, W., Strohmeyer, R., Tooyoma, I., Van Muiswinkel, F. L., Veerhuis, R., 419 Walker, D., Webster, S., Wegrzyniak, B., Wenk, G., & Wyss–Coray, T. 2000. Inflammation and Alzheimer’s 420 disease. Neurobiology of aging, 21, 383‐421. 421 Bandeen‐Roche, K., Walston, J. D., Huang, Y., Semba, R. D., & Ferrucci, L. 2009. Measuring systemic 422 inflammatory regulation in older adults: evidence and utility. Rejuvenation research, 12, 403‐410. 423 Barzilay, J. I., Abraham, L., Heckbert, S. R., Cushman, M., Kuller, L. H., Resnick, H. E., & Tracy, R. P. 2001. The 424 Relation of Markers of Inflammation to the Development of Glucose Disorders in the Elderly: The 425 Cardiovascular Health Study. Diabetes, 50, 2384‐2389. 426 Bruunsgaard, H. 2002. Effects of tumor necrosis factor‐alpha and interleukin‐6 in elderly populations. European 427 cytokine network, 13, 389‐391. 428 Bruunsgaard, H., Andersen‐Ranberg, K., Jeune, B., Pedersen, A. N., Skinhøj, P., & Pedersen, B. K. 1999. A high 429 plasma concentration of TNF‐α is associated with dementia in centenarians. The Journals of Gerontology 430 Series A: Biological Sciences and Medical Sciences, 54, M357‐M364. 431 Cesari, M., Penninx, B. W. J. H., Pahor, M., Lauretani, F., Corsi, A. M., Williams, G. R., Guralnik, J. M., & Ferrucci, 432 L. 2004. Inflammatory Markers and Physical Performance in Older Persons: The InCHIANTI Study. The 433 Journals of Gerontology Series A: Biological Sciences and Medical Sciences, 59, M242‐M248. 434 Cohen, A. A., Dhingra, N., Jotkar, R. M., Rodriguez, P. S., Sharma, V. P., & Jha, P. 2010. The Summary Index of 435 Malaria Surveillance (SIMS): a stable index of malaria within India. Popul Health Metr, 8. 436 Daudin, J., Duby, C., & Trecourt, P. 1988. Stability of principal component analysis studied by the bootstrap 437 method. Statistics: A Journal of Theoretical and Applied Statistics, 19, 241‐258. 438 Diniz, B. S., Teixeira, A. L., Ojopi, E. B., Talib, L. L., Mendonca, V. A., Gattaz, W. F., & Forlenza, O. V. 2010. Higher 439 serum sTNFR1 level predicts conversion from mild cognitive impairment to Alzheimer's disease. Journal of 440 Alzheimer's Disease, 22, 1305‐1311. 441 Dusseault‐Belanger, F., Cohen, A. A., Hivert, M., Courteau, J., & Vanasse, A. 2013. Validating Metabolic 442 Syndrome Through Principal Component Analysis in a Medically Diverse, Realistic Cohort. Metabolic 443 syndrome and related disorders, 11, 21‐28. 444 Epstein, F. H., & Ross, R. 1999. Atherosclerosis—an inflammatory disease. New England journal of medicine, 445 340, 115‐126. 446 Fernandez‐Real, J., Vayreda, M., Richart, C., Gutierrez, C., Broch, M., Vendrell, J., & Ricart, W. 2001. Circulating 447 interleukin 6 levels, blood pressure, and insulin sensitivity in apparently healthy men and women. Journal 448 of Clinical Endocrinology & Metabolism, 86, 1154‐1159. 449 Ferrucci, L., Bandinell, S., Benvenuti, E., Di Iorio, A., Macchi, C., Harris, T., & Guralnik, J. M. 2000. Subsystems 450 contributing to the decline in ability to walk: bridging the gap between epidemiology and geriatric practice 451 in the InCHIANTI study. JOURNAL‐AMERICAN GERIATRICS SOCIETY, 48, 1618‐1625. 452 Finch, C. E. 2010. The Biology of Human Longevity:: Inflammation, Nutrition, and Aging in the Evolution of 453 Lifespans, Academic Press. 454 Franceschi, C., Bonafè, M., Valensin, S., Olivieri, F., de Luca, M., Ottaviani, E., & de Benedictis, G. 2000. 455 Inflamm‐aging: An Evolutionary Perspective on Immunosenescence. Annals of the New York Academy of 456 Sciences, 908, 244‐254. 457 Gomez, C. R., Boehmer, E. D., & Kovacs, E. J. 2005. The aging innate immune system. Current opinion in 458 immunology, 17, 457‐462. 459 Hansson, G. K. 2005. Inflammation, atherosclerosis, and coronary artery disease. New England Journal of 460 Medicine, 352, 1685‐1695. 461 Il'yasova, D., Colbert, L. H., Harris, T. B., Newman, A. B., Bauer, D. C., Satterfield, S., & Kritchevsky, S. B. 2005. 462 Circulating Levels of Inflammatory Markers and Cancer Risk in the Health Aging and Body Composition 463 Cohort. Cancer Epidemiology Biomarkers & Prevention, 14, 2413‐2418. 464 Jolliffe, I. 2005. Principal component analysis, Wiley Online Library. 465 Pearson, T. A., Mensah, G. A., Alexander, R. W., Anderson, J. L., Cannon, R. O.,3rd, Criqui, M., Fadl, Y. Y., 466 Fortmann, S. P., Hong, Y., Myers, G. L., Rifai, N., Smith, S. C.,Jr, Taubert, K., Tracy, R. P., Vinicor, F., Centers 467 for Disease Control and Prevention, & American Heart Association 2003. Markers of inflammation and 468
3 4 5 6 7 8 9 10 11 12 13 14 15 16 17 18 19 20 21 22 23 24 25 26 27 28 29 30 31 32 33 34 35 36 37 38 39 40 41 42 43 44 45 46 47 48 49 50 51 52 53 54 55 56 57 58 59 60 61 62 cardiovascular disease: application to clinical and public health practice: A statement for healthcare 469 professionals from the Centers for Disease Control and Prevention and the American Heart Association. 470 Circulation, 107, 499‐511. 471 Safranow, K., Dziedziejko, V., Rzeuski, R., Czyżycka, E., Wojtarowicz, A., Bińczak‐Kuleta, A., Jakubowska, K., 472 Olszewska, M., Ciechanowicz, A., & Kornacewicz‐Jach, Z. 2009. Plasma concentrations of TNF‐α and its 473 soluble receptors sTNFR1 and sTNFR2 in patients with coronary artery disease. Tissue antigens, 74, 386‐ 474 392. 475 Scheller, J., Chalaris, A., Schmidt‐Arras, D., & Rose‐John, S. 2011. The pro‐ and anti‐inflammatory properties of 476 the cytokine interleukin‐6. Biochimica et Biophysica Acta (BBA) ‐ Molecular Cell Research, 1813, 878‐888. 477 Schmidt, M. I., Duncan, B. B., Sharrett, A. R., Lindberg, G., Savage, P. J., Offenbacher, S., Azambuja, M. I., Tracy, 478 R. P., & Heiss, G. 1999. Markers of inflammation and prediction of diabetes mellitus in adults 479 (Atherosclerosis Risk in Communities study): a cohort study. The Lancet, 353, 1649‐1652. 480 Singh, T., & Newman, A. B. 2011. Inflammatory markers in population studies of aging. Ageing Research 481 Reviews, 10, 319‐329. 482 Sowers, J. R., Epstein, M., & Frohlich, E. D. 2001. Diabetes, hypertension, and cardiovascular disease: an 483 update. Hypertension, 37, 1053‐1059. 484 Strandberg, T. E., & Tilvis, R. S. 2000. C‐Reactive Protein, Cardiovascular Risk Factors, and Mortality in a 485 Prospective Study in the Elderly. Arteriosclerosis, Thrombosis, and Vascular Biology, 20, 1057‐1060. 486 Tracy, R. P. 2002. Inflammation in cardiovascular disease: cart, horse or both‐‐revisited. Arteriosclerosis, 487 Thrombosis, and Vascular Biology, 22, 1514‐1515. 488 Varadhan, R., Yao, W., Matteini, A., Beamer, B. A., Xue, Q. L., Yang, H., Manwani, B., Reiner, A., Jenny, N., 489 Parekh, N., Fallin, M. D., Newman, A., Bandeen‐Roche, K., Tracy, R., Ferrucci, L., & Walston, J. 2014. Simple 490 biologically informed inflammatory index of two serum cytokines predicts 10 year all‐cause mortality in 491 older adults. The journals of gerontology.Series A, Biological sciences and medical sciences, 69, 165‐173. 492 Wijsman, C. A., Maier, A. B., de Craen, A. J., van den Biggelaar, A. H., & Westendorp, R. G. 2011. An unopposed 493 proinflammatory response is beneficial for survival in the oldest old. Results of the Leiden 85‐plus Study. 494 The journals of gerontology.Series A, Biological sciences and medical sciences, 66, 393‐399. 495 Yudkin, J. S., Kumari, M., Humphries, S. E., & Mohamed‐Ali, V. 2000. Inflammation, obesity, stress and coronary 496 heart disease: is interleukin‐6 the link? Atherosclerosis, 148, 209‐214. 497 498