O
pen
A
rchive
T
OULOUSE
A
rchive
O
uverte (
OATAO
)
OATAO is an open access repository that collects the work of Toulouse researchers and
makes it freely available over the web where possible.
This is an author-deposited version published in : http://oatao.univ-toulouse.fr/
Eprints ID : 12320
To link to this article : DOI :10.1002/asi.22747
URL : http://dx.doi.org/10.1002/asi.22747
To cite this version : Cabanac, Guillaume and Preuss, Thomas
Capitalizing on order effects in the bids of peer-reviewed conferences
to secure reviews by expert referees
. (2013) Journal of American
Society for Information Science and Technology, vol. 64 (n°2). pp.
405-415. ISSN 1532-2882
Any correspondance concerning this service should be sent to the repository
administrator: [email protected]
Capitalizing on Order Effects in the Bids of
Peer-Reviewed Conferences to Secure Reviews
by Expert Referees
Guillaume Cabanac
Computer Science Department, University of Toulouse, IRIT UMR 5505 CNRS, Toulouse, France. E-mail: [email protected]
Thomas Preuss
Department of Informatics and Media, Brandenburg University of Applied Sciences, Brandenburg an der Havel, Germany. E-mail: [email protected]
Peer review supports scientific conferences in selecting high-quality papers for publication. Referees are expected to evaluate submissions equitably according to objective criteria (e.g., originality of the contribution, soundness of the theory, validity of the experiments). We argue that the submission date of papers is a subjective factor playing a role in the way they are evaluated. Indeed, program committee (PC) chairs and referees process submission lists that are usually sorted by paperIDs. This order conveys chronological information, as papers are numbered sequentially upon reception. We show that order effects lead to unconscious favoring of early-submitted papers to the detriment of later-submitted papers. Our point is supported by a study of 42 peer-reviewed conferences in Computer Science showing a decrease in the number of bids placed on submissions with higher paperIDs. It is advised to coun-terbalance order effects during the bidding phase of peer review by promoting the submissions with fewer bids to potential referees. This manipulation intends to better share bids out among submissions in order to attract qualified referees for all submissions. This would secure reviews from confident referees, who are keen on voicing sharp opinions and recommendations (accep-tance or rejection) about submissions. This work contributes to the integrity of peer review, which is man-datory to maintain public trust in science.
Introduction
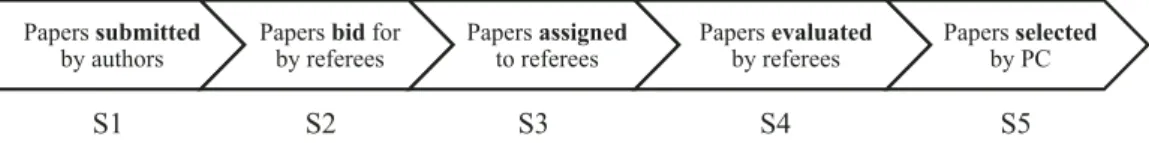
Scientific conferences are premier venues for disseminat-ing the results of late-breakdisseminat-ing research. Published papers are selected through the peer review process, also known as the referee system (Zuckerman & Merton, 1971). Nowa-days, peer-reviewed conferences increasingly rely on paper bids. These are composed of the five stages depicted in Figure 1.
• S1. Authors prepare a paper according to the call for papers issued by a given conference. This document states the topics of the conference, as well as the opening and closing dates for paper submission. Authors are allowed to submit papers any time between these two dates.
• S2. Scientists acknowledged for their expertise in the confer-ence domain (i.e., peers) are invited to review the submitted papers. They are allowed to bid for the papers they would like to evaluate.
• S3. The program committee (PC) chairs assign submissions to peers according to their bids, whenever possible.
• S4. Peers act as referees to evaluate the submissions they were assigned to. They grade papers according to several pre-defined criteria, such as originality and significance of the contributions.
• S5. PC chairs select the papers with best quality according to the evaluations, comments, and recommendations of the referees. These papers are then published in the conference proceedings.
The scientific community and the general public have expectations for peer review. On the one hand, it is expected to act as a fair filter to select papers according to only objective criteria assessing their scientific qualities. On the other hand, peer review is expected to enforce equality
among papers regarding their acceptance or rejection. Unfortunately, various inadequacies affect peer review, such as status bias, gender bias, objectivity bias, and conflict of interests (Zuckerman & Merton, 1971; Benos et al., 2007). Regarding scientific conferences, we argue that the sub-mission date of papers is one extra factor at play during the peer review process. We hypothesize that order effects (Becker, 1954) are introduced when papers are chronologi-cally presented to referees (during S2 and S4) and PC chairs (during S3 and S5). Paper evaluation would then result from objective judgment and from a subjective feature of submit-ted papers: their submission date. Although undocumensubmit-ted to date for peer-reviewed conferences, we believe that this phenomenon is detrimental to the integrity of peer review.
The article is organized as follows. We first discuss how submission dates may affect peer review supported by paper bids through order effects. Then we design a method to check the existence of such order effects on a sample of 42 peer-reviewed conferences from the Computer Science field. The results bolstering this hypothesis are then presented. Finally, we propose to capitalize on order effects to secure reviews from expert referees. This contribution is intended to contribute to ensuring the integrity of peer review.
How Do Submission Dates Challenge Peer Review?
Peer-reviewed conferences have entered the digital age. Most of them are supported by online conference
manage-ment systems nowadays. These systems assign a sequential number called “paperID” to each submitted paper. Then, for any given conference, the list of submissions to review is sorted by paperID. This order conveys chronological clues: the list starts with early-submitted papers and goes on to last-minute submissions at the end. In this section, we argue that order effects may lead scientists to favor (or unfavor) some papers because of their submission date. Such an unfair treatment questions the integrity of peer review.
Peer Review and Conference Management Systems Conferences have become major scientific events attract-ing worldwide audiences. In Computer Science, for instance, “highly selective” conferences receive several hundred submissions, less than 30% of which getting accepted for publication (Chen & Konstan, 2010). This is the case of the three leading conferences shown in Figure 2, for instance. Publishing in such conferences is also appeal-ing because papers in their proceedappeal-ings reach a large read-ership. Freyne, Coyle, Smyth, and Cunningham (2010) reported that these papers receive more citations than jour-nals listed in the bottom half of the ISI Web of Knowledge impact ranking for journals.
Peer review now has become the standard procedure to select papers for publication (Benos et al., 2007). While peer review supports both journals (Cronin, 2011) and confer-ences (Hartvigsen, Wei, & Czuchlewski, 1999), the present study focuses on conferences supported by bids. Papers
FIG. 1. The five usual stages of the peer review process for conference paper selection supported by paper bids.
FIG. 2. Number of papers submitted to three leading Computer Science conferences held between 2007 and 2011. Accepted papers are shown in green,
while rejected papers are shown in blue. (Source: the ACM Digital Library http://dl.acm.org). [Color figure can be viewed in the online issue, which is available at wileyonlinelibrary.com.]
submitted to conferences are assigned to at least two expert referees drawn from the conference PC—when not rejected outright by PC chairs for not complying with the topics of the conference call for papers. Referees assess each paper according to several criteria (e.g., novelty, contribution) before issuing a recommendation (e.g., weak or strong accept, neutral, weak or strong reject). In the end, the scien-tific community expects these recommendations to inform PC chairs when selecting papers with best quality and impact. Running a peer-reviewed conference with several hundred submissions implies the synchronization of the tasks of thousands of people who act as authors, referees, or both. Fortunately, several conference management systems, such as EasyChair, ConfManager, ConfMaster, ConfTool, and Precision Conference (see http://easychair.org, http:// confmanager.com, http://confmaster.net, http://conftool.net, and http://precisionconference.com) have been developed to cope with this daunting task. These websites support the researchers involved in the five stages of the peer review process (Figure 1). For instance, most conference manage-ment systems allow referees to bid on submissions prior to paper assignment (Rodriguez, Bollen, & Van de Sompel, 2007). Then PC chairs rely on referees’ areas of expertise and preferences (deduced from the bids) to assign papers manually or with the help of various algorithms (Wang, Chen, & Miao, 2008). Nowadays, virtually all conferences rely on a conference management system.
What Is Behind PaperIDs?
Conference management systems assign an identifier to each paper submitted to a given conference. This identifier, called paperID, is usually a number starting with 1 if this is the first submission received. Then it is incremented for subsequent submissions. In other words, the n papers sub-mitted to a conference are numbered with paperIDs from 1 to n.
The chronology of submissions is revealed by paperIDs, since they give a clue about the submission date of each paper. Early-submitted papers get low paperIDs (i.e., close to 1), whereas last-minute papers receive high paperIDs (i.e., close to n).
Order Effects on Choice
Various studies have shown that people are influenced by the order of presentation when having to select items from a list according to their preferences.
When desirable items are randomly distributed through-out a list, people still tend to select early positions. Becker (1954) studied the chance of selection of five radio program types (e.g., news, popular music, sports) among 16 radio program types presented to 16,193 people. Two parameters were controlled in this experiment: the order of presentation and the popularity of the program types. These were counterbalanced respectively by a Latin square and by an analysis of variance. The results showed that the
position of items influenced their chance of selection, with early positions attracting significantly more votes than later positions. Becker (1954, p. 276) even noticed that “the later on a check-list that a program type is listed, the less the chance that someone will select it as one of his five favorites.” Such order effects were also found to influence the selection of the names of candidates to elections held in the three largest counties of Ohio in the USA (Miller & Krosnick, 1998).
When desirable items are expected to be ranked at the top of the list, people tend to select early positions even if this condition is not satisfied. For instance, Craswell, Zoeter, Taylor, and Ramsey (2008) conducted an experiment with manipulated results of web search engines. The authors found that users kept clicking on documents from top to bottom of the result list, even if most relevant documents were not at the top of the list.
The “direction of comparison” also has an influence on item evaluation regarding one’s preferences. For instance, when being presented with the sequence of items A and B, subjects are more likely to comment on the positive (i.e., desirable) features of B that were not present in A, unlike when presented with the sequence of items B and A (Bruine de Bruin & Keren, 2003). This has direct implications for the fairness of competitions using jury evaluations (Bruine de Bruin, 2005, 2006).
The familiarity of the person with the judged items seems to play a role in item selection too. About wine tasting, Mantonakis, Rodero, Lesschaeve, and Hastie (2009) found a primacy effect for the general public (i.e., selection of earlier items), whereas expert tasters showed a recency effect (i.e., selection of later items). Various experiments with paintings, American Idol audition clips, jellybeans, and female faces were conducted by Li and Epley (2009). The authors found serial position effects, since people tended to select early items when being presented with globally undesirable items. Conversely, they tended to select later items when presented with globally desirable items.
Finally, people tend to underestimate the time spent choosing from a long list of items (Fasolo, Carmeci, & Misuraca, 2009). Attention decrement and boredom are also human factors contributing to order effects on choice (Mantonakis et al., 2009).
Potential Implications for the Integrity of Peer Review Throughout the peer review process, conference papers are processed by PC chairs and referees. They work with a submission list produced by the conference management system. The n papers of this list are presented chronologi-cally, as the list is sorted by paperID. This order may influ-ence the scientists involved during the various stages of peer review depicted in Figure 1 as follows.
• During S2, referees skim through the submission list, bidding on a handful of papers according to titles and abstracts (full text is usually not provided in S2). Here, referees may feel it
tiresome to get a sense of each paper, as it requires reading titles and abstracts. We may recall the findings of Fasolo et al. (2009) and Mantonakis et al. (2009) about the difficulty of item selection and resulting boredom to support this point. As a result, referees may focus their efforts on papers presented at the top of the list (primacy effect). In addition, since each referee is expected to review k << n papers, the paper pool seems globally undesirable to them. According to the findings of Li and Epley (2009), this may motivate referees to select early-submitted papers (those with low paperIDs). Such a phenomenon is all the likelier with leading conferences total-ing hundreds of papers.
• During S3, PC chairs go through the submission list to assign
k << npapers to each referee. According to our experience, it seems that k = 5 6 2 for most conferences. Again, order effects may arise if PC chairs process the submission list sequentially. Hence, early-submitted papers may be assigned to qualified referees willing to review them, for they have bid on them. Meanwhile, late-submitted papers may be assigned to referees who have not bid on them or who do not have their share of papers to review yet (i.e., assignment by default instead of preference-wise).
• During S4, referees are given the k << n papers for evaluation purposes, with no guarantee that their preferences (i.e., bids) were satisfied. Assigned papers are usually sorted by paperID in the list presented to referees. Here the order in which papers are then evaluated may affect their evaluation (Bruine de Bruin, 2005, 2006).
• During S5, PC chairs repeatedly go through the list of evalu-ated papers to review the referees’ evaluations, to engage discussions on papers with diverging evaluations, and even-tually to decide their rejection or acceptation.
To sum up, order effects may lead referees and PC chairs alike to favor papers submitted early (i.e., listed in low positions) at the expense of papers submitted later (i.e., listed in high positions). Such a different treatment would be detrimental to the peer review process, which is expected to ensure the integrity of science and public trust (Wing & Chi, 2011).
In this article we focus on the issue related to the bids collected during S3. It is our hypothesis that order effects play a role in the way referees place bids on submissions. In the next sections we bolster this hypothesis through explor-atory statistics applied to the logs of peer-reviewed past conferences.
Method
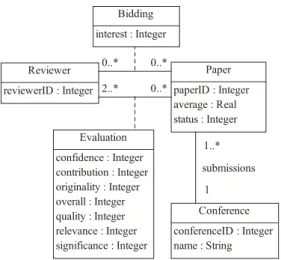
The hypothesis under study applies to conferences imple-menting (P1) a peer-review process supported by (P2) paper bids. We intend to check it against data from past confer-ences complying with P1 and P2. These data currently exist, since they are generated by conference management systems. The UML class diagram in Figure 3 models the data considered in the current study. We discuss it according to the stages of the peer-review process introduced in Figure 1 (terms in italics refer to attributes in the UML diagram).
• S1. Authors submit papers to conferences. Papers are assigned a sequential paperID: the paper submitted first is assigned the value 1, the paper submitted second is assigned the value 2, and so on.
• S2. Referees are presented with the list of the n papers sub-mitted during S1. They are given the opportunity to bid on papers whose subject is interesting or related to their area of expertise. Conversely, referees can state conflicts of interests, limited expertise, or disinterest. These preferences are stored in the interest attribute (positive, neutral, or negative) of the Bidding class.
• S3. PC chairs assign k << n papers to referees according to paper topics, referee areas of expertise, and referee prefer-ences acquired during S2. Each paper is assigned to at least two referees.
• S4. Referees mark papers globally (overall attribute) and detail their evaluation according to several criteria (e.g., value of the contribution, paper originality and quality, relevance to the call of papers, significance of the results). In addition, referees evaluate how confident they are in their review, as a way to state their degree of expertise regarding the evaluated paper. These marks kept in the Evaluation class are usually given on a 7-point Likert (1932) scale (e.g., strong reject, reject, weak reject, neutral, weak accept, accept, strong accept).
• S5. PC chairs proceed through the papers to accept or reject them. They may rely on the average score computed from referees’ weighted marks—the relative importance of each criterion is up to each conference. In the end, each paper has a given status (e.g., accept as full paper, accept as short paper, accept as poster, reject).
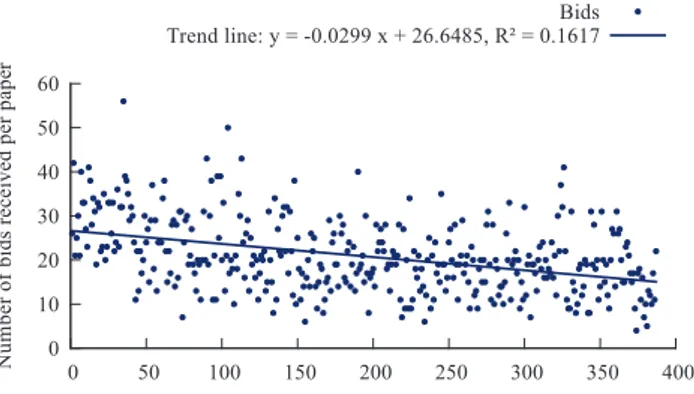
We intend to check whether the submission date of papers (conveyed by paperIDs) is related to the number of bids received. A scatter plot akin to Figure 4 is generated for each conference. The independent variable (x axis) is the position of the paper (i.e., paperID in Figure 3), while the dependent variable (y axis) is the number of bids.
FIG. 3. UML class diagram modeling the data generated by
In addition, the linear regression y = m ¥ x + p is com-puted with standard least squares fitting for estimating m and p. The coefficient of determination R2∈[0,1] associated
with the linear regression measures the goodness of fit (i.e., it is inversely proportional to the squared difference between data points and the trend line). The slope of the trend line (i.e., m) informs us about the relationship between x and y, while the magnitude of R2informs us about the quality of the
approximation of the data points by the trend line (R2→1
shows a better approximation). Figure 4 shows a decreasing number of bids as paper positions increase. In other words, papers with low positions (i.e., early submissions) attract more bids than papers with higher positions (i.e., later sub-missions).
Having approximated the data points of each conference by a single trend line with associated R2, a broader
perspec-tive is then taken by plotting the conference trend lines altogether (e.g., see Figure 14). Each trend line starts at position x = 1, and ends at the highest paper position of the considered conference (i.e., x = n with a different n for each conference). Consequently, conferences with a larger number of papers are represented with longer trend lines.
Finally, the quality of the approximations by trend lines is shown with varying line weights: the stronger the goodness to fit R2, the bolder the trend line. This is to emphasize trend
lines that better approximate the initial data points. Four groups of trend lines are computed according to their R2. The
group with the 25% highest R2is labeled “First quarter of R2”
and plotted in weight 4, while the following 25% is labeled “Second quarter of R2” and plotted in weight 3, and so on. The
overall tendency is then visible by observing all the slopes. In addition, the distribution of slope values is studied via box plots a.k.a. box-and-whisker diagrams (McGill, Tukey, & Larsen, 1978) to assess the skewness of data. Slope values skewed towards negative values show a decrease in the depen-dent variable when the independepen-dent variable (i.e., paper posi-tion) increases, thus supporting our hypothesis.
In the next section we introduce our findings based on the logs of peer-reviewed past conferences with paper bids.
Data and Results
The working hypothesis was tested with data from conference logs. Among the various available conference management systems we retained ConfMaster, for it has been used by 324 conference editions (Conference list: http://confmaster.net/references.php) as of May 2012. Most of them are conferences in Computer Science. The follow-ing sections report statistics about 42 randomly selected peer-reviewed conferences with 157,332 bids placed by 2,989 referees, who wrote 19,108 reviews about 7,351 papers.
Characteristics of the 42 Peer-Reviewed Conferences The ConfMaster team agreed to provide us with anony-mous data related to 42 peer-reviewed conferences drawn from its pool of 324 conferences. These 42 conferences were held between 2003 and 2011 with supporting paper bids. These data match the UML class diagram shown in Figure 3, except for some attributes that were not provided (e.g., conference name, reviewer identity, review contents) for anonymity concerns. We publish this data set called ConfMaster2003–2011 as an Additional Supporting Infor-mation (see Appendix A). This ensures the reproducibility of our results, while enabling other researchers to investigate other aspects of the peer review process from this data set. A total of 7,351 papers were submitted to the 42 confer-ences under study. The box plot in Figure 5 depicts the distribution of the number of papers per conference. As shown by the green box, the middle half of all conferences attracted between 70 and 204 papers (Mdn = 102). The black dots show four outlying conferences that have attracted more than 387 papers.
The distribution of acceptance rates for the 42 confer-ences is shown in Figure 6. Regarding full papers, the middle half of the conferences features a selectivity lying between 14% and 31% (Mdn = 19%). There are three
FIG. 4. Scatter plot for conference number 3,903 (see Appendix A)
showing the number of bids received per paper position, as well as the trend line for the data points (linear least squares regression with associated
coefficient of determination R2). [Color figure can be viewed in the online
issue, which is available at wileyonlinelibrary.com.]
FIG. 5. Box plot of the number of papers submitted to the 42 conferences.
[Color figure can be viewed in the online issue, which is available at wileyonlinelibrary.com.]
FIG. 6. Box plot of full paper acceptance rates for the 42 conferences.
[Color figure can be viewed in the online issue, which is available at wileyonlinelibrary.com.]
outlying conferences with selectivity greater than 51%. Pro-vided that highly selective Computer Science conferences have a 30% or less acceptance rate according to Chen and Konstan (2010), our data set is mainly composed of highly selective conferences.
Characteristics of the 157,332 bids
ConfMaster allows referees to bid on submissions in order to signal positive preference (denoted by + for “interested” and by ++ for “very interested”), negative pref-erence (denoted by - for “dislike”) or conflicts of interests (denoted by ). Overall, 76% of all referees placed a bid on at least one paper, with a median of 12 bids per referee per conference, which corresponds to a median of 5% of all submissions. Figure 7 shows that negative bids and conflicts of interests (56%) were slightly more frequent than positive bids (44%). It is worth noting that nearly half of all bids are negative (-), which suggests that it is simpler for referees to disqualify than to pick papers during S2.
Let us focus on the papers assigned by PC chairs during S3. Figure 8 shows the distribution of the 19,108 reviews with respect to their associated bids, if any (i.e., some papers attracted no bids, others were assigned to referees although
they placed no bids on them). More than half of all reviews were written by referees who placed a positive bid on the evaluated paper. Only 1% of the reviews were done by referees who placed a negative bid on the paper. Only two reviews were done by referees who declared a conflict of interest ( ). This suggests that the current use of negative bids and conflicts of interests (see Figure 7) succeeds in avoiding to assign unwanted papers to referees. Notice that no bids were placed on papers evaluated in 42% of the reviews under study.
It is generally assumed that referees place positive bids on the submissions for which they feel qualified to review (Rodriguez et al., 2007). We wondered whether reviews pre-ceded by a positive bid were likelier to exhibit a strong referee confidence. This point is supported in Figure 9, where reviews following positive bids seem to be associated with higher referee confidence values. As a consequence, encouraging referees to place positive bids may be an effec-tive way to raise reviews with strong confidence.
One way to improve the quality of reviews would be to reduce the large proportion of “orphan” papers, namely, the 42% bid-less reviews (Figure 8). Many factors can lead to bid-less submissions. On the one hand, the topics of some papers simply appeal to no bidders at all. On the other hand, some papers are displayed at the bottom of biddable papers, for they were submitted quite late. In the latter case, the referee may have failed to bid on interesting papers only because of their submission date. Hence, the evaluation of these papers would partly depend on their submission date.
FIG. 7. Distribution of the 157,332 bids placed by referees with respect to
the interest value (i.e., , -, +, or ++). [Color figure can be viewed in the online issue, which is available at wileyonlinelibrary.com.]
FIG. 8. Distribution of the 19,108 reviews with respect to the nature of the
bid (if any) placed by the referees in charge of writing the reviews. [Color figure can be viewed in the online issue, which is available at wileyonlinelibrary.com.]
FIG. 9. Confidence of referees as stated in the reviews they made for
papers they bid on (with a given interest value) and were assigned to. The mean (m) and the standard deviation (s) of confidence values are showed by bullets (m) and bars (m 6 s). [Color figure can be viewed in the online issue, which is available at wileyonlinelibrary.com.]
Characteristics of the 19,108 Reviews
Each review conveys a referee’s evaluation of a paper to which an overall mark is assigned (i.e., an integer value between 1 and 10). Marks 3 and 4 are the most frequent ones, accounting for 37% of all marks (Figure 10). Such a high proportion of low overall marks suggests that most submissions show poor quality and do not deserve publica-tion. This quality issue may be one factor explaining the low acceptance rates reported by Chen and Konstan (2010) for Computer Science.
In addition to their comments and overall mark, referees also estimate their confidence in the review through an integer value ranging from 1 to 10. The distribution of confidence values shown in Figure 11 suggests that 50% of all referees were not very confident (i.e., confidence values from 1 to 5) in their review. Half of all reviews were thus written by researchers who admitted to being marginally expert and who signaled that their review was possibly marginally relevant. In our view, this finding calls for a more effective assignment of papers to referees in order to increase the number of reviews with high levels of confidence.
Having papers reviewed by confident referees is prefer-able for authors (who get more trustworthy remarks) and for PC chairs (who make wiser decisions when relying on
trustworthy recommendations). The study of overall marks with respect to referee confidence suggests that confident referees are willing to give higher (lower) marks when papers deserve it. Moreover, confident referees seem to use a larger palette of marks to grade papers. These points are illustrated in Figure 12, where bullets show the mean overall mark (m) per confidence value and the bars extend to the standard deviation (s) from the mean (i.e., a bar is m + s long). In other words, it seems that confident reviewers use the strong reject and strong accept marks more often than less confident referees, who stick to the less controversial weak accept, weak reject, and neutral marks.
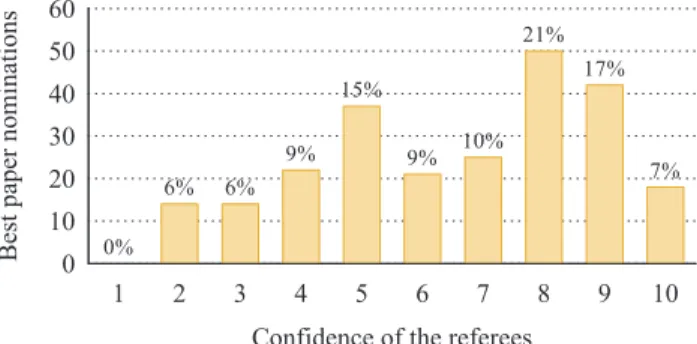
We extended our study by looking at the number of best paper nominations according to referee confidence. Such nominations appeared in 1% of all reviews only. As shown in Figure 13, nearly half of all nominations are granted in reviews from confident referees (with confidence values between 8 and 10, which only accounts for 26% of all reviews). This finding supports the idea that confident referees are keen on voicing strong support for the papers showing best quality.
This article questions order effects in the referee bids. We investigate this issue in the next section.
Evidence of Order Effects in the Referee Bids of Conferences
Let us recall the hypothesis under study: order effects play a role in the way referees place bids on submissions. The relationship between the submission dates of papers (as
FIG. 10. Distribution of the 19,108 reviews with respect to the overall
mark that referees gave to papers. [Color figure can be viewed in the online issue, which is available at wileyonlinelibrary.com.]
FIG. 11. Distribution of the 19,108 reviews with respect to referee
confidence. [Color figure can be viewed in the online issue, which is available at wileyonlinelibrary.com.]
FIG. 12. Overall mark given to papers by referees according to their
confidence (N = 19,108 reviews). The mean (m) and the standard deviation (s) of overall mark values are showed by bullets (m) and bars (m 6 s). [Color figure can be viewed in the online issue, which is available at wileyonlinelibrary.com.]
an independent variable) and the number of bids received during step S2 of the peer-review process (as a dependent variable) is studied in this section. As a reminder, note that referees can only consult the titles and abstracts of the sub-missions during S2, which gives no clue to them about their quality. Consequently, paper quality plays no role in the bidding behavior of referees.
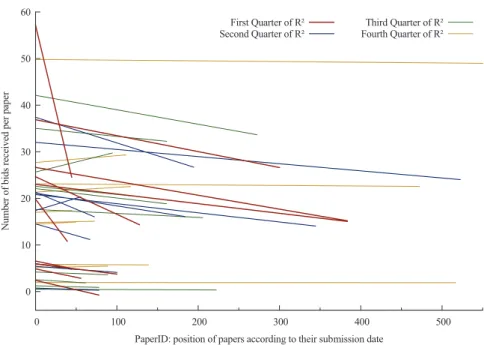
Figure 14 shows the 42 bidding trend lines. There are 33 conferences (79%) with trend lines showing a negative slope. For these conferences, the number of bids decreases with higher paperIDs. In order to further the analysis, the distribution of trend line slopes is plotted in Figure 15. The box plot shows that the middle half of the 42 conferences has negative slopes. Moreover, the distribution of slopes is skewed towards negative values. This finding supports the aforementioned hypothesis, since early submitted papers seem to generally have received more bids than later submissions.
What are the implications of this finding for the integrity of peer-reviewed conferences? First, papers with positive bids tend to get reviewed by referees with higher confidence (Figure 9). Second, referees with higher confidence are keen on grading good quality papers with higher marks (Fig-ure 12). They even nominate best papers more frequently (Figure 13). According to these two points, we may con-clude that it is best for a paper to attract a large number of bids. Yet, because of order effects related to their submission date, the papers at the bottom of the submission list are likely to attract fewer bids than the papers at the top of the list. This difference in treatment due to a feature of papers unrelated to quality (i.e., their submission date) is detrimen-tal to the integrity of peer review, which is expected to be impartial.
Limitation
There is a convenient feature in ConfMaster that enables users to filter submission lists according to given keywords. Consequently, some of the referees involved in the ConfMaster2003–2011 data set may not have skimmed a submission list for bidding; they may have filtered it thanks
to keywords representing their domain of expertise instead. Unfortunately, there is no way to know how each referee performed the bidding task: by skimming papers, by filter-ing papers, or both. As a result, our findfilter-ings may underes-timate the effects of submission dates on the peer review process.
Discussion
One may believe that order effects in referee bids do not apply to the conferences run without any bid process (i.e., no S2). Yet this task is devoted to PC chairs, who are in charge of assigning papers to each referee according to their esti-mated area of expertise. It is likely that PC chairs skimming repeatedly through the list of submissions (sorted by PaperID) are sensitive to the order effects that were at stake for referees when bidding (during S2). As a result, peer-reviewed conferences with or without a bid process alike may need to control order effects.
Let us introduce a solution to prevent order effects from affecting peer review through conference manage-ment systems. The proposed solution is threefold, as we recommend:
1. The generation of random alphanumerical paperIDs instead of current numerical paperIDs generated sequen-tially. The comparison of paperIDs should not inform people about which paper was submitted before others, hence the need for randomization. Since people may still be tempted to (wrongly) infer precedence from the comparison of numbers, we advise to generate random alphanumerical strings (e.g., r3a). Such identifiers of three characters can encode up to (26 + 10)3
= 46,656 submissions, which seems enough for any peer-reviewed conference.
2. The promotion of bid-less papers during S2. We intend to counterbalance order effects to improve peer review. Since we know that positions at the top of the submission list attract more bids (Figure 14), we should make the most of these positions to advertise “orphan” papers (i.e., those attracting few or no bids). In practical terms, sub-missions should be sorted by the number of bids they have attracted so far (in ascending order). Tied documents (i.e., those with the same number of bids) should be random-ized to avoid order effects once again. The submission list should be re-sorted anytime it is accessed by a referee during S2. Then, it is expected that the advertised (i.e., top-listed) orphan papers will attract more bids from the referees. Eventually, the number of bids per submission will stabilize (unlike the current negative trend slopes in Figure 14). This will help PC chairs when assigning papers manually or automatically (Wang et al., 2008). This simple manipulation of the submission list will con-tribute to counterbalancing the aforementioned undesir-able order effects.
3. The randomization of submission lists anytime they are displayed during S3 and S5. Order effects in choice should be avoided by shuffling submission lists used by both referees and PC chairs. As Bruine de Bruin (2005, p. 245) puts it about jury evaluations, “randomization
FIG. 13. Distribution of the 243 best paper nominations (among 19,108
reviews) with respect to referee confidence. [Color figure can be viewed in the online issue, which is available at wileyonlinelibrary.com.]
cannot reduce potential order effects, but it does give candidates an equal chance of being assigned to preferred serial positions.”
These three recommended changes seem fairly easy to implement in current conference management systems. We believe that they would help improve the integrity of peer-reviewed conferences by ensuring equal treatment of all submitted papers.
Conclusion
The scientific community and the general public trust the peer review process to select high-quality scientific papers. However, it is now established that peer review suffers from several inadequacies (Zuckerman & Merton, 1971; Benos et al., 2007). It is of paramount importance to study and report such issues. Scientists, aware of these pitfalls, can and should take action to avoid them, thus contributing to the integrity of peer review.
In this article we focused on peer-reviewed conferences supported by paper bids. We developed the idea that order effects play a role in the way referees place bids on submis-sions. We failed to find any work documenting this issue in
the literature. A random sample of 42 peer-reviewed confer-ences in Computer Science totaling 7,351 papers was studied. We found a decreasing trend in paper bids with respect to paper submission dates. This result has several implications for the integrity of peer review. Indeed, papers attracting many bids tend to be assigned to expert referees, who are keen on voicing sharp recommendations (rejection or acceptation). Consequently, late submissions (attracting fewer bids than early submissions) are at a disadvantage compared to early submissions because of order effects related to submission dates.
We discussed a solution to prevent this issue during the bidding phase (S2) of conference peer review: counterbal-ance the observed order effects by manipulating the order of papers listed in submission lists. We advised using first positions to promote the submissions with fewer bids. The list should be reordered according to this criterion any time a referee skims it for bidding purposes. This intends to globally smooth the number of bids per paper, which fosters in turn the distribution of papers to expert referees willing to review the papers (as they placed bids on them). As a result, we capitalize on order effects in referee bids to secure reviews by expert referees. In addition, we suggest assigning randomized paperIDs to overcome order effects during S3, as well as the randomization of evaluated papers during S5 whenever they are accessed through conference manage-ment systems.
Following the recommendations of Hanson, Sugden, and Alberts (2011) and Borgman (2012), the ConfMaster2003– 2011 data set used in this study is published online as an Additional Supporting Information (Appendix A). This is to ensure reproducibility, while fostering research on peer
FIG. 14. Trend lines for bids given to papers submitted to the 42 peer-reviewed conferences. Line width is proportional to goodness of fit (R2). Note that
the x axis is cut at position 550 for readability concerns (only one conference has 831 papers). [Color figure can be viewed in the online issue, which is available at wileyonlinelibrary.com.]
FIG. 15. Box plot of the trend line slopes for paper bids shown in
Figure 14. [Color figure can be viewed in the online issue, which is available at wileyonlinelibrary.com.]
review as implemented by current scientific conferences. Further research should address a larger body of conferences from Computer Science, as well as from all other domains of science.
Acknowledgments
We thank Prof. Claude Chrisment and Dr. Gilles Hubert of the University of Toulouse for valuable suggestions and discussions. We also thank Dr. Nadia Yassine-Diab of the University of Toulouse for improving the linguistic content of the article.
References
Becker, S.L. (1954). Why an order effect. Public Opinion Quarterly, 18(3), 271–278. doi:10.1086/266516
Benos, D.J., Bashari, E., Chaves, J.M., Gaggar, A., Kapoor, N., LaFrance, M., . . . Zotov, A. (2007). The ups and downs of peer review. Advances in Physiology Education, 31(2), 145–152. doi:10.1152/advan.00104.2006 Borgman, C.L. (2012). The conundrum of sharing research data. Journal of
the American Society for Information Science and Technology, 63(6), 1059–1078. doi:10.1002/asi.22634
Bruine de Bruin, W. (2005). Save the last dance for me: Unwanted serial position effects in jury evaluations. Acta Psychologica, 118(3), 245–260. doi:10.1016/j.actpsy.2004.08.005
Bruine de Bruin, W. (2006). Save the last dance II: Unwanted serial position effects in figure skating judgments. Acta Psychologica, 123(3), 299–311. doi:10.1016/j.actpsy.2006.01.009
Bruine de Bruin, W., & Keren, G. (2003). Order effects in sequentially judged options due to the direction of comparison. Organizational Behavior and Human Decision Processes, 92(1–2), 91–101. doi:10.1016/ S0749-5978(03)00080-3
Chen, J., & Konstan, J.A. (2010). Conference paper selectivity and impact. Communications of the ACM, 53(6), 79–83. doi:10.1145/1743546. 1743569
Craswell, N., Zoeter, O., Taylor, M., & Ramsey, B. (2008). An experimen-tal comparison of click position-bias models. WSDM (’08): Proceedings of the first ACM international conference on web search and data mining (pp. 87–94). New York: ACM.
Cronin, B. (2011). Peer review. Journal of the American Society for Information Science and Technology, 62(7), 1215. doi:10.1002/asi. 21565
Fasolo, B., Carmeci, F.A., & Misuraca, R. (2009). The effect of choice complexity on perception of time spent choosing: When choice takes longer but feels shorter. Psychology and Marketing, 26(3), 213–228. doi:10.1002/mar.20270
Freyne, J., Coyle, L., Smyth, B., & Cunningham, P. (2010). Relative status of journal and conference publications in Computer Science. Communications of the ACM, 53(11), 124–132. doi:10.1145/1839676. 1839701
Hanson, B., Sugden, A., & Alberts, B. (2011). Making data maximally available. Science, 331(6018), 649. doi:10.1126/science.1203354 Hartvigsen, D., Wei, J.C., & Czuchlewski, R. (1999). The conference
paper-reviewer assignment problem. Decision Sciences, 30(3), 865– 876. doi:10.1111/j.1540-5915.1999.tb00910.x
Li, Y., & Epley, N. (2009). When the best appears to be saved for last: Serial position effects on choice. Journal of Behavioral Decision Making, 22(4), 378–389. doi:10.1002/bdm.638
Likert, R. (1932). A technique for the measurement of attitudes. Archives of Psychology, 22(140), 1–55.
Mantonakis, A., Rodero, P., Lesschaeve, I., & Hastie, R. (2009). Order in choice: Effects of serial position on preferences. Psychological Science, 20(11), 1309–1312. doi:10.1111/j.1467-9280.2009.02453.x
McGill, R., Tukey, J.W., & Larsen, W.A. (1978). Variations of box plots. The American Statistician, 32(1), 12–16. doi:10.2307/2683468 Miller, J.M., & Krosnick, J.A. (1998). The impact of candidate name order
on election outcomes. Public Opinion Quarterly, 62(3), 291–330. doi:10.1086/297848
Rodriguez, M.A., Bollen, J., & Van de Sompel, H. (2007). Mapping the bid behavior of conference referees. Journal of Informetrics, 1(1), 68–82. doi:10.1016/j.joi.2006.09.006
Wang, F., Chen, B., & Miao, Z. (2008). A survey on reviewer assignment problem. In N. Nguyen, L. Borzemski, A. Grzech, & M. Ali (Eds.), IEA/AIE (’08): Proceedings of the 21st international conference on industrial, engineering and other applications of applied intelligent systems (Vol. 5027, pp. 718–727). Berlin: Springer. doi:10.1007/978-3-540-69052-8_75
Wing, J.M., & Chi, E.H. (2011). Reviewing peer review. Communications of the ACM, 54(7), 10–11. doi:10.1145/1965724.1965728
Zuckerman, H., & Merton, R.K. (1971). Patterns of evaluation in science: Institutionalisation, structure and functions of the referee system. Minerva, 9(1), 66–100. doi:10.1007/BF01553188
Appendix A. The ConfMaster2003–2011 Data set of 42 Peer–Reviewed Conferences
The data set is supplied as an XML file, and released as an online Additional Supporting Information to this article (Appendix S1). An excerpt of the data set is shown in Listing 1, where the document type definition (DTD) precedes the records of the 42 peer-reviewed conferences.
Listing 1
<
!--ConfMaster2003-2011: 42 peer-reviewed conferences held between 2003 and 2011 License: Creative Commons Attribution-ShareAlike 3.0 Unported License.
(see http://creativecommons.org/licenses/by-sa/3.0) @version 08-MAR-2012
@author Guillaume Cabanac ([email protected]) @author Thomas Preuss ([email protected])
<!DOCTYPE confmaster [
<!ELEMENT confmaster (conference+)> <!ELEMENT conference (submission+)>
<!ELEMENT submission (average,status,review*,bid*)>
<!ELEMENT review (confidence,overall,bestPaperNomination)> <!ELEMENT bid EMPTY>
<!ELEMENT average (#PCDATA)>
<!ELEMENT status (#PCDATA)> <!-- 1 = accept as full paper --> <!ELEMENT confidence (#PCDATA)>
<!ELEMENT overall (#PCDATA)> <!ELEMENT bestPaperNomination (#PCDATA)>
<!ATTLIST conference id CDATA #REQUIRED>
<!ATTLIST submission id CDATA #REQUIRED>
<!ATTLIST review idReferee CDATA #REQUIRED>
<!ATTLIST bid idReferee CDATA #REQUIRED
interest (-2|-1|1|2) #REQUIRED> ]> <confmaster> <conference id=”108”> <submission id=”1”> <average>6.84</average> <status>1</status> <review idReferee=”6653”> <confidence>8</confidence> <overall>8</overall> <bestPaperNomination>N</bestPaperNomination> </review> <!-- . . . --> <review idReferee=”8798”> <confidence>3</confidence> <overall>6</overall> <bestPaperNomination>N</bestPaperNomination> </review>
<bid idReferee=”6399” interest=”2” /> <bid idReferee=”6400” interest=”1” /> <!-- . . . -->
<bid idReferee=”8809” interest=”-1” /> </submission> <!-- . . . --> <submission id=”869”> <!-- . . . --> </submission> </conference> <!-- . . . --> </confmaster>

![FIG. 11. Distribution of the 19,108 reviews with respect to referee confidence. [Color figure can be viewed in the online issue, which is available at wileyonlinelibrary.com.]](https://thumb-eu.123doks.com/thumbv2/123doknet/3525531.103167/8.892.468.816.114.436/distribution-reviews-respect-referee-confidence-color-available-wileyonlinelibrary.webp)