To link to this article : DOI:10.2166/wst.2013.380
URL :
http://dx.doi.org/10.2166/wst.2013.380
This is an author-deposited version published in:
http://oatao.univ-toulouse.fr/
Eprints ID: 10027
To cite this version:
Nouasse, Houda and Chiron, Pascale and Archimède, Bernard A flood
lamination strategy based on transportation network with time delay. (2013)
Water Science and Technology, vol. 68 (n° 8). pp. 1688-1696. ISSN 0273-1223
O
pen
A
rchive
T
oulouse
A
rchive
O
uverte (
OATAO
)
OATAO is an open access repository that collects the work of Toulouse researchers
and makes it freely available over the web where possible.
Any correspondence concerning this service should be sent to the repository
administrator:
[email protected]
!A
flood lamination strategy based on transportation
network with time delay
H. Nouasse, P. Chiron and B. Archimède
ABSTRACT
Over the last few years, the frequency and intensity of floods has become more marked due to the influence of climate change. The engendered problems are related to the safety of goods and persons. These considerations require predictive management that will limit water height
downstream. In the literature, numerous works have described flow modeling and management. The work presented in this paper is interested in quantitative management by means of flood expansion areas placed along the river and for which we have size and location. The performance of the management system depends on the time and height of gate opening, which will influence wave mitigation. The proposed management method is based on use of a transportation network with time delay from which the volume of water to be stored is calculated.
H. Nouasse (corresponding author) P. Chiron B. Archimède University of Toulouse, INPT, ENIT, LGP, 65016 Tarbes, France E-mail: [email protected]
Key words|flood lamination, network modeling, time delay, transportation networks
INTRODUCTION
On October 20, 2012, heavy rains fell on the Pyrenean foothills. The flood of the Gave de Pau river overwhelmed the bottom of Lourdes city and the sanctuary. In the night, the Gave overflowed and the Grotto was flooded. The altar of the Grotto was actually submerged by water. Flooding due to excessive rainfall and surface runoff can cause sig-nificant damage, loss of property and injuries around the world. To prevent these problems, river systems are increasingly equipped with means for detecting floods, and floodplains are sized and positioned according to the topography.
Flood management requires increased reactivity as com-pared to other management methods based on planning where the necessary data are known a priori. Indeed, man-agers must take important decisions quickly in an uncertain context, because most of these floods are induced by abrupt climatic phenomena, and their magnitude is diffi-cult to accurately assess. Recent studies on climatic changes indicate the impact of this phenomenon on flood magnitude and severity (Knox ; Molnar ; Booij ). Other studies focus on the inclusion of this factor in the methods of assessment and management of floods (Burrel et al. ;Morita ;Gilroy & McCuen ). The integration of adapted digital tools to these crises is relevant and
necessary to improve decision-making (Kracman et al. ; Wang et al. ). The difficulty is related to the choice of the optimization model associated with the man-agement method, which depends on device characteristics, data availability, goals to achieve and constraints to be satis-fied. In the literature, different optimization techniques are proposed to help flood management among which we can mention: linear programming (Needham et al. ), non-linear programming (Floudas et al. ; Bemporad et al. ), multiobjective optimization (Fu ) or genetic algor-ithms (Cai et al. ). Some heuristics are also used to deal with this management, notably algorithms for flow maximiz-ing (Ahuja et al. ;Gondran & Minoux ;Bertsekas ). Unfortunately, the management methods based on algorithms for flow maximizing do not take into account the transfer time of water volumes.
Thus, the objective of this paper is to describe a method for managing storage of volume displaced in expansion areas, which are available along a watercourse in a river system. The proposed method is based on the transport net-works with delay. The paper is organized as follows. The second section describes the flood-diversion-area (FDA) system. The third section gives the main definitions of network flow modeling with time delay. A three-flood-diversion-area
system modeling is detailed. In the fourth section, the simulation results during a flooding period are displayed and discussed. Finally, the conclusion summarizes the interest of the proposed flood lamination strategy combined to the one-dimensional (1D) simulator and suggests some future work.
FLOOD-DIVERSION-AREA SYSTEM
A FDA system consists of a series of nGFDAs distributed
along the river. A FDA is a floodplain area equipped with a controlled gate. The gate opening creates depression waves that interfere with the flood wave to reduce peak flood discharges. To illustrate our approach we use a simpli-fied example, with nG¼ 3, of a river as a benchmark.
A river reach with three lateral floodplain areas (FDA1,
FDA2, FDA3) is assumed (see Figure 1). The river and the
floodplains are separated by levees everywhere except at certain points where they are connected through a gate, Gr, r ¼ 1,2,3. These vertical levees are high enough for
avoid-ing overflow. For simulation purposes, this river is modeled using 1D shallow water equations (Garcia-Navarro et al. ).
The equations of unsteady open channel flow can be derived, for instance, from mass and momentum control volume analysis and modeled under the St Venant hypoth-eses. The 1D unsteady shallow water flow can be written in the form: @A @t þ @Q @x¼ 0 (1) @Q @t þ @ @x Q2 A þ gI1 ! " ¼ gI2þ gA S0# Sf # $ (2)
which emphasizes the conservative character of the system in the absence of source terms. The effects of the wind as well as those of the Coriolis force have been neglected and no lateral inflow/outflow is considered. In (1), A is the wetted cross sectional area, Q is the discharge, g is the acceleration due to gravity, S0 is the bed slope and Sf is
the friction slope. I1 and I2 represent hydrostatic pressure
force integrals.
We assume that τris the transfer time from the gate Grto
the following gate Grþ1.
TRANSPORTATION NETWORK DESIGN INCLUDING TIME DELAY
In previous work (Nouasse et al. ), in order to model our benchmark, we proposed the use of a static transportation network, where we assume that τ1¼ 0 and τ2¼ 0. The
problem was formulated as a Min-Cost-Max-Flow problem that minimizes a linear cost function subject to the con-straints of flow conservation and minimal and maximal capacities. In this formulation we tried to determine an opti-mal lamination flow that satisfies physical constraints required by a flood scenario and the optimization method management parameters. In order to improve the manage-ment method, we propose to study the impact of time delay on a temporized transportation network.
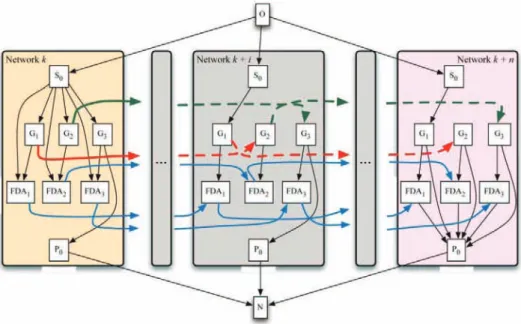
We study the evolution of the state of our flood-diversion-area system at each kTc, k ¼ 0,…,n in the horizon Hfwith
Hf¼ n × Tc, n ∈ Nþ, using the temporized transportation
network G given in Figure 2. It can be seen as a dynamic flow network (Köhler et al. ; Melkonian ) com-posed by interconnected static sub-networks. These connections allow for model temporization.
The network G ¼ fN ; Ag where N is a set of 8 × n þ 1ð Þ þ 2 nodes defined as follows:
•
Gkr represents the gate Grat k, with r ¼ 1,…,nG;•
FDAkr is the FDArat k;•
Sk0 is a source node corresponding to the fictive entrypoint of our FDAs system at k;
•
Pk0is a sink node corresponding to the fictive exit point ofour FDAs system at k;
•
O is an extra source node corresponding to the fictiveentry point of our transportation network whatever the period is;
•
P is an extra sink node corresponding to the fictive exitpoint of our transportation network whatever the period is.
These nodes are associated to the set of valued arcs A describing the following connections:
•
Between the nodes Gkr and Gkþkrþ1r such as k ¼ 0,…,n#krwith τr¼ krTcand r ¼ 1,…,nG#1. It carries the delayed
dis-charge that passes by between the gate Grand the gate
Grþ1. This kind of arc is designed as type 1 arcs in the
following.
•
Between Gkr and Pk0, with r ¼ 1,…,nG#1, and k ¼ n#krþ1,…,n, it represents the flow-rate downstream the exit point of our FDAs system when this discharge is not stored in the FDAkr.
•
Between GknGand Pk0, with k ¼ 0, . . . , n, it represents the flow-rate downstream the exit point of our FDAs system when this discharge is not stored in the FDAknG.•
Between nodes Sk0and Gk1is the flow Qinput(k) at the entrypoint that is always transferred towards the gate G1.
•
Between nodes Sk0 and Gkr, with k ¼ 0,…krand r ¼ 2,…,nG, takes into account at initialization the flow upstream
the gate Grin the FDAs system.
•
Between nodes S00 and FDA0r, it takes into account thewater volume already stored in the FDAr at the
initialization.
•
Between nodes Gkr and FDAkr, connects each gate with itsFDA, and represents the flow crossing the gate Gr
towards the FDArat the end of each period k.
•
Between nodes FDAkr and FDAkþ1r , with k ¼ 0,…,n#1indicates that the water stored in the FDArat the end of
the period k is available at the beginning of period k þ 1. This kind of arc is designed as type 2 arcs in the following.
•
Between nodes FDAnr and Pn0, respects transportationnet-work conservation flow rules.
In each sub-network there is no transfer time between the different nodes. Transfer times are introduced by connecting the different sub-networks with type 1 and type 2 arcs.
The use of such a model requires that transfer times are static from a layer to another in the set Hfwhile they depend
on the flow-rate, which changes over time. Moreover, this kind of model, depending on the size of the time horizon
Hfand the period Tc, can lead to an oversize transportation
network.
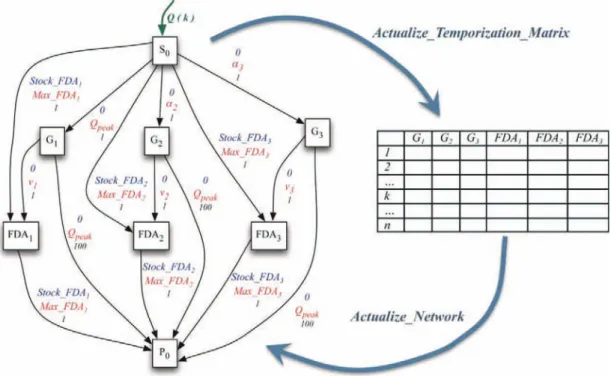
Herein, in order to overcome these two points we propose a reduced size model (seeFigure 3), which allow-s enhancing the temporized network: more dynamic and suitable for various river sections with variable transfer time. This reduced transportation network is obtained by the conservation of nodes number of a sub-network, by the fusion of all the different sub-networks of our previous model and by eliminating arcs between sub-networks. In this reduced size model, link between layers are represented through a matrix and thus the transportation network com-municates with this matrix where the values of delayed flow are stored. InFigure 3, for each arc, its maximum capacity is written beneath its minimum capacity, and its cost is written lowermost. The flood-lamination algorithm described in
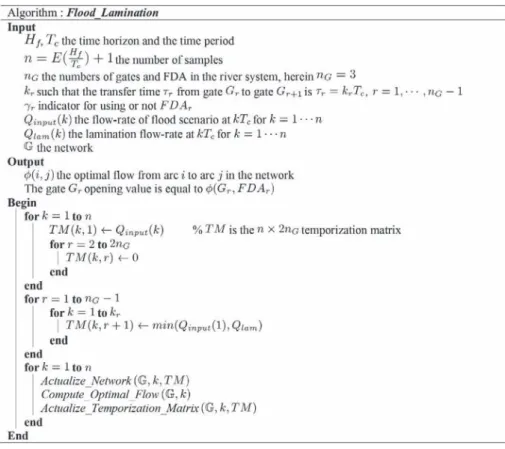
Figure 4uses all these arc values in order to derive the gate opening set-point values. In the flood-lamination algorithm, after an initialization phase, at each kTc, the network is
actua-lized (see Figure 5), the optimal flow is computed and the temporization matrix is actualized (seeFigure 6).
In order to compute the optimal flow, the Min cost Max flow problem resolution for this reduced size temporized network is done, using a linear programming formulation (as described inNouasse et al. ()), according to our man-agement objectives. In the algorithms:
Q(k) is the discharge entering the network at kTc.
Qpeakis the maximum peak flow-rate of flood scenario.
Max_FDAris the maximum FDArstorage capacity,
depend-ing on Qpeak.
vr is the maximal capacity on the arc between the gate Gr
and the FDAr.
γris a strategy parameter with
γr¼
0 if decision is not to stock water in FDAr
1 if decision is to stock water in FDAr
%
Qlamis the lamination discharge chosen by the river system
manager and defined as the discharge level at which the river flow-rate must be laminate, i.e. the hydraulic set point over the foreseen horizon Hf.
Stock_FDAr is the minimum capacity on the arc between
the source S0 and the FDAr. It corresponds to the
amount of water already present in the FDAr.
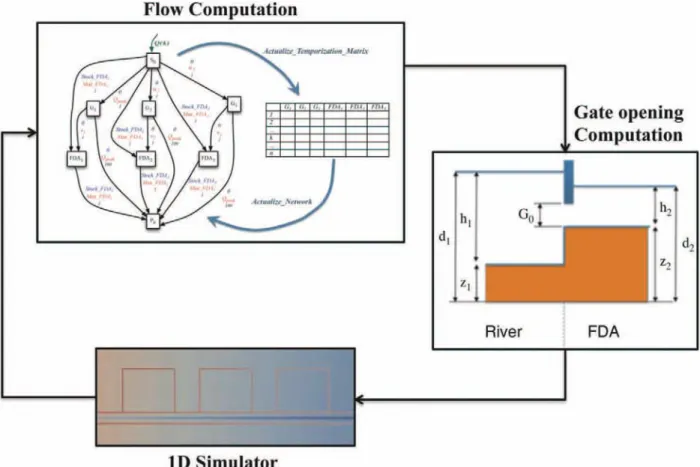
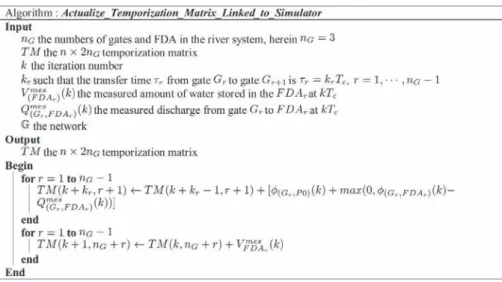
The dynamic reduced size network has been connected to the 1D simulator (developed by Garcia-Navarro et al. ()), in order to update flow and water quantity stocked with measured values. The scheme used is given inFigure 7
and the algorithm for actualization of temporized matrix is modified as given inFigure 8.
Figure 4 Flood lamination algorithm.
COMPUTATIONAL RESULTS
We present some results obtained using the method where our network model is connected with the 1D hydraulic
simulator. The network model allows calculation of the opti-mal flow-rate which will be used in the calculation of the opening gate of the FDAs by means of a static inversion of the free flow open channel equations (Litrico et al. ).
Figure 6 Actualization temporization matrix algorithm.
In Figure 9(a)the Qinput and the Qoutput show the results
obtained by applying the flood lamination strategy with the network delay model, for Qlam¼ 650 m3/s. The stored
water volume in the FDAs is plotted in Figure 9(b). In
Figures 9(c),9(d)and 9(e)the gate opening values and the water levels d1 (forward the gate) and d2 (backward the
gate) measured with regard to the river bed are displayed for gates 1, 2 and 3 respectively. The values of τ1¼ 11Tc
Figure 8 Actualization temporization matrix algorithm.
Figure 9 Simulation results forτ1¼ 11Tc,τ2¼ 15Tc. (a) Qinputdischarge upstream the river, Qoutputdischarge downstream and Qlamlamination set point. (b) Sum of volumes stored in all
and τ2¼ 15Tc were estimated by an empirical method for
Tc¼ 100 s; however, methods like the one developed in
(Romera et al. ) can be used.
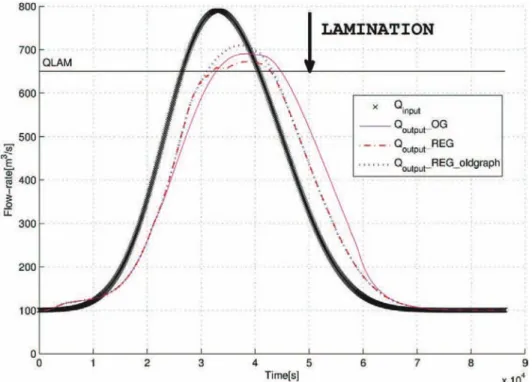
Simulations were done for the same input scenario (i.e. values of Qinput) and for Qlam¼ 650 m3/s for three
differ-ent regulation strategies. Results are given inFigure 10. Qinput
is the thick line with crosses, and Qoutputis displayed as:
•
thin line (Qoutput_OG) in the case where gates were alwaysopen;
•
vertical dashes (Qoutput_REG_oldgraph) in the case where thelamination strategy proposed inNouasse et al. () was applied;
•
horizontal dashes with dots (Qoutput_REG) in the casewhere the lamination strategy with the network delay model proposed here was applied.
The peak flood discharge reduction is better in the latter case.
CONCLUSION AND FUTURE WORK
A transportation network including time delay was pre-sented in order to perform flood lamination strategy to control a river system equipped with flood diversion areas. A reduced graph with temporization matrix mechanism
was proposed in order to take into account the discharge dependent transfer times. Results obtained with this strategy including only the water storage were discussed. The strat-egy can be improved by defining a Qlam value for each
gate according to water levels, and by modeling the release of water from the FDAs to the river. Furthermore, beyond quantitative flood management an important problem to address is the quality of water in the river and in the FDAs. These extensions will be studied in future work.
ACKNOWLEDGEMENTS
This research has been partially funded by Conseil Régional de Midi-Pyrénées in the CTP project entitled GECOZI (10020528). The authors want to thank Confederación Hidrográfica del Ebro for providing the case study used in this paper as well as for sharing their hydrological manage-ment expertise and Fluid Mechanics, LIFTEC-EINA, University of Zaragoza for providing the 1D simulator.
REFERENCES
Ahuja, R. K., Magnanti, T. L. & Orlin, J. B. Network Flows:
Theory, Algorithms, and Applications. Prentice Hall, Upper
Saddle River, NJ, USA. Figure 10 Comparison of simulation results for Qlam¼ 650 m3/s.
Bemporad, A., Casavola, A. & Mosca, E. Nonlinear control of constrained linear systems via predictive reference
management. IEEE Transactions on Automatic Control 42(3), 340–349.
Bertsekas, D. Network Optimization: Continuous and
Discrete Models. Athena Scientific, Belmont, Mass., USA.
Booij, M. J. Impact of climate change on river flooding assessed with different spatial model resolutions. Journal of
Hydrology 303 (1–4), 176–198.
Burrel, B. C., Davar, K. & Hughes, R. A review of flood management considering the impacts of climate change.
Water International 32 (3), 342–359.
Cai, X., McKinney, Daene C. & Lasdon, Leon S. Solving nonlinear water management models using a combined genetic algorithm and linear programming approach.
Advances in Water Resources 24 (6), 667–676.
Floudas, C. A., Aggarwal, A. & Ciric, A. R. Global optimum search for nonconvex NLP and MINLP problems.
Computers & Chemical Engineering 13 (10), 1117–1132.
Fu, G. A fuzzy optimization method for multicriteria decision making: an application to reservoir flood control operation.
Expert Systems with Applications 34 (1), 145–149.
Garcia-Navarro, P., Brufau, P., Burguete, J. & Murillo, J. The shallow water equations: an example of hyperbolic system.
Monografias de la Real Academia de Ciencias de Zaragoza
31, 89–119.
Gilroy, K. L. & McCuen, R. H. A nonstationary flood frequency analysis method to adjust for future climate change and urbanization. Journal of Hydrology 414–415, 40–48. Gondran, M. & Minoux, M. Graphs and Algorithms. Eyrolles,
Paris, France.
Knox, J. C. Large increases in flood magnitude in response to modest changes in climate. Nature 361 (6411), 430–432.
Köhler, E., Langkau, K. & Skutella, M. Time-expanded graphs for flow-dependent transit times. Algorithms—ESA 2002, 1–18. Kracman, D. R., McKinney, D. C., Watkins Jr D. W. & Lasdon, L. S. Stochastic optimization of the highland lakes system in Texas. Journal of Water Resources Planning and
Management 132 (2), 62–70.
Litrico, X., Malaterre, P., Baume, J.-P. & Ribot-Bruno, J.
Conversion from discharge to gate opening for the control of irrigation canals. Journal of Irrigation and Drainage
Engineering 134 (3), 305–314.
Melkonian, V. Flows in dynamic networks with aggregate arc capacities. Information Processing Letters 101 (1), 30–35. Molnar, P. Climate change, flooding in arid environments,
and erosion rates. Geology 29 (12), 1071.
Morita, M. Quantification of increased flood risk due to global climate change for urban river management planning. Water
Science and Technology 63 (12), 2967.
Needham, J. T., Watkins Jr D. W., Lund, J. R. & Nanda, S. K.
Linear programming for flood control in The Iowa And Des Moines Rivers. Journal of Water Resources Planning and
Management 126 (3), 118–127.
Nouasse, H., Charbonnaud, P., Chiron, P., Murillo, J., Morales, M., Garcia-Navarro, P. & Perez, G. Flood lamination strategy based on a three-flood-diversion-area system management. In:
2012 20th Mediterranean Conference on Control & Automation (MED). Barcelona, IEEE, pp. 866–871.
Romera, J., Ocampo-Martinez, C., Puig, V. & Quevedo, J.
Flooding management using hybrid model predictive control: application to the Spanish Ebro River. Journal of
Hydroinformatics 15 (2), 366–380.
Wang, X. J., Zhao, R. H. & Hao, Y. W. Flood control operations based on the theory of variable fuzzy sets.