Environmental drivers of rare earth element
bioaccumulation in freshwater zooplankton
Gwyneth A. MacMillan†; Meredith G. Clayden‡; John Chételat¥; Murray C. Richardson§;
Dominic E. Ponton‡; Tania Perron‡; Marc Amyot*†
† Centre d’études nordiques (CEN), Département de sciences biologiques, Université de
Montréal, Montréal, QC, Canada, H2V 2S9
‡ Département de sciences biologiques, Université de Montréal, Montréal, QC, Canada, H2V
2S9
¥ National Wildlife Research Centre, Environment and Climate Change Canada, Ottawa, ON,
Canada, K1A 0H3
§ Geography and Environmental Studies, Carleton University, Ottawa, ON, Canada, K1S 5B6
*Corresponding author: Marc Amyot, Phone: 514-343-7496, E-mail: m.amyot@umontreal.ca
Author contributions: GM, MR, JC, TP and MA conceived and designed the study. GM, JC,
MR, DP and TP performed the field data collection. Data and statistical analysis was done by GM and MC. GM and MC wrote the manuscript. All authors edited the manuscript and gave their approval to the final version of the manuscript.
Keywords: lanthanides, aquatic systems, sediment, free ion activity model, surface waters,
arctic, temperate, subarctic, biogeochemistry, trace metal
Note: The authors declare no competing financial interest.
1 2 3 4 5 6 7 8 9 10 11 12 13 14 15 16 17 18 19 20 21 22 23 24 25
ABSTRACT:
Human activities have resulted in significant release of rare earth elements (REEs) into the environment. However, the pathways of REEs from waters and soils into freshwater food webs remain poorly understood. Recent studies suggest that aquatic invertebrates, may be good biomonitors for REEs, yet there is little information on factors that control REE bioaccumulation in these organisms. Our goal was to study the environmental drivers of REE levels in
zooplankton, a key component in plankton food webs, across lakes from geographic areas with different bedrock geology. From 2011 to 2014, bulk zooplankton samples were collected for REE analysis from 39 lakes in eastern Canada. We observed a more than 200 fold variation in surface water REE concentrations and a 10 fold variation in sediment REE concentrations. These concentration gradients were associated with an order of magnitude range in zooplankton REE concentrations (REEY 3.2 - 210 nmol g-1). We found higher REE bioaccumulation in
zooplankton from lakes with lower pH and higher REE to dissolved organic carbon ratios. Bioaccumulation was also strongly linked to the free ion concentrations of REEs (REE3+) in
surface waters. Our study suggests that zooplankton REE bioaccumulation is an excellent predictor of bioavailable REEs in freshwaters.
26 27 28 29 30 31 32 33 34 35 36 37 38 39 40 41
TABLE OF CONTENTS GRAPHIC (TOC Art):
Source: Map image and data ©2018 Google
42
43
INTRODUCTION:
Global demand for rare earth elements (REEs) is rapidly increasing because these metals are essential in many high-tech industries, notably electronics, medicine and renewable energy.1
Industrial activities have led to significant release of REEs into the environment from mining, municipal and electronic waste, and agricultural sources,2 yet the bioavailability and
environmental risks of REEs have not received much attention.3 Compared to other trace metals
with well-documented environmental impacts,4 there are far fewer field-based studies examining
REE bioavailability in freshwater aquatic ecosystems.5-9 REEs are 17 metals of emerging
concern which are grouped together because they have very similar chemical and toxicological properties. REEs are predominantly trivalent cations (M3+) with similar ionic radii and include
the 15 lanthanide metals (La to Lu), as well as scandium (Sc) and yttrium (Y). Only “rare” because they do not concentrate into easily exploitable mineral deposits, the abundance of REEs in the Earth’s crust is comparable to other trace metals, including copper, lead and zinc.10
Site-specific field data from freshwater ecosystems are needed to support environmental impact assessment of REEs and establish baseline environmental guidelines.
Pathways of REE movement into freshwater biota from water, soils and sediments are not well studied. Poorly soluble in the natural environment, REEs are found at very low or trace
concentrations (< 0.01 ug L-1) in waters of most uncontaminated aquatic systems.3 REEs are
lithophile, forming strong complexes with organic and inorganic ligands (including carbonate and phosphate ions), and hence the majority of REEs are bound to sediments or suspended particles in the water column.11, 12 As with other trace metals, the major natural sources of REEs
to lake surface waters are atmospheric deposition, inputs from watersheds, and diffusion or 45 46 47 48 49 50 51 52 53 54 55 56 57 58 59 60 61 62 63 64 65 66
resuspension from the lake sediments. Atmospheric particles are a major source of REEs to the ocean,13, 14 but may not be the dominant natural source for small lakes with large watershed to
lake surface area ratios. Geologic REE inputs to lakes may vary with geographic region due to the lithology of their catchments, with different geological structures and chemical composition of the rocks.15 Soil REE content is influenced by the presence of REE-bearing minerals,
carbonates and organic matter, as well as soil weathering, pH, particle size, and clay content.16, 17
Only a fraction of the total concentrations of REEs is available to enter living organisms and this bioavailable metal fraction has the capacity to be solubilized and released from environmental compartments, i.e. soils, sediments, and particles.18 The bioavailability of trace metals in aquatic
ecosystems is controlled by their chemical speciation in water, which is strongly influenced by environmental factors, including pH, the presence of other cations (H+, Ca2+, Mg2+) and
competition with other metals for complexation with inorganic and organic ligands. Given the influence of environmental factors, models are widely used to predict trace metal speciation and bioavailability based on site-specific water chemistry. The free ion activity model (FIAM) and the biotic ligand model (BLM) predict that bioavailability is most strongly associated with the free ionic form of the metal (Mz+) in surface waters, as well as with the influence of chemical
competitors at biological uptake sites.19 Estimating free ion metal concentrations typically
involves the use of computer software (e.g. MINEQL+, PHREEQC, WHAM) because the
analytical methods for detecting low ambient Mz+ concentrations are challenging. These
computational algorithms are based on equilibrium binding constants that describe reactions of metals with a variety of inorganic and organic ligands.
67 68 69 70 71 72 73 74 75 76 77 78 79 80 81 82 83 84 85 86 87
It is well-established that REEs naturally bioaccumulate in vegetation, especially in lichen and moss,8, 20, 21 and recent studies suggest that REEs bioaccumulate to similar levels in aquatic
invertebrates, such as freshwater zooplankton.5, 6 Similar to other trace metals, REEs can be
adsorbed to outside surfaces, or they can be taken up into invertebrates from the surrounding water and from food.22 Although not commonly used in biomonitoring, zooplankton assemblages
are good candidate biomonitors for freshwater ecosystems as they are widespread, abundant, relatively easy to sample, and play important ecological roles.23, 24 However, using species
assemblages for biomonitoring, such as periphyton or zooplankton, requires careful characterisation of assemblage composition.
This study examined environmental drivers that determine REE concentrations in freshwater zooplankton in four geographic regions (in five geological provinces) from temperate to high arctic environments in Eastern Canada. From 2011 to 2014, unsorted (bulk) zooplankton samples were collected for REE analysis during the summer from 39 lakes. We determined a) REE concentrations in water, sediment and bulk zooplankton, b) the influence of REE speciation and free ion concentration on REE bioaccumulation in zooplankton and c) the influence of
watershed characteristics and within-lake environmental factors on REE concentrations in zooplankton. This study generated important baseline data on REEs bioaccumulation in zooplankton across five geological provinces in eastern Canada.
METHODS:
Study Sites. From 2011 to 2014, 39 lakes were sampled during July or August from different
geographic areas including temperate, subarctic, arctic and high arctic ecosystems in eastern Canada (Fig. 1, Table S1). In 2011 and 2012, 14 lakes were sampled near Montreal, Quebec 88 89 90 91 92 93 94 95 96 97 98 99 100 101 102 103 104 105 106 107 108 109
(45°N, 73°W), hereafter referred to as temperate lakes. In 2012, 8 lakes were sampled near Kuujjuarapik-Whapmagoostui (K-W) in the subarctic taiga south of the treeline in Nunavik, Quebec (55°N, 77°W). In 2013, nine lakes were sampled in the arctic tundra near Iqaluit,
Nunavut (64°N, 68°W) and 8 more lakes were sampled in 2014 in the polar desert near Resolute, Nunavut (74°N, 94°W). The 39 study lakes were selected to represent a gradient in geology, lake and watershed size, water chemistry, trophic status, as well as food web composition (Tables S1, S2). Study lakes were situated in five geological provinces: the Appalachian Orogen and
Grenville provinces (Montreal), the Superior Province (Kujjuarapik-Whapmagoostui), Churchill Province (Iqaluit) and the Arctic Platform (Resolute Bay). Surficial geology differs within each of these provinces and among the four sampling regions (Fig. 1).25
All study lakes were sampled for in situ water temperature, pH, specific conductivity, and dissolved oxygen with a YSI probe (YSI 600QS, YSI Inc., Yellow Springs, Ohio, USA). All sample lakes were relatively small in size (ranging from 0.1 to 4.7 km2 with a median of 0.27
km2) and were shallow with maximum depths of 0.30 to 12 m (Table S1). None of the subarctic
or arctic lakes (N = 25) showed thermal stratification during the mid-summer sampling periods. All of the temperate lakes near Montreal showed thermal stratification (N =14), with the
thermocline from 2.5 to 6.0 m. Note that a subset of this dataset was previously published in two articles with different research objectives from the current study.5, 6 There is currently no REE
mining or exploitation in the study regions and therefore none of these lakes were considered to be contaminated, i.e. there are no known metal point source contamination within their
watersheds. However, the temperate lakes are located in watersheds influenced by agricultural activities. 110 111 112 113 114 115 116 117 118 119 120 121 122 123 124 125 126 127 128 129 130 131 132
Physical Lake and Watershed Characteristics. For all sites, lake area and watershed area were
computed in ArcGIS (ESRI 2011, ArcGIS) using digital elevation models (DEM) and standard terrain analysis methods (with SAGA GIS for northern sites).26 Average lake depth was
estimated using the formula 0.46*depthmax (where depthmax is maximum measured lake depth). This formula is commonly used to estimate average lake depth in the absence of complete bathymetric surveys and is based on the assumption of an elliptic sinusoidal lake morphometry.27 Lake volume for temperate sites was estimated as lake area multiplied by
average depth. For northern sites, bathymetric surveys were conducted at all lakes using a small inflatable raft and sounder that recorded water depth, latitude and longitude (Lowrance Elite-5 HDI fish finder). Lake volumes were calculated from the average depth of the interpolated grid and the lake area. Several of the Resolute lakes were covered with a large ice pan and therefore average depth and volume were calculated with the formula used for temperate sites.
Water, Sediment, and Zooplankton Sampling. Ultra-trace sampling techniques were used to
collect the environmental samples. Surface water (N = 39), surface sediment (N = 34) and zooplankton (N = 34) were collected for trace metals and REE analysis from a boat with an electric motor. Surface sediment was sampled in the deepest zone of the lake by Ekman grab. Water was carefully removed from the top of the samples and 1-2 cm of intact sediment was collected in triplicate and then frozen at -20C in plastic bags until digestion and analysis. Duplicate surface water samples were collected with sub-surface hand grabs (at 10 - 20 cm below the surface) in HDPE bottles for water chemistry analysis, including dissolved organic carbon (DOC), major ions (Ca, Mg, K, Na, Cl, SO4), chlorophyll a (Chla), total nitrogen (TN),
133 134 135 136 137 138 139 140 141 142 143 144 145 146 147 148 149 150 151 152 153 154 155
total phosphorus (TP). Chla, TN and TP were not measured at temperate sites (N = 14; Table S1). Water samples for trace metals and REEs were also collected at 10 - 20 cm sub-surface using either hand grabs or an acid-washed (HCl 10%) peristaltic pump with Teflon tubing.
Water samples for metals and REEs were filtered either using an acid-washed (HCl 10%) Teflon filtration tower with a pre-combusted glass-fiber filter (0.7 µm pore size, Whatman GF-F) which was flushed with site water, or a peristaltic pump with a High Capacity In-Line Groundwater Sampling Capsule with a 0.45 µm pore size membrane (Pall Corporation, Port Washington, NY). Blanks of Milli-Q water (18.2 MΩ·cm) filtered on glass-fiber filters showed slight increases after filtration for Y, La, Ce, and Eu (< 0.02 µg L-1) and negligible increases of ~ 0.005 µg L-1 for all
other REEs. Filtered Milli-Q blanks using the peristaltic pump and in-line filter capsule had concentrations < 0.005 µg L-1 for all REEs. These levels were negligible compared to measured
REEs at most sites, except at some lakes in Resolute where measurements were closer to detection limits. Analytical blank values were subtracted from surface water concentrations for each element (when detected) and filtered blanks were not subtracted. All water samples for metal analysis were stored in trace-metal clean falcon tubes, acidified with ultrapure HNO3 (2%
v/v, Omnitrace grade), and stored at 4C.
At temperate sites, integrated zooplankton samples from the first 6 m of the water column were collected with a large plankton net (1 m diameter, 200 μm mesh). For northern sites, zooplankton were sampled by horizontal surface hauls at depths of 1 to 2 m with the same net. Sub-samples were taken from each site and preserved in ethanol (70% v/v) for taxonomic analysis. Replicate zooplankton samples (N = 2-3) were filtered (200 µm), rinsed with ultrapure Milli-Q water and 156 157 158 159 160 161 162 163 164 165 166 167 168 169 170 171 172 173 174 175 176 177 178
frozen at -20C in acid-washed (HCl 10%) 500 mL HDPE jars without a depuration step. In 2018, an additional experiment was conducted to assess the influence of depuration (i.e. removal of gut contents) on REE concentrations in pelagic zooplankton. Zooplankton concentrations of individual REEs declined by 27% ± 7% after 8h of depuration in filtered lake water (N=3). Reported REE concentrations in this study should therefore be considered upper limits for pelagic zooplankton.
Sample Preparation and Analysis. DOC in surface waters was measured as non-purgeable
organic carbon by adding H3PO4, followed by persulfate digestion, with an Aurora 1030 TOC
analyzer (OI Analytical, Texas). TN was determined as nitrate after potassium persulfate alkaline digestion and TP was determined by spectrophotometer using the ascorbic acid/molybdenum blue method. Chla was measured by spectrophotometer after ethanol extraction. Anions were quantified using ion chromatography (either Dionex Corp. or Waters, IC-Pak A and C columns) and cations were analyzed with either a) inductively coupled plasma optical emission
spectrometry (in 2011, ICP-OES, Varian VISTA AX CCD) or b) with an atomic absorption spectrophotometer (in 2012 - 2014, AAS, Agilent).
Sediment organic matter content was estimated by loss on ignition (LOI). Sediment particle size distribution was estimated using sieving techniques for the coarse fraction (> 2 mm) and laser diffraction for the smaller fractions (< 2 mm) on both unprocessed and processed samples (LS 13 320, Beckman Coulter, Indianapolis, USA). To determine particle size distribution, sediment was digested using HCl and H2O2 to remove carbonates and organic components, respectively. Note:
sediment digestions for trace metal analysis were conducted separately (see below). Unprocessed 179 180 181 182 183 184 185 186 187 188 189 190 191 192 193 194 195 196 197 198 199 200 201
sediment was sieved and run unaltered. Calculations for light diffraction used the Fraunhofer optical model.28-30 Particle size is expressed in volume percentage where clay was from 0.24 - 2.0
µm, silt was from 2.0 - 63 µm, and sand was from 63 - 1000 µm.
Dry sediment and zooplankton were weighed in tin capsules and analyzed for carbon and nitrogen stable isotope ratios (δ13C, δ15N) as well as percent carbon (%C) and percent nitrogen
(%N) using an elemental analyser interfaced with an isotope ratio mass spectrometer (IR-MS, Thermo Delta Advantage) at the G.G. Hatch Stable Isotope Laboratory (University of Ottawa, Ottawa, Canada). Stable isotope ratios are reported in Delta (δ) notation; the units are parts per thousand (‰) and defined as δX= ((Rsample-Rstandard))/Rstandard) x 1000 where X is 15N or 13C, and R is the ratio of the abundance of the heavy to light isotope. For more information on
data handling for stable isotope ratios, see Supporting Information (SI).
Taxonomic composition of zooplankton was examined using a dissecting microscope (x10 - 40 magnification) and zooplankton were classified into major groups (Order or Genus) using taxonomic keys31, 32 Duplicate taxonomic samples were analysed from each sample lake and a
minimum of 200 individuals were identified in each replicate. Replicate samples were compared and then pooled together for analysis (N = 400-500). The relative contribution of each major group (e.g. % cladocerans, % copepods, and % chaoborids) was calculated by dividing the number of individuals in each taxonomic group by the total number of individuals.
Trace Metal and REEs Analysis. Water samples were analysed for trace metals and REEs by
inductively-coupled plasma mass spectrometry (ICP-MS, PerkinElmer; NexION 300X) using an 202 203 204 205 206 207 208 209 210 211 212 213 214 215 216 217 218 219 220 221 222 223 224
115In internal standard to correct for instrumental drift. A 6 or 7-point multi-element calibration
curve was acquired every 20 samples and blank and quality control samples were run every 10 samples. Analyzed trace metals included Al, Mn, Ni, Cu, Zn, As, Se, Cd, Pb, and Fe, and REEs included La-Lu, Sc and Y. Detection limits for temperate lake analyses were previously
published in Amyot et al. (2017). Detection limits were calculated as three times the standard deviation of 10 analytical blanks for northern lakes and are reported in Table S3. Homogenized sediment and zooplankton were freeze-dried and 0.01 to 0.18 g (median 0.10 g) of sample was weighed into pre-washed (HNO3 45%, HCl 5%) Teflon tubes and digested with 3 mL of trace
metal grade HNO3 (70% m/v) for 15 minutes at 170°C in a microwave. Two more 15 minute
cycles were completed after adding 0.5 - 1.0 mL of OPTIMA grade hydrogen peroxide (30% H2O2) before each cycle. Digested samples for trace metal analysis were diluted with ultra-pure
water (MilliQ, 18.2 MΩ•cm) to a volume of 50 mL, re-diluted (1:2) into trace metal clean falcon tubes, and analyzed by ICP-MS. Sediment samples were centrifuged prior to analysis by ICP-MS to remove any residues remaining after sample digestion. Partial sediment extractions were used in this study to measure REE concentrations because they were considered more representative of the labile, bioavailable metal fraction. 33
Quality Assurance. Quality assurance for carbon and nitrogen stable isotope ratios included
triplicate analyses of an internal standard (analytical precision of 0.2 ‰) per run and duplicate analyses of 10% of samples (CV < 5%). Quality assurance for trace metals and REEs included a) the analysis of analytical and field blanks, b) the analysis of certified reference materials and analytical sample duplicates and c) an inter-laboratory calibration with the Centre d’expertise en analyse environnementale (CEAEQ, Government of Québec, Quebec City). Quality control for 225 226 227 228 229 230 231 232 233 234 235 236 237 238 239 240 241 242 243 244 245 246 247
REEs in surface waters was assured through an inter-laboratory calibration with CEAEQ of four unfiltered subarctic water samples (Table S5). For digestions, average (min-max) recovery for REEs in reference material was 87% (79 - 101%) for mussel tissue, 84% (67 – 117%) for plant tissue, and 70% (40 – 99%) for sediment (Table S6). These values are consistent with average recoveries reported in the literature.7, 8, 34 Coefficients of variation (CV) were calculated for
analytical and field duplicates to estimate analytical precision and were approximately ± 13% for water, ± 7% for sediment and ± 21% zooplankton. Details on quality assurance are found in the SI (Tables S3 to S6).
Data Handling: REEs have very similar geochemical behaviour, and therefore total REE
concentrations (instead of single element concentrations) were used to present the majority of results.6 For comparison with the published literature, two sums were calculated, a) REE, or the
sum of 14 lanthanides (La, Ce, Pr, Nd, Sm, Eu, Gd, Tb, Dy, Ho, Er, Tm, Yb, Lu) and b) REEY, the sum of 14 lanthanides plus yttrium (Y). Promethium (Pm) was not included because it does not occur naturally and scandium (Sc) results were excluded due to analytical interference. Some results are shown using lanthanum (La) as a representative single element, because it is the second most abundant REE (after Ce) and does not have variable oxidation states.
Surface water dissolved REE concentrations are reported in nmol L-1 while sediment and biota
concentrations are reported in nmol g-1 on a dry weight basis (d.w.). Bioaccumulation factors
(BAFs, L Kg-1, log10-transformed) were calculated as the ratio of zooplankton REEY (nmol
Kg-1) to surface water REEY (nmol L-1) using field data. Sediment-water partition coefficients
(Kd in L Kg-1 or log Kd in log L Kg-1) were calculated for study lakes based on individual and
248 249 250 251 252 253 254 255 256 257 258 259 260 261 262 263 264 265 266 267 268 269 270
REEY levels in dry surface sediment (nmol Kg-1) divided by surface water (nmol L-1). Note
that Kd was calculated using partial extractions for REEY levels in sediment samples. Ratios of REEs to DOC concentrations in surface waters were calculated for each study lake by dividing surface water REEY or single element concentrations (M) by site-specific DOC concentrations (mg L-1).
Free ion concentrations of REEs were calculated with the Windermere Humic Aqueous Model software (WHAM 7.0.5).35 Model inputs were field-measured temperature, pH, inorganic and
organic ligands concentrations (including DOC, major ions and trace metals as listed previously). Total carbonates were assumed to be at equilibrium with the atmosphere and were defined with a value of 3.09 x 10⁻⁴ (atm) for all sites. Field measurements of DOC were used to estimate fulvic
acid concentrations for WHAM models, calculated using the following equation: 1 mg C L-1 is
equal to 1.3 mg fulvic acid L-1. This equation assumes that organic matter is composed of 50%
carbon and that 65% of organic matter is composed of complex-forming fulvic acids.36 The
database used for the models was not changed for this study and precipitation was not allowed (see Table S7 for WHAM equilibrium constants). Competition of calcium (Ca2+) and hydrogen
ions (H+) with free ionic REE3+ at zooplankton uptake sites were considered using competition
models described in Croteau et al. (1998) and Hare and Tessier (1998).24, 37
Statistical analyses: All statistical analyses were performed in R version 3.3.1 (R Core
Development Team, 2016). Graphics were created with the ‘ggplot2’ package.38 All data were
tested for normality and transformed, if required, to reduce skewness and outlier influence. All REE concentrations and lake physico-chemistry variables were log10 transformed, with the
271 272 273 274 275 276 277 278 279 280 281 282 283 284 285 286 287 288 289 290 291 292 293
exception of mean depth, sediment %N and %OM (square root transformation), sediment silt % (power of 2 transformation), and TP (aq), sediment δ15N, and sediment Al concentrations (no
transformation, normal distributions). ΣREEY concentrations were compared between different regions using Welch’s analysis of variance (ANOVA) with Games-Howell post-hoc tests because this test is designed for cases where variance is heterogeneous and sample size is small (R: userfriendlyscience package).39
Simple linear regressions were used to compare REE concentrations between water, sediment, and zooplankton. Visual inspection of linear model residual plots did not show deviation from homoscedasticity or normality. Multivariate analyses were conducted to examine which environmental variables influence both REEY and La concentrations in a) surface water b) surface sediment, and c) log Kd and d) bulk zooplankton. Multiple regressions were calculated using LASSO (Least Absolute Shrinkage and Selection Operator) analyses with the R package ‘lars’.40 This technique limits the sum of the regression coefficients using a tuning parameter
(lambda, λ) to ensure models are parsimonious and is well-suited to small datasets with many collinear variables.41, 42 The best model was chosen as that with the lowest Mallow’s Cp value, a
statistic for subset selection similar to the Akaike information criterion (AIC) or Bayesian information criterion (BIC).43 The ‘selectiveInference’ 44 package in R was used to estimate the
significance of each independent variable (p) in the models using its corresponding λ value. See SI for more information on LASSO methods, regression results and path plots (Fig. S5 to S9). 294 295 296 297 298 299 300 301 302 303 304 305 306 307 308 309 310 311 312 313
RESULTS AND DISCUSSION:
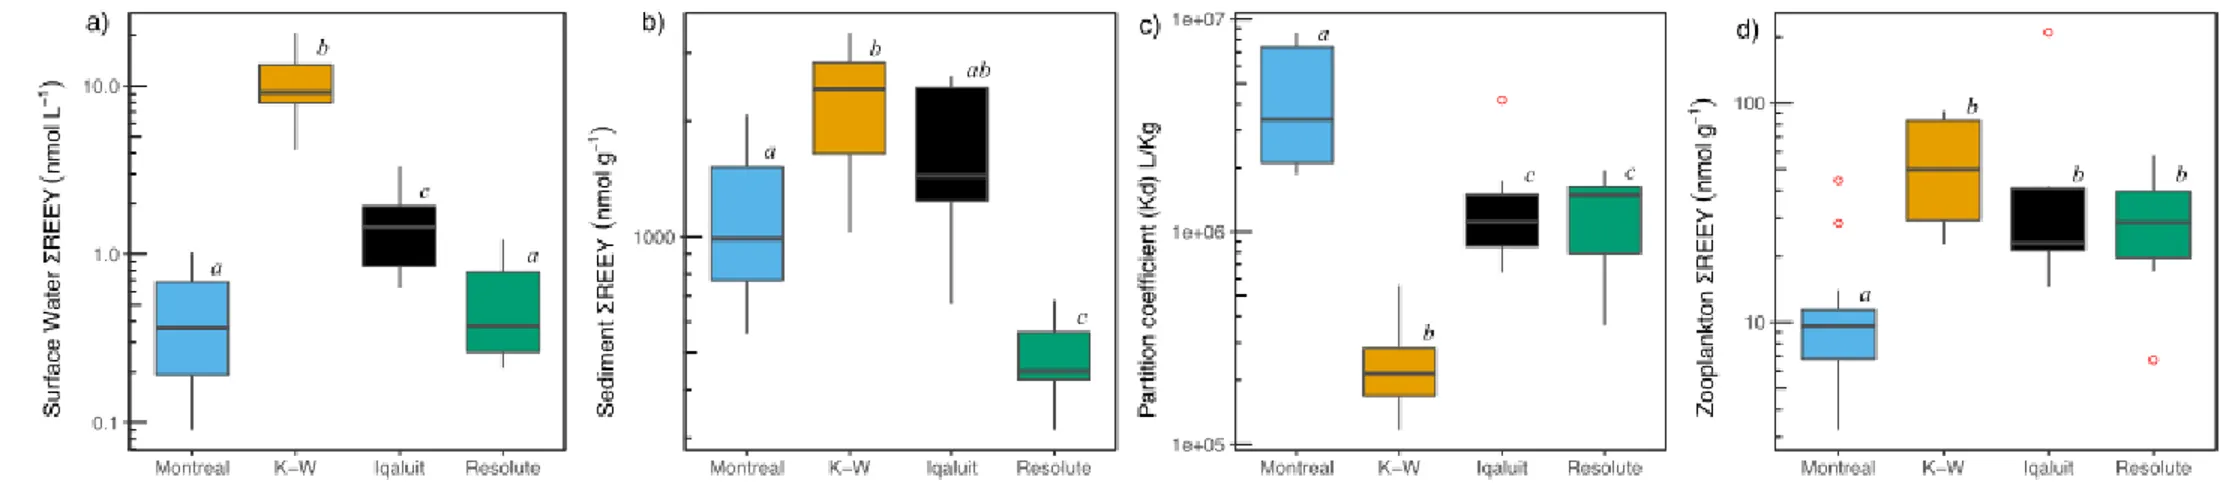
Water, Sediment and Zooplankton Regional Variation in REEs. Large regional variation was
observed for REE concentrations in water, sediment and bulk zooplankton. REEY concentrations in surface water and sediments varied across regions by up to 2 orders of magnitude, with maximum and minimum ratios for REEY of 11 in sediments and 230 in surface waters (Fig. 2, Tables S1, S2). Analyses of variance among the four geographic regions showed significant differences in surface water, sediment, and zooplankton REEY
concentrations, as well as for the sediment-water partition coefficient or Kd (Welch’s ANOVA, p < 0.001). Surface water REEY concentrations were significantly different among all regions (Games-Howell post-hoc tests, p < 0.01), except for Montreal and Resolute (p > 0.05). REEY sediment levels in Resolute were significantly lower than for all other regions (p < 0.01), and REEY levels in zooplankton were significantly lower in Montreal than all other regions (p < 0.05). Kd was significantly higher in Montreal (p < 0.05) and lowest in
Kuujjuarapik-Whapmagoostui (K-W) (p < 0.001). Study lakes were located in five geological provinces and this may play a role in explaining the regional differences in abiotic and biotic REE
concentrations among these lakes (Fig. 1). REEs are often used as tracers to study the source of suspended particles and sediments in rivers because they can conserve the geochemical signature of parent materials (bedrock and soils).10, 45-47 However, more data on local REE mineralisation
and solubility in the study regions are required to accurately quantify the effect of geological region. 314 315 316 317 318 319 320 321 322 323 324 325 326 327 328 329 330 331 332 333 334
Surface water REEY concentrations ranged from 0.1 - 21 nmol L-1 (or 0.01 - 2.8 g L-1) across
all lakes. These levels are comparable with other published datasets in freshwater ecosystems, although minimum values for REE, La and Yb were lower in this study than previous studies (Table 1). For example, reports from a proposed REE mine in northern Canada show that background REE concentrations in downstream lakes were lower than detection limits for all elements (< 0.05 g L-1), except for Sc and Y.48 This observation is consistent with our study
where the majority of individual REEs were < 0.05 g L-1 (and all elements were < 0.05 g L-1 in
28 of 39 sites). Our broad geographic survey indicates that detection limits lower than 0.05 g L -1 are required to accurately assess background REE levels in surface water.
Surface sediment REEY concentrations ranged from 314 to 3391 nmol g-1 (or 42 to 463 g g-1)
(Fig. 2). These levels are similar to other published datasets for freshwater sediments (Table 1). This partitioning reflects the low solubility of REEs and the strong binding of REEs to soils and sediments. One recent study measured REEs in river sediments from a prospective mining area in southern Quebec and found a median REE value of 111 g g-1 (min - max: 71 - 185).49
Another study found mean values REE of 86.9 26.8 g g-1 in river sediments from a
watershed in Mexico with an iron ore mine.50 The values from these two studies are comparable
to sites from this study which had median REEY values of 163 g g-1 (Table 1).
Zooplankton REEY levels ranged from 3.2 - 210 nmol/g (or 0.42 to 28 g g-1) (Fig. 2). In the
absence of published data for REEs in freshwater zooplankton, we compared our results to those found for marine invertebrates. Marine studies reported relatively high levels ( > 1.0 g g-1) for
plankton, squid and scallops.51, 52 One study found concentrations of 8.5 pmol g-1 (1.15 ng g-1) for
335 336 337 338 339 340 341 342 343 344 345 346 347 348 349 350 351 352 353 354 355 356 357
REE in marine plankton > 200 m, 53 which is lower than zooplankton REEY measured in
this study. Bioaccumulation factors (BAFs) for zooplankton REEY in this study ranged from 3.4 to 5.3, with a median of 4.5 (L Kg-1, log10-transformed). BAF values for individual elements
are shown in Fig. S2. The taxonomic composition of bulk zooplankton varied considerably between sample lakes and, we compared the composition to zooplankton REEY values for a subset of samples (N = 22). We found no relationship between the relative abundance of major taxa (e.g. % cladoceran, % copepod, % daphnia) and zooplankton REEY across sample sites (p > 0.05). Future studies could examine the influence of taxonomic composition on REE
bioaccumulation at a finer scale, focusing on sites with similar geology and environmental conditions.
Sediment-water partition coefficients (Kd, L Kg-1) were calculated for study lakes based on
individual and REEY levels in dry surface sediment versus surface water. Median Kd for study sites was 1.3 x 10⁶, ranging from 1.2 x 10⁵ to 8.6 x 10⁶ L Kg-1 (N = 34). These results are similar
to Weltje et al. (2002) where individual element Kd values varied from 1 x 10⁵ to 3 x 10⁶ L Kg-1
for five industrialized freshwater sites in the Netherlands. As with this study, Kd values were consistently lower for Eu but did not show any discernable patterns for other elements (Fig. S1), which may be due to the variable oxidation states of Eu compared to other REEs.8 As reported
above, Kd values were higher and more variable at temperate sites, with a median of 3.4 x 10⁶
compared to 7.9 x 10⁵ for northern sites. This difference may be due to lake stratification and
decreased transport of REEs from sediments into surface waters in these systems. 358 359 360 361 362 363 364 365 366 367 368 369 370 371 372 373 374 375 376 377 378 379
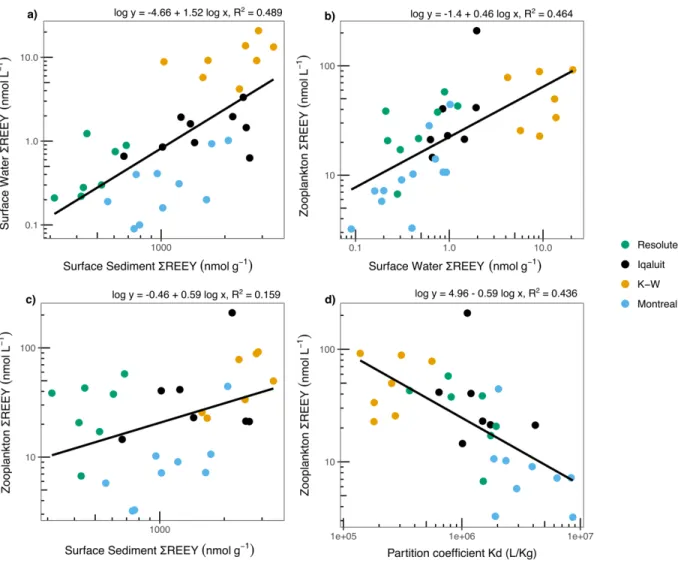
Relationships between REEs in Environmental Compartments. REEY levels in sediments and surface waters were strongly positively correlated (R2 = 0.49, p < 0.01, N = 34) (Fig. 3a).
Mobilization of REEs from aquatic sediments may be an important source of REEs to the water column. Significant positive relationships were found between REEY in bulk zooplankton and surface waters (R2 = 0.46, p < 0.01), and to a lesser extent with surface sediments (R2 = 0.16, p =
0.03) (Fig. 3b, 3c). These relationships indicate that aqueous REE concentrations were the strongest predictors of REE accumulation in freshwater zooplankton. There was also a strong negative relationship between Kd and REEY in bulk zooplankton (R2 = 0.44, p < 0.01) (Fig.
3d). Higher Kd values suggest that REEs are predominantly bound to sediments, leading to lower uptake by pelagic zooplankton feeding in the upper water column. These relationships are examined in more detail using multivariate analyses below in the section “Influence of Within-Lake Environmental Variables and Watershed Characteristics”.
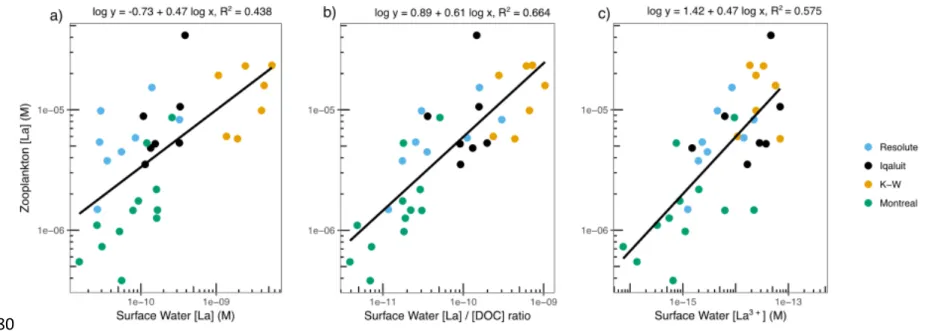
REE Speciation and Zooplankton Bioaccumulation. Simple linear correlations between DOC
and REEY in surface water or bulk zooplankton were non-significant (p > 0.05). However, the relationship between REEY in bulk zooplankton and surface waters (R2 = 0.46, p < 0.01, Fig.
3b) was significantly improved by using the ratio of REEY to dissolved organic carbon
concentrations (REEY:DOC) in surface waters (R2 = 0.63, p < 0.01, Fig. S3). This same result
was found when using a representative single element (La) to compare zooplankton La
concentrations to surface water La concentrations (R2 = 0.44, p < 0.001, Fig. 4a) and to the ratio
of La to DOC in surface waters (R2 = 0.66 p < 0.001, Fig. 4b). These REE:DOC concentration
ratios suggests that the presence of organic matter decreases the bioavailability of REEs for uptake by zooplankton. Although REEs form strong complexes with carbonate and phosphate 380 381 382 383 384 385 386 387 388 389 390 391 392 393 394 395 396 397 398 399 400 401 402
ions, these inorganic ligands may not compete effectively for REEs when organic ligands are present in circumneutral freshwaters.12, 54-56 Our results show that strong positive correlations
between aqueous and zooplankton REE concentrations are improved by controlling for site-specific DOC concentrations.57
Furthermore, the free ion activity model successfully predicted La, Ce and Dy bioaccumulation in zooplankton. Calculated free ion concentrations of La in our study ranged from 2 x 10-16 to 4 x
10-13 M (or < than pM) among lakes. Zooplankton La concentrations were proportional to surface
water La3+ concentrations, as calculated using WHAM speciation modeling (R2 = 0.58, p < 0.001,
Fig. 4c). The same trend was observed for other REEs (Ce: R2 = 0.53), but was weaker (Dy: R2
=0.28) or non-significant (Eu: p > 0.05) for other elements (Fig. S4). Strady et al. (2015)
similarly found that REEs in marine plankton correlated well with REE free ions (REE3+). While
FIAM has been well-established under laboratory conditions, fewer studies have validated these models under more complex natural conditions, 58-62 and their applicability to trivalent metals
(M3+), like the REEs.63-67 Our study shows that freshwater zooplankton REE bioaccumulation
was linked to the free ion concentrations of REEs (La, Ce, Dy). WHAM calculations also showed that ~99% of REEs were bound to colloidal humic acids in sampled lakes, which is consistent with other studies showing that often > 90% of REEs will form complexes with colloidal organic matter.12, 56 In this study, competition models calculated for calcium Ca2+ and H+
did not improve the relationships between aqueous [La3+] and [La] in zooplankton.24, 37 Overall,
these results show that bulk zooplankton is an effective biomonitor to evaluate bioavailable REE levels in freshwater lakes.
403 404 405 406 407 408 409 410 411 412 413 414 415 416 417 418 419 420 421 422 423 424 425
Influence of within-lake environmental variables and watershed characteristics: Results of
multivariate regressions using LASSO models are shown in Tables S8-S9. This modeling showed that surface water ΣREEY was most strongly predicted by ΣREEY concentrations in sediments and by mean lake depth for all sites (p < 0.001 for both variables, Table S8). Large model coefficients for these variables indicate that surface water ΣREEY increased significantly with ΣREEY sediment concentrations and decreased with lake depth. After the exclusion of deeper, stratified temperate lakes, lake depth was still negatively related to surface water REE concentrations but relationships were not significant (p > 0.05). Similar to the simple regression models reported above, these multivariate results suggest that mobilisation of REEs from sediments is a source of REEs to the water column and that REEs may be less mobilised in deeper stratified lakes. Lake area and aqueous [Fe] also contributed to a lesser extent to the best model for ΣREEY in surface waters, however these relationships were not statistically significant (Table S8). No significant relationships were found between surface water REEY and water physico-chemistry (temperature, conductivity, DOC, pH) across study sites. Higher water concentrations of REEs are usually associated with low pH, due to the increased solubility of REE3+ cations in acidic waters.11 Water pH may have not been correlated with aqueous REE
concentrations in this study because of the range of pH (6.5 to 8.3) in study lakes, as dissolved REE concentrations tend to increase only when water pH is < 6.5.68, 69 We also tested the
influence of catchment area to lake area (CA:LA) and lake volume to catchment area (LV:CA) ratios, as proxies for catchment influence and water residence time, respectively, in these models. These ratios were not included in the final models, as they did not improve model predictions over the more parsimonious models shown here.
426 427 428 429 430 431 432 433 434 435 436 437 438 439 440 441 442 443 444 445 446 447 448
In sediment, Fe concentration was significantly and positively correlated with ΣREEY concentration (p = 0.003, Table S8). Marmolejo-Rodríguez et al. (2007) found that the light REEs (La-Gd) correlated with Fe and, inversely, that heavy REEs (Tb-Lu & Y) correlated better with Al in river sediments. The authors hypothesized that dissolved light REEs selectively adsorbed onto iron oxyhydroxides in river sediments. Fe oxyhydroxide adsorption under oxic conditions may explain the positive correlation between REEs and Fe in sediments in the present study, as ΣREEY in sediment samples was mainly light REEs (~78%). Sediment ΣREEY levels were not significantly related to sediment properties (% clay, sand, silt, organic matter). Previous studies have found higher REE content in sediments with fine-grain size, low organic matter and high clay content,11, 49, 50 yet no significant trends with these variables were found for sediment
[ΣREEY] or [La] among our study lakes (p > 0.05). However, LASSO modelling of sediment-water partitioning found that Kd was significantly higher in deeper lakes, with lower clay content and lower Al concentrations in sediments (Table S8). Kd decreased in lakes with higher
sediment clay content (%), which contrasts with previous studies where clayey soils had higher REEs and REE oxides were preferentially bound to fine particles.70, 71
Five models using different subsets of environmental variables were run to evaluate which variables influenced zooplankton REEY and La concentrations (Table S9). For zooplankton REEY concentration, the ratio of aqueous REEY to DOC (Model 1, R2 = 0.77) explained a
greater amount of variability than Kd (Model 2, R2 = 0.67) across study lakes. REEY to DOC
was also a stronger predictor than Kd when stratified temperate lakes were excluded from the analysis (p < 0.01). Confirming results from simple linear regressions, zooplankton La
concentration was strongly related to the ratio of aqueous La to DOC concentrations, Kd for La, 449 450 451 452 453 454 455 456 457 458 459 460 461 462 463 464 465 466 467 468 469 470 471
and free La3+ concentrations (Table S9; Fig. 3, 4). Although surface water REEs were correlated
with lake depth, depth did not significantly predict zooplankton REEY concentrations (Table S9). Other environmental variables that did not explain zooplankton ΣREEY and La
concentrations in this study included lake area, zooplankton δ15N and C: N ratios, as well as
aqueous Al, Fe and Ca. Lake pH was also a significant predictor of REEY and La concentrations in zooplankton, which was somewhat surprising given that pH was not significantly correlated to aqueous REEY or La, nor to their respective ratios with DOC. Negative regression coefficients for pH indicate that higher REE bioaccumulation occurred in lakes with lower pH.
Environmental Relevance. To our knowledge, this study generated one of the most detailed
datasets on natural REE partitioning in lakes and ponds across a large geographic area with varied bedrock geology and environmental conditions. Our results show large regional variation in water, sediment and zooplankton ΣREEY concentrations. We found a more than 200 fold variation in ΣREEY in surface waters and a 10 fold variation in ΣREEY in sediments, which were associated with an order of magnitude range in zooplankton ΣREEY concentrations. Surface waters REEs increased with increasing sediments concentrations, and decreased with lake depth, indicating that REE mobilisation from sediments was a source to the water column and also that REEs were less mobilised in deeper stratified lakes. We found that surface water REE concentrations were strong predictors of REE bioaccumulation in zooplankton over a large exposure gradient. Higher REE bioaccumulation occurred in zooplankton from lakes with higher REE to dissolved organic carbon (DOC) ratios and lower pH. Bioaccumulation was also strongly linked to the free ion concentrations of REEs (REE3+) in surface waters. Overall, this study
472 473 474 475 476 477 478 479 480 481 482 483 484 485 486 487 488 489 490 491 492 493 494
highlights the utility of zooplankton for the biomonitoring of bioavailable REEs in freshwater ecosystems.
495 496
FUNDING SOURCES
This research was funded through the Northern Contaminants Program (Project M-16, Indigenous and Northern Affairs Canada), the Polar Continental Shelf Project (Natural Resources Canada), and Natural Sciences and Engineering Research Council (NSERC) Discovery and Northern Research Supplement grants to MA and MR. MA acknowledges support of the Canada Research Chair Program (CRC in Global Change Ecotoxicology). GM was supported by grants from the W. Garfield Weston Foundation, NSERC, FRQ-NT, Richard J. Schmeelk Canada and the Northern Scientific Training Program (NSTP).
ACKNOWLEDGEMENTS
Thank you to Dominic Bélanger for his help in the field and lab. Thanks to Catherine Girard for invaluable help with R, to Gretchen Lescord for her insight with multivariate analyses, to Magella Pelletier for discussions on geology and to Claude Fortin for help with WHAM. Many thanks to Jimmy Paul Angatookalook, Gayle Kabloona, Steven Lonsdale, Joeffrey Okalik, Pilipooise Iqaluk, and Shen Wang for assistance in the field. Thank you to Jamal Shirley and Rick Armstrong (Nunavut Research Institute), Alec Tuckatuck (Sakkaq Landholding Corp) and Claude Tremblay (Centre d’études nordiques) for logistical support.
Supporting Information consists of 22 pages including detailed methods for quality assurance,
data handling and multivariate analyses, as well as supplementary tables (9) and figures (9). Material is available online at http://pubs.acs.org.
497 498 499 500 501 502 503 504 505 506 507 508 509 510 511 512 513 514 515 516
REFERENCES
1. Alonso, E.; Sherman, A. M.; Wallington, T. J.; Everson, M. P.; Field, F. R.; Roth, R.; Kirchain, R. E., Evaluating rare earth element availability: a case with revolutionary demand from clean technologies. Environmental Science & Technology 2012, 46, (6), 3406-14.
2. EPA United States Environmental Protection Agency (U.S. EPA) Rare Earth Elements: A Review of Production, Processing, Recycling, and Associated Environmental Issues; Cincinnati, OH, 2012.
3. Gonzalez, V.; Vignati, D. A.; Leyval, C.; Giamberini, L., Environmental fate and ecotoxicity of lanthanides: are they a uniform group beyond chemistry? Environment International 2014, 71, 148-57.
4. Dudka, S.; Adriano, D. C., Environmental impacts of metal ore mining and processing: a review. Journal of Environmental Quality 1997, 26, (3), 590-602.
5. MacMillan, G. A.; Chetelat, J.; Heath, J. P.; Mickpegak, R.; Amyot, M., Rare earth elements in freshwater, marine, and terrestrial ecosystems in the eastern Canadian Arctic. Environmental Science: Processes & Impacts 2017, 19, (10), 1336-1345.
6. Amyot, M.; Clayden, M. G.; MacMillan, G. A.; Perron, T.; Arscott-Gauvin, A., Fate and Trophic Transfer of Rare Earth Elements in Temperate Lake Food Webs. Environmental Science & Technology 2017, 51, (11), 6009-6017.
7. Mayfield, D. B.; Fairbrother, A., Examination of rare earth element concentration patterns in freshwater fish tissues. Chemosphere 2015, 120, 68-74.
8. Weltje, L.; Heidenreich, H.; Zhu, W.; Wolterbeek, H. T.; Korhammer, S.; Goeij, J. J. M. d.; Markert, B., Lanthanide concentrations in freshwater plants and molluscs, related to those in surface water, pore water and sediment. A case study in The Netherlands. Science of the Total Environment 2002, 286, 191-214.
9. Twiss, M. R.; Campbell, P. G., Scavenging of 137Cs, 109Cd, 65Zn, and 153Gd by plankton of the microbial food web in pelagic Lake Erie surface waters. Journal of Great Lakes Research 1998, 24, (4), 776-790.
10. Taylor, S.; McClennan, S., The Continental Crust; its composition and evolution: Blackwell Science Publishers. In Oxford: 1985.
11. Herrmann, H.; Nolde, J.; Berger, S.; Heise, S., Aquatic ecotoxicity of lanthanum - A review and an attempt to derive water and sediment quality criteria. Ecotoxicology and Environmental Safety 2016, 124, 213-238.
12. Davranche, M.; Gruau, G.; Dia, A.; Marsac, R.; Pédrot, M.; Pourret, O., Biogeochemical Factors Affecting Rare Earth Element Distribution in Shallow Wetland Groundwater. Aquatic Geochemistry 2015, 21, (2-4), 197-215.
13. Tachikawa, K.; Athias, V.; Jeandel, C., Neodymium budget in the modern ocean and paleo-oceanographic implications. Journal of Geophysical Research: Oceans 2003, 108, (C8), 3254.
14. Goldstein, S.; O'nions, R.; Hamilton, P., A Sm-Nd isotopic study of atmospheric dusts and particulates from major river systems. Earth and Planetary Science Letters 1984, 70, (2), 221-236.
15. Long, K. R.; Van Gosen, B. S.; Foley, N. K.; Cordier, D. The principal rare earth elements deposits of the United States - A summary of domestic deposits and a global perspective: U.S. 517 518 519 520 521 522 523 524 525 526 527 528 529 530 531 532 533 534 535 536 537 538 539 540 541 542 543 544 545 546 547 548 549 550 551 552 553 554 555 556 557 558 559
Geological Survey Scientific Investigations Report 2010–5220; U.S. Department of the Interior, U.S. Geological Survey: 2010; p 96.
16. Buda, A. R.; Church, C.; Kleinman, P. J.; Saporito, L. S.; Moyer, B. G.; Tao, L., Using rare earth elements to control phosphorus and track manure in runoff. J Environ Qual 2010, 39, (3), 1028-35.
17. Tyler, G., Rare earth elements in soil and plant systems - A review. Plant and Soil 2004, 267, 191-206.
18. Caussy, D.; Gochfeld, M.; Gurzau, E.; Neagu, C.; Ruedel, H., Lessons from case studies of metals: investigating exposure, bioavailability, and risk. Ecotoxicology and Environmental Safety 2003, 56, (1), 45-51.
19. Campbell, P. G. C., Interactions between trace metals and aquatic organisms: A critique of the free-ion activity model. In Metal speciation and bioavailability in aquatic systems, Tessier, A.; Turner, D., Eds. John Wiley: New York, 1995; p 45−102.
20. Chiarenselli, J.; Aspler, L.; Dunn, C.; Cousens, B.; Ozarko, D.; Powis, K., Multi-element and REE composition of lichens, mosses and vascular plants from the Central Barrenlands, Nunavut, Canada. Applied Geochemistry 2001, 16, 245-270.
21. Hao, S.; Xiaorong, W.; Qin, W.; Liansheng, W.; Yijun, C.; Zhong, L.; Mi, C., The species of spiked rare earth elements in sediment and potential bioavailability to algae (Chlorella Vulgarize Beijerinck). Chemosphere 1998, 36, (2), 329-337.
22. Hare, L., Aquatic insects and trace metals: bioavailability, bioaccumulation, and toxicity. Critical Reviews in Toxicology 1992, 22, (5-6), 327-369.
23. Zhou, Q.; Zhang, J.; Fu, J.; Shi, J.; Jiang, G., Biomonitoring: an appealing tool for
assessment of metal pollution in the aquatic ecosystem. Analytica Chimica Acta 2008, 606, (2), 135-50.
24. Croteau, M.-N.; Hare, L.; Tessier, A., Refining and Testing a Trace Metal Biomonitor (Chaoborus) in Highly Acidic Lakes. Environmental Science & Technology 1998, 32, (9), 1348-1353.
25. Fulton, R. J., Geological Survey of Canada. Surficial Materials of Canada: Map 1880A. Geological Survey of Canada: 1995.
26. Conrad, O.; Bechtel, B.; Bock, M.; Dietrich, H.; Fischer, E.; Gerlitz, L.; Wehberg, J.; Wichmann, V.; Böhner, J., System for Automated Geoscientific Analyses (SAGA) v. 2.1.4. Geoscientific Model Development 2015, 8, (7), 1991-2007.
27. Wetzel, R. G., Limnology: lake and river ecosystems. Gulf Professional Publishing: 2001; p 1006.
28. Donato, S.; Reinhardt, E.; Boyce, J.; Pilarczyk, J.; Jupp, B., Particle-size distribution of inferred tsunami deposits in Sur Lagoon, Sultanate of Oman. Marine Geology 2009, 257, (1-4), 54-64.
29. Van Hengstum, P.; Reinhardt, E.; Boyce, J.; Clark, C., Changing sedimentation patterns due to historical land-use change in Frenchman’s Bay, Pickering, Canada: evidence from high-resolution textural analysis. Journal of Paleolimnology 2007, 37, (4), 603-618.
30. Murray, M. R., Is laser particle size determination possible for carbonate-rich lake sediments? Journal of Paleolimnology 2002, 27, (2), 173-183.
560 561 562 563 564 565 566 567 568 569 570 571 572 573 574 575 576 577 578 579 580 581 582 583 584 585 586 587 588 589 590 591 592 593 594 595 596 597 598 599 600 601
31. Thorp, J. H.; Covich, A. P.; Dimmick, W. W., Introduction to invertebrates of inland waters. In Ecology and Classification of North American Freshwater Invertebrates (Third Edition),
Elsevier: 2009; pp 1-23.
32. Haney, J.; Aliberti, M.; Allan, E.; Allard, S.; Bauer, D.; Beagen, W.; Bradt, S.; Carlson, B.; Carlson, S.; Doan, U., An-image-based key to the zooplankton of North America. Version 5.0. University of New Hampshire Center for Freshwater Biology. In 2013.
33. Snape, I.; Scouller, R. C.; Stark, S. C.; Stark, J.; Riddle, M. J.; Gore, D. B., Characterisation of the dilute HCl extraction method for the identification of metal contamination in Antarctic marine sediments. Chemosphere 2004, 57, (6), 491-504.
34. Dolegowska, S.; Migaszewski, Z. M., Anomalous concentrations of rare earth elements in the moss-soil system from south-central Poland. Environmental Pollution 2013, 178, 33-40. 35. Tipping, E.; Lofts, S.; Sonke, J. E., Humic Ion-Binding Model VII: a revised
parameterisation of cation-binding by humic substances. Environmental Chemistry 2011, 8, (3), 225-235.
36. Bryan, S. E.; Tipping, E.; Hamilton-Taylor, J., Comparison of measured and modelled copper binding by natural organic matters in freshwaters. Comparative Biochemistry and Physiology C - Toxicology & Pharmacology 2002, 133, (1-2), 37-49.
37. Hare, L.; Tessier, A., The aquatic insect Chaoborus as a biomonitor of trace metals in lakes. Limnology and Oceanography 1998, 43, (8), 1850-1859.
38. Wickham, H., ggplot2: Elegant Graphics for Data Analysis. Springer-Verlag New York. 2016.
39. Peters, G., userfriendlyscience: Quantitative analysis made accessible. doi: 10.17605/osf.io/txequ, R package version 0.7.1, https://userfriendlyscience.com. 2018.
40. Hastie, T.; Efron, B., Least Angle Regression, Lasso and Forward Stagewise. https://cran.r-project.org/web/packages/lars/index.html. 2013.
41. Tibshirani, R., Regression Shrinkage and Selection via the Lasso. Journal of the Royal Statistical Society. Series B. 1996, 58, (1), 267-288.
42. Efron, B.; Hastie, T.; Johnstone, I.; Tibshirani, R. Least angle regression, Technical report, Department of Statistics.; 2002.
43. James, G.; Witten, D.; Hastie, T.; Tibshirani, R., An introduction to statistical learning. Springer: 2013; Vol. 112.
44. Tibshirani, R.; Tibshirani, R.; Taylor, J.; Loftus, J.; Reid, S., selectiveInference: Tools for Post-Selection Inference, https://CRAN.R-project.org/package=selectiveInference. 2017. 45. Condie, K. C., Another look at rare earth elements in shales. Geochimica et Cosmochimica Acta 1991, 55, (9), 2527-2531.
46. Leybourne, M. I.; Johannesson, K. H., Rare earth elements (REE) and yttrium in stream waters, stream sediments, and Fe–Mn oxyhydroxides: Fractionation, speciation, and controls over REE+Y patterns in the surface environment. Geochimica et Cosmochimica Acta 2008, 72, (24), 5962-5983.
47. Goldstein, S. J.; Jacobsen, S. B., Rare earth elements in river waters. Earth and Planetary Science Letters 1988, 89, (1), 35-47.
48. Morantz, D. L.; Hoos, R. Nechalacho Rare Earth Project Effluent Quality Criteria Report; 2013. 602 603 604 605 606 607 608 609 610 611 612 613 614 615 616 617 618 619 620 621 622 623 624 625 626 627 628 629 630 631 632 633 634 635 636 637 638 639 640 641 642 643 644
49. Romero-Freire, A.; Minguez, L.; Pelletier, M.; Cayer, A.; Caillet, C.; Devin, S.; Gross, E. M.; Guerold, F.; Pain-Devin, S.; Vignati, D. A. L.; Giamberini, L., Assessment of baseline ecotoxicity of sediments from a prospective mining area enriched in light rare earth elements. Science of the Total Environment 2018, 612, 831-839.
50. Marmolejo-Rodríguez, A. J.; Prego, R.; Meyer-Willerer, A.; Shumilin, E.; Sapozhnikov, D., Rare earth elements in iron oxy−hydroxide rich sediments from the Marabasco River-Estuary System (pacific coast of Mexico). REE affinity with iron and aluminium. Journal of Geochemical Exploration 2007, 94, (1-3), 43-51.
51. Pernice, M.; Boucher, J.; Boucher-Rodoni, R.; Joannot, P.; Bustamante, P., Comparative bioaccumulation of trace elements between Nautilus pompilius and Nautilus macromphalus (Cephalopoda: Nautiloidea) from Vanuatu and New Caledonia. Ecotoxicology and
Environmental Safety 2009, 72, (2), 365-71.
52. Bustamante, P.; Miramand, P., Subcellular and body distributions of 17 trace elements in the variegated scallop Chlamys varia from the French coast of the Bay of Biscay. Science of the Total Environment 2005, 337, (1-3), 59-73.
53. Strady, E.; Kim, I.; Radakovitch, O.; Kim, G., Rare earth element distributions and
fractionation in plankton from the northwestern Mediterranean Sea. Chemosphere 2015, 119, 72-82.
54. Marsac, R.; Davranche, M.; Gruau, G.; Bouhnik-Le Coz, M.; Dia, A., An improved description of the interactions between rare earth elements and humic acids by modeling: PHREEQC-Model VI coupling. Geochimica et Cosmochimica Acta 2011, 75, (19), 5625-5637. 55. Tang, J.; Johannesson, K. H., Speciation of rare earth elements in natural terrestrial waters: assessing the role of dissolved organic matter from the modeling approach. Geochimica et Cosmochimica Acta 2003, 67, (13), 2321-2339.
56. Andersson, K.; Dahlqvist, R.; Turner, D.; Stolpe, B.; Larsson, T.; Ingri, J.; Andersson, P., Colloidal rare earth elements in a boreal river: Changing sources and distributions during the spring flood. Geochimica et Cosmochimica Acta 2006, 70, (13), 3261-3274.
57. Chételat, J.; Richardson, M. C.; MacMillan, G. A.; Amyot, M.; Poulain, A. J., Ratio of Methylmercury to Dissolved Organic Carbon in Water Explains Methylmercury Bioaccumulation Across a Latitudinal Gradient from North-Temperate to Arctic Lakes. Environmental Science & Technology 2018, 52, (1), 79-88.
58. Lavoie, I.; Lavoie, M.; Fortin, C., A mine of information: benthic algal communities as biomonitors of metal contamination from abandoned tailings. Science of the Total Environment 2012, 425, 231-241.
59. Ponton, D. E.; Hare, L., Assessment of nickel contamination in lakes using the phantom midge Chaoborus as a biomonitor. Environmental Science & Technology 2009, 43, (17), 6529-6534.
60. Meylan, S.; Behra, R.; Sigg, L., Influence of metal speciation in natural freshwater on bioaccumulation of copper and zinc in periphyton: a microcosm study. Environmental Science & Technology 2004, 38, (11), 3104-3111.
61. Mylon, S. E.; Twining, B. S.; Fisher, N. S.; Benoit, G., Relating the speciation of Cd, Cu, and Pb in two Connecticut rivers with their uptake in algae. Environmental Science & Technology 2003, 37, (7), 1261-1267. 645 646 647 648 649 650 651 652 653 654 655 656 657 658 659 660 661 662 663 664 665 666 667 668 669 670 671 672 673 674 675 676 677 678 679 680 681 682 683 684 685 686 687
62. Hare, L.; Tessier, A., Predicting animal cadmium concentrations in lakes. Nature 1996, 380, (6573), 430.
63. Weltje, L.; Verhoof, L. R. C.; Verwelj, W.; Hamers, T., Lu speciation and toxicity in a microbial bioassay: Testing the free-ion model for lanthanides. Environmental Science & Technology 2004, 38, 6597-6604.
64. Vukov, O.; Smith, D. S.; McGeer, J. C., Acute dysprosium toxicity to Daphnia pulex and Hyalella azteca and development of the biotic ligand approach. Aquatic Toxicology 2016, 170, 142-51.
65. El-Akl, P.; Smith, S.; Wilkinson, K. J., Linking the chemical speciation of cerium to its bioavailability in water for a freshwater alga. Environ Toxicol Chem 2015, 34, (8), 1711-9. 66. Tan, Q. G.; Yang, G.; Wilkinson, K. J., Biotic ligand model explains the effects of competition but not complexation for Sm biouptake by Chlamydomonas reinhardtii. Chemosphere 2017, 168, 426-434.
67. Zhao, C. M.; Wilkinson, K. J., Biotic ligand model does not predict the bioavailability of rare Earth elements in the presence of organic ligands. Environmental Science & Technology 2015, 49, (4), 2207-2214.
68. Lawrence, M. G.; Greig, A.; Collerson, K. D.; Kamber, B. S., Direct quantification of rare earth element concentrations in natural waters by ICP-MS. Applied Geochemistry 2006, 21, (5), 839-848.
69. Verplanck, P. L.; Nordstrom, D. K.; Taylor, H. E.; Kimball, B. A., Rare earth element partitioning between hydrous ferric oxides and acid mine water during iron oxidation. Applied Geochemistry 2004, 19, (8), 1339-1354.
70. Zhang, X.-c.; Liu, G.; Zheng, F., Understanding erosion processes using rare earth element tracers in a preformed interrill-rill system. Science of The Total Environment 2018, 625, 920-927. 71. Tyler, G.; Olsson, T., Plant uptake of major and minor mineral elemenst as influenced by soil acidity and liming. Plant and Soil 2001, 230, 307-321.
688 689 690 691 692 693 694 695 696 697 698 699 700 701 702 703 704 705 706 707 708 709 710 711 712 713 714
FIGURE CAPTIONS:
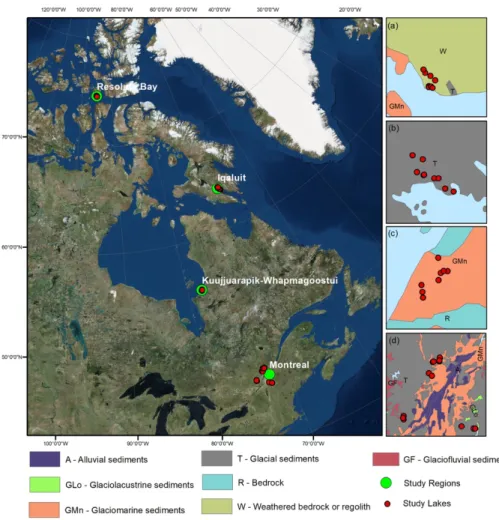
FIGURE 1: Map of the sampling regions in Eastern Canada. Large scale inset panels on right show
surficial geology deposits (Fulton 1995) for lakes sampled near (a) Resolute Bay (N = 8); (b) Iqaluit (N = 9); (c) Kuujjuarapik-Whapmagoostui (N = 8); and (d) Montreal (N = 14). The geological provinces of sample lakes from north to south respectively are (a) Arctic Platform, (b) Churchill Province, (c)
Superior Province, and (d) Appalachian & Grenville Provinces.
FIGURE 2: Boxplots showing a) ∑REEY concentrations in surface water (log-scaled nmol L-1), b)
∑REEY concentrations in surface sediment (log-scaled nmol g-1), c) sediment-water partition
coefficients or Kd (L kg-1) and d) ∑REEY concentrations in bulk zooplankton (log-scaled nmol g-1).
Boxplots show median ± SD. Red dots are outliers and letters indicate statistically significant differences in concentrations (Welch’s ANOVA, Games-Howell post-hoc tests).
TABLE 1: Comparison table for total REE concentrations (REEY, REE) and selected single
elements concentrations (La, Yb) from previously published studies on REEs in freshwater environments including surface waters and sediments.
FIGURE 3: Linear regressions for a) surface water REEY as a function of sediment REEY
concentrations, b) zooplankton REEY concentrations as a function of surface water REEY and c) zooplankton REEY concentrations as a function of surface sediment REEY and d) zooplankton REEY concentrations as a function of sediment-water partition coefficient or Kd (L kg-1). Data shown
for all lakes near Montreal, Kuujjuarapik-Whapmagoostui (K-W), Iqaluit and Resolute (p < 0.05). All variables are log-scaled.
FIGURE 4: Linear regressions for bulk zooplankton La concentrations as a function of 1) surface water
La concentrations, 2) ratio of surface water La to DOC concentrations, 3) surface water La free ion (La3+) concentrations for lakes from all study regions (p < 0.001). Surface water La3+ concentrations
were calculated with the Windermere Humic Aqueous Model software (WHAM 7.0.5). All variables on the x- and y-axes are log-scaled. Similar figures for Ce and Dy are shown in SI (Fig. S4).
715 716 717 718 719 720 721 722 723 724 725 726 727 728 729 730 731 732 733 734 735 736 737 738 739 740 741 742 743
FIGURE 1: Map of the sampling regions in Eastern Canada. Large scale inset panels on right show surficial geology deposits (Fulton
1995) for lakes sampled near (a) Resolute Bay (N = 8); (b) Iqaluit (N = 9); (c) Kuujjuarapik-Whapmagoostui (N = 8); and (d) Montreal (N = 14). The geological provinces of sample lakes from north to south respectively are (a) Arctic Platform, (b) Churchill Province, (c) Superior Province, and (d) Appalachian & Grenville Provinces.
744 745 746 747 748 749 750 751 752 753
FIGURE 2: Boxplots showing a) ∑REEY concentrations in surface water (log-scaled nmol L-1), b) ∑REEY concentrations in surface
sediment (log-scaled nmol g-1), c) sediment-water partition coefficients or Kd (L kg-1) and d) ∑REEY concentrations in bulk
zooplankton (log-scaled nmol g-1). Boxplots show median ± SD. Red dots are outliers and letters indicate statistically significant
differences in concentrations (Welch’s ANOVA, Games-Howell post-hoc tests). 755 756 757 758 759 760 761
TABLE 1: Comparison table for total REE concentrations (REEY, REE) and selected single elements concentrations (La, Yb) from previously published studies on REEs in freshwater environments including surface waters and sediments.
Freshwater Ecosystems
Surface Waters Description pH Filter m REEY REE La Yb Units Reference
Eastern Canada 39 lakes 6.5 - 8.3 0.45, 0.7 0.09 - 20.8 0.06 - 18.2 0.02 - 5.50 0.001 - 0.117 nmol L-1 Current Study
Tuscany (IT) 6 rivers (reference) 4.4 - 7.8 0.45 - 0.34 - 7.81 0.06 - 1.38 0.014 - 0.116 nmol L-1 Protano & Riccobono (2002)*
Tuscany (IT) 4 streams (mining) 3.1 - 5.6 0.45 - 711 - 6494 143 - 1332 6.70 - 40.9 nmol L-1 Protano & Riccobono (2002)
Alpine Regions (FR) 2 alpine streams 7.5 0.45 - 2.26 - 2.74 0.19 - 0.86 0.023 - 0.147 nmol L-1 Aubert et al. (2002)
Rotterdam (NL) 5 rivers/ditches 7.3 - 8.7 0.45 - 10 - 25 0.6 - 2.4 0.05 - 0.2 nmol L-1 Weltje et al. (2002) †
Northern Canada 1 acidic lake 3.6 0.40 - 68.6 8.56 1.13 nmol L-1 Johannesson & Lyons (1995)
SE Queensland (AU) 19 rivers/streams 5.7 - 7.7 0.22, 0.45 0.88 - 36.5 0.49 - 29.2 0.09 - 8.33 0.014 - 0.232 nmol L-1 Lawrence et al. (2006)
Western Siberia (RU) 70 large & small rivers 4.7 - 8.1 0.45 - 0.61 - 24.4 0.10 - 3.67 0.017 - 0.450 nmol L-1 Pokrovsky et al. (2016)
Surface Sediments Description %POC %OM REEY REE La Yb Units Reference
Eastern Canada 39 lakes - 1.8 - 75.5 314 - 3391 252 - 3049 46 - 1032 2.7 - 25.2 nmol g-1 Current Study
- 1.8 - 75.5 42 - 463 36 - 433 6.4 - 143 0.47 - 4.36 µg g-1
Marabasco River (MX) 13 sampling sites 0.1 - 1.7 - - 318 - 872 62 - 185 4.3 - 13.8 nmol g-1 Marmolejo-Rodríguez et al. (2007)
0.1 - 1.7 - - 46 - 126 8.6 - 25.7 0.75 - 2.38 µg g-1
Northern Quebec (CA) 3 rivers/streams - 7.0 - 73.9 - - - - nmol g-1 Romero-Freire et al. (2018)
- 7.0 - 73.9 - 71 - 185 - - µg g-1
Europe Streams - - - 1389 295 18 nmol g-1 Migaszewski & Gałuszka 2015**
- - - 199 41 3.1 µg g-1
*Original reference values taken from Hoyle et al. (1984) and Keasler & Loveland (1982) † Values estimated using a web-based software for extracting data from plots (Webplotdigitizer) Total REE for this study do not include the element terbium (Tb)
** Original values from Salminen et al. (2005)
762 763 764 765 766 767 768 769 770 771
FIGURE 3: Linear regressions for a) surface water REEY as a function of sediment REEY concentrations, b) zooplankton REEY concentrations as a function of surface water REEY and c) zooplankton REEY concentrations as a function of surface sediment REEY and d) zooplankton REEY concentrations as a function of sediment-water partition coefficient or Kd (L kg-1).
Data shown for all lakes near Montreal, Kuujjuarapik-Whapmagoostui (K-W), Iqaluit and Resolute (p < 0.05). All variables are log-scaled and linear equations are calculated with log-transformed variables.
772 773 774 775 776 777 778 779
FIGURE 4: Linear regressions for bulk zooplankton La concentrations as a function of 1) surface water La concentrations, 2) ratio of
surface water La to DOC concentrations, 3) surface water La free ion (La3+) concentrations for lakes from all study regions (p <
0.001). Surface water La3+ concentrations were calculated with the Windermere Humic Aqueous Model software (WHAM 7.0.5). All
variables on the x- and y-axes are log-scaled. Similar figures for Ce and Dy are shown in SI (Fig. S4). 780 781 782 783 784 785 786 787