Changements climatiques et interactions écologiques
affectant le pergélisol et l'activité des coins de glace
dans la vallée de la rivière Narsajuaq, Nunavik (Canada)
Thèse
Samuel Gagnon
Doctorat en sciences géographiques
Philosophiæ doctor (Ph. D.)
Changements climatiques et interactions écologiques
affectant le pergélisol et l’activité des coins de glace
dans la vallée de la rivière Narsajuaq, Nunavik (Canada)
Thèse
Samuel Gagnon
Sous la direction de :
Michel Allard
Résumé
Afin de déterminer l’impact direct des changements climatiques sur la dynamique des coins de glace et le régime thermique du pergélisol, 16 sites d’échantillonnage dans la vallée de la rivière Narsajuaq (Nunavik, Canada) qui ont fait l’objet d’études substantielles sur les coins de glace en 1989 et 1990 ont été revisités entre 2016 et 2018. Les observations et les mesures démontrent qu’au cours des 25 dernières années, les coins de glace de la vallée de la rivière Narsajuaq ont subi une dégradation sans précédent de leurs excroissances, engendrant un approfondissement généralisé des étages principaux en raison de l’approfondissement de la couche active qui a atteint des profondeurs de 1,2 à 3,4 fois supérieures à celles de 1991. Le régime thermique des quatre principaux types de sols identifiés (organique sableux mince, organique sableux épais, organique épais et sables fluviatiles) dans la vallée a fait l’objet de simulations numériques afin de reproduire les changements de température du pergélisol depuis 1990 et de prévoir les variations de l’épaisseur de la couche active jusqu’en 2100. Au cours des dernières décennies, les coins de glace de tous les types de sol ont été actifs, se fissurant presque tous les ans, excepté en 2010, l’année la plus chaude jamais enregistrée. Pour le reste du 21ième siècle, les simulations prédisent l’arrêt complet de la fissuration du sol entre 2020 et 2095 en fonction du type de sol, des seuils de craquement et des scénarios climatiques choisis. Cependant, en prenant en compte la variabilité interannuelle du climat, il est très probable que plusieurs coins de glace cesseront de fissurer au cours des 20-30 prochaines années. La couche active a atteint une profondeur record en 2010, puis s’est amincie avec le refroidissement récent. Il est attendu qu’elle s’approfondisse suffisamment au cours des prochaines décennies pour causer une dégradation généralisée des coins de glace, ne laissant que des coins de glace fossiles en profondeurs dans le pergélisol d’ici la fin du siècle. Cette thèse propose également une nouvelle approche permettant d’améliorer les estimations des réserves de carbone dans le pergélisol arctique en se basant sur la photo-interprétation de la géologie de surface et des formes de relief ainsi que sur la reconstitution de l’histoire géologique du paysage. Une forte correspondance existe en effet, entre les formes du relief et les formations meubles d’une part et les stocks de carbone sous forme de matière organique dans les sols, d’autre part.
Abstract
To determine the direct impact of climate change on ice-wedge dynamics and the permafrost thermal regime, 16 study sites in the Narsajuaq river valley (Nunavik, Canada) that were extensively studied for ice wedge between 1989 and 1991 were revisited between 2016 and 2018. Observations and measurements show that over the last 25 years, the ice wedges of the Narsajuaq river valley have experienced an unprecedented degradation of their upgrowth forms, resulting in a generalized deepening of their main stages due to the active layer reaching depths 1.2 to 3.4 times greater than in 1991. The thermal regime of the four main soil types identified (thin sandy peat, thick sandy peat, thick peat, fluvial sands) in the valley was modelled to reproduce permafrost temperature changes since 1990 and predict active layer thickness until 2100. In recent decades, ice wedges of all soil types have been active, cracking almost every year except in 2010, the warmest year on record. For the rest of the 21st century, simulations predict a complete cessation of soil cracking between 2020 and 2095 depending on the soil type, soil cracking threshold and the selected climate scenarios. However, based on the interannual variability of the climate in the region, it is very likely that ice wedges will stop cracking over the next 20-30 years. The active layer reached a record depth in 2010, then moved up with recent cooling. It is expected that the active layer will deepen sufficiently in the next few decades to cause widespread ice-wedge degradation, leaving only fossil ice-wedge roots deep in permafrost by the end of the century. This thesis also suggests a new approach to improve estimates of carbon stocks in Arctic permafrost based on image analysis of surface geology and landforms, as well as on the reconstitution of the geological history of Arctic permafrost landscapes. There is a strong connection between landscape features and surficial geology on the one hand, and carbon stocks as organic matter in soils on the other.
Table des matières
Résumé ... ii
Abstract ... iii
Table des matières ... iv
Liste des figures ... vii
Liste des tableaux ... ix
Liste des acronymes ... x
Liste des symboles ... xi
Remerciements ... xiii
Avant-propos ... xiv
Introduction ... 1
Chapitre 1. Changes in ice-wedge activity over 25 years of climate change near Salluit, Nunavik (Northern Québec, Canada) ... 5
Résumé ... 5 Abstract ... 6 1.1 Introduction ... 7 1.2 Study sites ... 8 1.3 Methods ... 9 1.4 Results ... 10
1.4.1 Variations in active layer thickness (ALT) ... 10
1.4.2 Ice wedges ... 11
1.4.3 Landscape changes ... 13
1.5 Discussion ... 15
1.5.1 Variations in active layer thickness and impacts on water drainage ... 15
1.5.2 Scenarios for ice-wedge degradation ... 16
1.5.3 Ice-wedge activity ... 17 1.5.4 Change in vegetation ... 18 1.6 Conclusion ... 19 1.7 Figures ... 20 1.8 Tables ... 33 Acknowledgements ... 35
References ... 35
Chapitre 2. Modelled (1990-2100) variations in active- layer thickness and ice-wedge activity near Salluit, Nunavik (Canada) ... 39
Résumé ... 39 Abstract ... 40 2.1 Introduction ... 41 2.2 Study site ... 42 2.3 Methods ... 43 2.3.1 Field measurements ... 43 2.3.2 Thermal modelling ... 44
2.3.3 Snow cover thickness ... 48
2.4 Results ... 48
2.4.1 Assessment of the simulations ... 48
2.4.2 Degree-days, n-factors, snow cover thickness and active layer variations ... 49
2.4.3 Ice-wedge activity ... 50
2.4.4 ALT and soil-cracking threshold predictions ... 51
2.5 Discussion ... 51
2.5.1 Simulation of field conditions ... 51
2.5.2 Ice-wedge activity ... 52
2.5.3 Active-layer variations ... 53
2.5.4 Implications for future ice-wedge degradation ... 53
2.6 Conclusion ... 55
2.7 Figures ... 56
2.8 Tables ... 65
Acknowledgements ... 71
References ... 71
Chapitre 3. Geomorphological controls over carbon distribution in permafrost soils: the case of the Narsajuaq river valley, Nunavik (Canada) ... 75
Résumé ... 75
Abstract ... 76
3.1 Introduction ... 77
3.3 Methods ... 80
3.3.1 Image analysis of the landscape ... 80
3.3.2 Total carbon content ... 80
3.3.3 Carbon mapping classes ... 81
3.4 Results ... 82
3.5 Discussion ... 83
3.5.1 Assessment of the new approach ... 83
3.5.2 Implications for estimates of greenhouse gas emissions ... 84
3.6 Conclusion ... 85 3.7 Figures ... 86 3.8 Tables ... 90 Acknowledgements ... 90 References ... 90 Conclusion ... 94 Bibliographie ... 98
Liste des figures
Figure 1.1. a) Location of the Narsajuaq river valley in Northern Québec, Canada, and location of the study sites. The valley is about 9 km west of Salluit. The SILA climate station and the borehole recording soil temperatures are indicated with red dots. b) Soil map of the Narsajuaq river valley. The edges of the main terraces are indicated with barbed lines (terrace bluff). ... 20 Figure 1.2. Mean annual air temperature trends for Salluit, Northern Québec, Canada. ... 21 Figure 1.3. Soil temperature measured in a borehole located in a polygonal peatland near Salluit. . 22 Figure 1.4. Photographs of ice wedges on D2 (a) and D9 (b, c). ... 23 Figure 1.5. Shapes and features of excavated ice wedges on sites with ice wedges. ... 28 Figure 1.6. Photographs taken in 1991 (left) and in 2017 (right) of the sites G2 and G3 (a, b), D5 (c, d) and of a drained lake near G8 (e, f). ... 29 Figure 1.7. Erosion gullies initiated by ice-wedge degradation. ... 30 Figure 1.8. Photographs taken in 1990 (left) and in 2017 (right) of the sites D1 (a, b, c, d) and D9 (e, f). ... 31 Figure 1.9. Ice-wedge degradation scenarios. ... 32 Figure 2.1. Location of the Narsajuaq river valley in Northern Québec, Canada. ... 56 Figure 2.2. Mean annual air temperature (MAAT) trends from 1948 to 2017 in Salluit, Northern Québec, Canada. ... 57 Figure 2.3. Mean annual air temperature (MAAT) trends from 2000 to 2100 in Salluit, Northern Québec, Canada. ... 58 Figure 2.4. Measured (HOBO data loggers) and modelled (TONE simulations) soil surface temperature between August 15, 2016 and August 13, 2018 for a) thick sandy peat cover (TkSPC), b) thick peat cover (TkPC), c) thin sandy peat cover (TnSPC), and d) fluvial sands (FS). The sites used for comparison have similar soil compositions. ... 60 Figure 2.5. Measured (Narsajuaq climate station) and modelled (TONE simulations) monthly soil surface temperature (a) and average ground temperature from July 1989 to July 1991 (b). ... 61 Figure 2.6. a) Air temperature thawing degree-days (TDDa) and thawing season average air temperature (TSAT). b) Air temperature freezing degree-days (FDDa) and freezing season average air temperature (FSAT). ... 62 Figure 2.7. a) Modelled annual active layer thickness (ALT) for the four types of modelled soil profile from 1990 to 2017 and air temperature thawing degree-days (TDDa) from 2003 to 2017. All sites were prominently influenced by changes in TDD. b) Air temperature thawing (TDDa) and freezing (FDDa) degree-days and mean annual air tempeture (MAAT) from the SILA climate station from 2003 to 2017. ... 63 Figure 2.8. Modelled annual active layer thickness (ALT) for the four types of modelled soil profiles from 2000 to 2100. The data was modelled based on a reanalysis (2000-2002) and the Salluit
automated climate station (2002-2017; black line SILA) and on the RCP-4.5 (red line) and RCP-8.5 (blue line) simulations. The dotted black lines show the ALT in 2010. Note that the y-axes start at
0.3 m and the different scale for d) fluvial sands (FS). ... 64
Figure 3.1. Location of the Narsajuaq river valley in Nunavik (Northern Québec), Canada. ... 86
Figure 3.2. Vegetation map of the Narsajuaq river valley. ... 87
Figure 3.3. Soil map. ... 88
Liste des tableaux
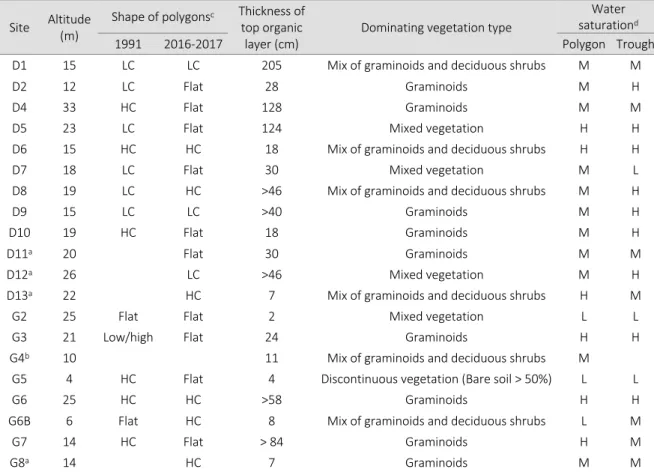
Table 1.1. Characteristics of the sites visited in 1991 and 2016-2017. ... 33 Table 1.2. Average thickness of the active layer (cm) for each site in 1991, 2016, 2017 and 2018. . 34 Table 1.3. Summary of the underground features (ice wedge, ice veins, tunnels) found in the pits dug to unearth ice wedges in 2017. The zeros were left blank to facilitate reading. ... 34 Table 1.4. Average depths of the IW stages measured in 1991 and in 2017. ... 35 Table 2.1. Characteristics of the sampling sites in the Narsajuaq river valley. ... 65 Table 2.2. Soil physical properties of the layers in the four types of modelled soil profile by TONE (TkSPC = Thick sandy peat cover; TkPC = Thick peat cover; TnSPC = Thin sandy peat cover; FS = Fluvial sands). Thawing (nt) and freezing (nf) n-factors are also indicated for each soil profile. ... 66 Table 2.3. Measured (field measurements) and modelled (TONE simulations) active layer thicknesses (ALTs) between 1990 and 2018. The sites used for comparison have similar soil compositions. .... 67 Table 2.4. Modelled active layer thickness (ALT) since 2010 in two soil profiles (Thin sand peat cover, TnSPC, and thick peat cover, TkPC) and depths of ice lenses and of a truncated ice vein from four pits. ... 68 Table 2.5. n-factors and calculated snow cover thickness for two freezing seasons (2016-2017 and 2017-2018) and one thawing season (2017). ... 69 Table 2.6. Modelled minimum freezing season temperature at the top of permafrost (TTOP) from 1989 to 2018 (the year indicates when the freezing season ended) for the four types of modelled soil profile. ... 70 Table 2.7. Mean annual air temperature (MAAT) and modelled active layer thickness (ALT) of the four types of modelled soil profiles in 1992, 2010 and 2100. ... 71 Table 3.1. Characteristics of the sites visited in 2016-2017. ... 90 Supplementary table 1. Modelled (RCP-4.5) minimum freezing season temperature at the top of permafrost (TTOP) from 2019 to 2100 (the year indicates when the freezing season ended) for the four types of modelled soil profiles. TTOP depth was determined using modelled annual ALT of the preceding thawing season. Boxes in gray indicate years when minimum soil temperature did not reach the soil thermal cracking thresholds, i.e. -15°C (Allard and Kasper, 1998) and -13°C (Fortier and Allard, 2005). ... 101 Supplementary table 2. Modelled (RCP-8.5) minimum freezing season temperature at the top of permafrost (TTOP) from 2019 to 2100 (the year indicates when the freezing season ended) for the four types of modelled soil profiles. TTOP depth was determined using annual ALT of the preceding thawing season. Boxes in gray indicate years when minimum soil temperature did not reach the soil thermal cracking thresholds, i.e. -15°C (Allard and Kasper, 1998) and -13°C (Fortier and Allard, 2005). ... 104
Liste des acronymes
ALT = Active-layer thickness CG = Coin de glace
FDD = Freezing degree-day
FDDa = Air temperature freezing degree-day
FDDs = Soil surface temperature freezing degree-day FS = Fluvial sands
FSAT = Freezing season average air temperature IW = Ice wedge
MAAT = Mean annual air temperature
NCSCD = Northern Circumpolar Soil Carbon Database O<40 cm = Shallow organic cryosol
O³40 cm = Deep organic cryosol
PgC = petagram of carbon = 1015 g of carbon RCP = Representative concentration pathway SD = Standard deviation
TCC = Total carbon content TDD = Thawing degree-day
TDDa = Air temperature thawing degree-day
TDDs = Soil surface temperature thawing degree-day TkPC = Thick peat cover
TkSPC = Thick sandy peat cover TnSPC = Thin sandy peat cover
TSAT = Thawing season average air temperature TTOP = Temperature at the top of permafrost
Liste des symboles
a = Unfrozen water constant b = Unfrozen water constant
C = Ground specific heat capacity Ca = Air specific heat capacity
Ci = Ice specific heat capacity
Cm = Ground material specific heat capacity
Cw = Water specific heat capacity Ke = Kersten’s number
l = Ground thermal conductivity ldry = Dry ground thermal conductivity lsat = Saturated ground thermal conductivity nf = Freezing n-factor
nt = Thawing n-factor
p = Porosity
q = Volumetric fraction of air
qv = Volumetric water content
r = Volumetric fraction of ice
rdry = Dry density
T = Temperature
The size of your dreams must always exceed your current capacity to achieve them.
If your dreams do not scare you, they are not big enough.
Remerciements
Je tiens d’abord à remercier mon directeur de recherche, Michel Allard, pour son soutien, sa confiance et sa patience. Au cours des sept dernières années, il a su me guider à travers des chemins sinueux et m’a toujours encouragé pour que j’obtienne le meilleur de moi-même. Je remercie aussi les membres de mon comité de direction, Najat Bhiry et Warwick Vincent, pour leur aide et leurs encouragements. Mes remerciements s’adressent également au personnel du Centre d’études nordiques, à mes assistants de recherche Alexandre Chiasson et Sarah Gauthier, et au personnel de l’Université Laval des différents départements qui m’ont aidé durant mon parcours.
Je remercie aussi les organismes subventionnaires qui m’ont permis de me consacrer entièrement à mes études : FQRNT, CRSNG et Fondation W. Garfield Weston.
Finalement, merci à ma famille, mes amis et collègues pour leurs encouragements et leur intérêt pour mes travaux de recherche.
Avant-propos
Cette thèse est organisée en trois chapitres, lesquels sont précédés par une introduction générale incluant les problématiques de recherche soutenues par une revue de littérature, les objectifs ainsi que les hypothèses. Le chapitre 1 inclut la majorité des observations sur les coins de glace faites sur le terrain. Ce chapitre a été accepté pour publication dans la revue Permafrost and Periglacial Processes en août 2019 comme article scientifique ; il aborde les changements dans la morphologie et l’activité des coins de glace ainsi que l’impact du réchauffement climatique sur la végétation et le ravinement des terrasses. Comme premier auteur, j’ai été responsable des travaux de terrain, de l’acquisition des données et de l’analyse des résultats. J’ai rédigé la première version de l’article et intégré les révisions suggérées par le co-auteur et superviseur de thèse Michel Allard. J’ai également fait les corrections en collaboration avec Michel Allard lors de la révision par les pairs.
Le second chapitre est la continuité du premier. Il aborde d’autres questions restées sans réponse sur l’activité et la dégradation des coins de glace en utilisant la modélisation thermique de différents sols identifiés dans la vallée d’étude et émet des projections jusqu’en 2100. Ce chapitre a été soumis à la revue Journal of Geophysical Research : Earth Surface le 12 novembre 2019 comme article scientifique. Comme premier auteur, j’ai été responsable des travaux de terrain, de l’acquisition des données, de la modélisation thermique et de l’analyse des résultats. J’ai rédigé la première version de l’article et intégré les révisions suggérées par le co-auteur Michel Allard.
Le dernier chapitre traite d’une méthode cartographique pour améliorer la quantification des stocks de carbone des sols arctiques. En effet, le carbone, sa décomposition et les émissions de gaz à effet de serre devaient initialement être au centre de la thèse, mais les observations faites durant les premières campagnes de terrain nous ont amené à réorienter la thèse. L’analyse cartographique de la vallée et l’étude des propriétés physiques et chimiques des sols étaient centrales à ce chapitre, mais ont également profité à l’ensemble de la thèse. Ce chapitre a été soumis à la revue Arctic Science le 15 novembre 2019 comme article scientifique. Comme premier auteur, j’ai été responsable des travaux de terrain, de l’acquisition des données, de la production cartographique et de l’analyse des résultats. J’ai rédigé la première version de l’article et intégré les révisions suggérées par le co-auteur Michel Allard.
Introduction
Au cours des 30 dernières années, l’Arctique s’est réchauffée deux fois plus rapidement que le reste de la planète (IPCC, 2013). Le pergélisol, lequel est un sol (ou roc) qui demeure à une température égale ou inférieure à 0 °C pendant au moins deux années consécutives (Harris, 1988), s’étend sur plus de 25% de la surface terrestre de l’hémisphère Nord et près de 50% du Canada (Gruber, 2012). Il est perçu comme la colonne vertébrale de l’Arctique, dont la dynamique à long-terme détermine celle des écosystèmes du Nord et le mode de vie de ses habitants. Cependant, l’étendue du pergélisol a commencé à diminuer en raison de son dégel causé par des hausses de température du sol jusqu’à 2°C au cours des dernières décennies (Biskaborn et al., 2019; Romanovsky et al., 2010). La dégradation du pergélisol peut générer une multitude de changements écologiques (Loranty & Goetz, 2012; Pelletier et al., 2019), hydrologiques (Walvoord et al., 2012; Walvoord & Kurylyk, 2016; Woo & Young, 2006), géomorphologiques (Abbott & Jones, 2015; Kokelj & Jorgenson, 2013; Lewkowicz & Way, 2019; Olefeldt et al., 2016; Schuur et al., 2015) et biogéochimiques (MacDougall et al., 2012; Schaefer et al., 2014; Schneider von Deimling et al., 2012), engendrant des rétroactions sur les systèmes environnementaux et le climat planétaire. La glace souterraine contenue dans le pergélisol est particulièrement importante puisque la vulnérabilité locale et régionale du paysage lors du dégel du pergélisol dépend de son contenu variable, de sa morphologie et de sa distribution (Becker et al., 2016; French & Shur, 2010; Lachenbruch, 1962; Liljedahl et al., 2016).
Les coins de glace sont une des formes de glace souterraine les plus répandues dans les milieux nordiques (Harry & Gozdzik, 1988; Lachenbruch, 1962), composant près de 20% du volume des trois premiers mètres des sols pergélisolés (Jorgenson et al., 2015; Liljedahl et al., 2016; Pollard & French, 1980). Ils se forment dans les sols (et parfois le socle rocheux) où les températures hivernales sont suffisamment froides pour causer la fissuration du sol par contraction thermique (Kasper & Allard, 2001; Lachenbruch, 1962; Mackay, 1974; Sarrazin & Allard, 2015). L’eau de fonte des neiges peut ensuite s’infiltrer dans les fissures ouvertes et former des veines de glace, lesquelles grossiront et deviendront des coins de glace si le processus continue de se répéter. Les coins de glace sont particulièrement intéressants puisqu’ils sont de bons indicateurs de changement climatique (Jorgenson et al., 2006; Kasper & Allard, 2001; Lewkowicz, 1994) ; durant les périodes plus froides, les coins de glace sont actifs et grossissent, alors que durant les périodes plus chaudes ceux-ci deviennent inactifs et parfois même de dégradent. Ils sont très sensibles aux variations climatiques puisque leur sommet correspond généralement au plafond du pergélisol (Jorgenson et al., 2006; Lachenbruch, 1962) et est donc soumis aux changements de profondeur de la couche active (Kasper & Allard, 2001).
Malgré l’attention grandissante que les régions nordiques reçoivent, les mesures sur plusieurs décennies de l’impact direct des changements climatiques sur le régime thermique du pergélisol et la dynamique des coins de glace demeurent fragmentaires (e.g. Jorgenson et al., 2006; Jorgenson et al., 2015; Liljedahl et al., 2016; Necsoiu et al., 2013) et encore plus rares celles qui pré-datent le début du réchauffement dans les régions nordiques. Entre 1989 et 1991, Kasper et Allard (2001) on fait l’étude de la morphologie et de l’activité des coins de glace au cours de l’Holocène récent dans la vallée de la rivière Narsajuaq, Nunavik. Leurs travaux pré-datait le début du réchauffement climatique au Nunavik, lequel ne s’est amorcé qu’autour de 1992 alors que la température moyenne était -10°C, s’élevant aujourd’hui jusqu’à environ -6°C. En revisitant le même site d’étude, nous avons eu l’opportunité unique de faire des comparaisons directes de l’impact des changements climatiques sur le paysage, le régime thermique du pergélisol et la morphologie et l’activité des coins de glace entre des observations récentes de terrain et des données pré-datant un réchauffement climatique d’une amplitude connue
À l’échelle régionale, la vallée de la rivière Narsajuaq est également une zone riche en carbone souterrain. En effet, la vallée glaciaire s’est édifiée dans une région composée principalement de substrat rocheux datant du Protérozoïque; elle a été façonnée par le mouvement de l’inlandsis laurentidien lors de la dernière glaciation. Après la déglaciation, la phase marine et la dynamique d’incision fluviale qui ont suivi le retrait des glaciers, les périodes plus chaudes et humides de l’Holocène récent ont contribués à l’accumulation et l’emprisonnement par le gel de matière organique dans la vallée (Kasper & Allard, 2001). À l’échelle circumpolaire, le pergélisol arctique contient le plus grand réservoir de carbone organique souterrain avec 1455 ± 125 PgC (1 PgC = 1015 g de carbone), l’équivalent de deux fois le carbone présentement présent dans l’atmosphère (Schuur et al., 2015; Tarnocai et al., 2009; Zimov et al., 2006). Ce carbone, auparavant emprisonné par le gel, menace maintenant d’être libéré en raison du dégel du pergélisol causant la décomposition de la matière organique. Cela aurait comme effet d’amplifier l’effet de serre et possiblement d’engendrer une rétroaction positive sur le climat planétaire (Schaefer et al., 2014; Schaphoff et al., 2013). Cependant, les prédictions demeurent imprécises en raison des larges incertitudes associées aux estimations des stocks de carbone dans les sols arctiques (Hugelius, 2012; Kuhry et al., 2010; Mishra et al., 2013). En effet, les données utilisées ne couvrent que certaines parties de l’Arctique et les cartes utilisées pour mettre les données à l’échelle globale sont inadéquates. Comme un échantillonnage systématique de l’Arctique est impossible en raison des contraintes logistiques (Mishra et al., 2013), il devient essentiel d’identifier des nouvelles méthodes pour améliorer les estimations des réserves de carbone organique souterrain de l’Arctique.
La vallée de la rivière Narsajuaq, en raison des études qui y ont été réalisées au début des années 90 et de son emplacement au Nunavik, lequel est une région sensible aux changements climatiques, a permis d’entreprendre des travaux de géomorphologie originaux. L’objectif principal de la thèse était d’identifier et de quantifier l’impact des changements climatiques sur les coins glace et le paysage de la vallée de la rivière Narsajuaq afin de mieux comprendre quelles seront les répercussions potentielles dans le reste de l’Arctique au cours des prochaines décennies. L’hypothèse globale énonçait que les changements climatiques ont été suffisants pour affecter les coins de glace, la végétation ainsi que certaines formes du paysage et que des effets similaires seront perceptibles dans les régions plus au nord en raison des hausses de températures attendues au cours des prochaines décennies. Plus spécifiquement, la thèse a abordé deux thèmes principaux : 1) la morphologie et l’activité des coins de glace, et 2) l’estimation des réserves de carbone souterrain. Ces thèmes ont été étudiés dans trois chapitres qui composent cette thèse avec leurs propres objectifs et hypothèses qui sont, respectivement :
1. Comparer l’impact direct des changements climatiques sur la morphologie et l’activité des coins de glace, la végétation, l’hydrologie de surface ainsi que le régime thermique du pergélisol en revisitant des sites étudiés entre 1989 et 1991 (thème 1);
Hypothèse 1.1. L’approfondissement de la couche active a entraîné la dégradation des coins de glace.
Hypothèse 1.2. La majorité des coins de glace ne sont plus actifs dans la vallée.
Hypothèse 1.3. Il y a maintenant plus d’eau à la surface en raison de l’augmentation des précipitations au Nunavik.
Hypothèse 1.4. Il y a maintenant plus de mousse et de sphaigne en raison de conditions plus humides à la surface, ce qui a pu ralentir l’approfondissement de la couche active.
2. Modéliser le régime thermique du pergélisol et les variations de l’épaisseur de la couche active dans différents types de sol entre 1990 et 2100 afin d’identifier les seuils d’activité et d’arrêt des coins de glace et d’évaluer l’impact futur du réchauffement du pergélisol sur la dégradation de ceux-ci (thème 1);
Hypothèse 2.1. L’approfondissement de la couche active s’est fait lentement jusqu’en 2009, puis abruptement en 2010.
Hypothèse 2.2. La couche active continuera de s’approfondir au cours des prochaines décennies, abaissant le dessus des coins de glace avant la fin du siècle.
Hypothèse 2.3. La contraction thermique des sols s’est arrêtée entre 1995 et ~2014.
Hypothèse 2.4. La contraction thermique des sols s’arrêtera au cours des prochaines décennies (40-50 ans).
Hypothèse 2.5. Les sites sans ou avec une couverture organique mince seront les plus affectés par le réchauffement climatique.
Hypothèse 2.6. Les variations de température des saisons de gel et de dégel ont toutes les deux un impact sur l’épaisseur de la couche active.
3. Utiliser le lien entre la géologie de surface, les formes de relief du paysage et le contenu en carbone souterrain du pergélisol afin d’élaborer une méthode pour améliorer les estimations du contenu en carbone des sols arctiques (thème 2).
Chapitre 1. Changes in ice-wedge activity over 25 years
of climate change near Salluit, Nunavik
(Northern Québec, Canada)
Samuel Gagnon & Michel Allard
Résumé
Afin d’évaluer l’impact direct des changements climatiques sur la dégradation des coins de glaces (CG), 16 sites de la vallée de la rivière Narsajuaq (Nunavik, Canada) qui ont fait l’objet d’une étude approfondie entre 1989 et 1991 ont été revisités en 2016, 2017 et 2018. 109 trous ont été creusés pour noter les caractéristiques des sols ainsi que les formes et les profondeurs des CG. Les changements des conditions de surface ont également été constatés à l’aide de comparaisons de photographies récentes (2017) et des photographies plus anciennes (1989-1991) prises sur le terrain et aériennes. Au cours des 25 dernières années, la couche active a atteint des profondeurs 1,2 à 3,4 fois supérieures à celles de 1991, ce qui a entraîné une dégradation généralisée des CG dans la vallée. Alors que 94% des CG déterrés en 1991 présentaient plusieurs structures de croissance récente, seulement 13% des 55 CG découverts en 2017 avaient encore de telles structures. Les sommets des CG sont maintenant systématiquement plus profonds que les étages principaux des CG mesurés en 1991. Cependant, en août 2017, environ la moitié des CG avaient des veines de glace les reliant à la base de la couche active, ce qui indique que le refroidissement récent (2010-maintenant) dans la région a été suffisant pour réactiver la fissuration des sols et la croissance des CG. Cet article souligne la grande sensibilité des sols arctiques aux variations climatiques à court terme.
Abstract
To assess the direct impact of climate change on ice-wedge (IW) degradation, 16 sites in the Narsajuaq river valley (Nunavik, Canada) that were extensively studied between 1989 and 1991 were revisited in 2016, 2017 and 2018. 109 pits were dug to record soil characteristics and IW shapes and depths. Changes in surface conditions were also noted using side-by-side comparisons of recent (2017) and older (1989-1991) land and aerial photographs. During the past 25 years, the active layer reached depths that were 1.2 to 3.4 times deeper than in 1991, which led to the widespread degradation of IWs in the valley. Whereas 94% of the IWs unearthed in 1991 showed multiple recent growth structures, only 13% of the 55 IWs unearthed in 2017 still had some upgrowth stages left. Ice-wedge tops are now consistently deeper than the main stages of the IWs measured in 1991. In August 2017, however, about half of the IWs had ice veins connecting them to the base of the active layer, an indication that the recent cooling spell (2010-now) in the region was enough to reactivate frost cracking and IW growth. This paper highlights how sensitive the Arctic soil system can be to short-term climate variations.
1.1 Introduction
Ice wedges (IWs) are one of the most abundant forms of ground ice in permafrost (Harry & Gozdzik, 1988; Lachenbruch, 1962). They are estimated to globally represent 20% of ground ice volume in the top three meters of permafrost-affected areas (Pollard & French, 1980; Jorgenson et al., 2015; Liljedahl et al., 2016). They develop in soils (and sometimes in bedrock) where winter temperatures are low enough to cause thermal contraction cracking of the ground, most often creating polygonal ground patterns in the tundra (Lachenbruch, 1962; Mackay, 1974; Allard & Kasper, 1998; Sarrazin & Allard, 2015). Large IWs require centuries to millennia to grow (Fortier & Allard, 2004) and their growth results in adjacent soil material being deformed along the sides of the IWs. Geometrical networks of tundra polygons are then formed and can have a variety of shapes such as low-centered (or raised-edge) or high-centered polygons (Lachenbruch, 1962; Mackay, 2000; Kasper & Allard, 2001). The low-centered polygons are generally associated with active IWs (i.e. repeated soil thermal cracking during winter and soil expansion in polygons in summer) and the high-centered ones are often associated with inactive or melting IWs (Kasper, 1995; Lara et al., 2015). Variations in active layer thickness (ALT) in response to climate fluctuations, particularly warmer summers, and to changes in surface conditions (e.g. snow cover thickness) directly control the depth of IW tops (Lachenbruch, 1962; Mackay, 1978; Mackay, 1999; Kasper & Allard, 2001; Jorgenson et al., 2006; Vonk et al., 2013; Raynolds et al., 2014). Ice wedge size, morphology and 3-D distribution are particularly important because they play an important role in landscape changes as permafrost thaws (Becker et al., 2016; French & Shur, 2010; Lachenbruch, 1962; Lewkowicz & Way, 2019; Liljedahl et al., 2016). Although the thawing of IWs in permafrost regions due to climate warming is well documented by remote sensing and field observations (e.g. Jorgenson et al., 2015; Jorgenson et al., 2006; Liljedahl et al., 2016; Necsoiu et al., 2013), little is known about how the process of IW formation, i.e. ground thermal cracking, responds to climate variations. There is also a paucity of documentation about how the morphology of IWs evolves under climate variations below and above the climatic threshold for ground cracking and with fluctuations of the ALT.
Kasper and Allard (1998; 2001) studied IW activity and morphology in the field between 1989 and 1991 to understand the temperature conditions for IW cracking and to link late-Holocene climatic changes with the growth and decay of IWs near Salluit, Nunavik, Canada. In addition to noting that the cracks actually opened in winter when the temperature at the permafrost table was about -15°C, they extensively studied IW morphology and related soil cryoturbations. Based on reconstructed observed IW activity, they interpreted that the Little Ice Age was a period of intense IW cracking in Nunavik, followed by a period of inactivity during the first half of the 20th century and a reactivation
during a cooling period from 1946 to 1992. During that late phase, the IWs grew upward with the thinning of the active layer. They concluded that this IW activity was a regional climatic response and that the threshold for IW reactivation lied between mean annual air temperatures (MAAT) of -7.8°C (1946) and -8.9°C (1991). This period of cooling ended in 1992 when MAAT started to rise from -10.7 °C to reach about -6.1 °C nowadays (Way & Bonnaventure, 2015; Friedlingstein et al., 2006; Centre d'études nordiques (CEN), 2019).
By revisiting the same study area, we had the unique opportunity to directly observe and measure changes by comparing recent data with observations (Allard & Kasper, 1998; Kasper & Allard, 2001) pre-dating a climate warming period of known amplitude. During the summers of 2016, 2017 and 2018, we revisited 16 sites originally investigated between 1989 and 1991 (referred to as 1991 in the text). We documented the changes in polygon morphology, depths of IW tops, and morphology of IWs that have taken place under known changing climate conditions. The obvious initial hypothesis was that climate warming led to a deepening of the active layer and caused valley-wide IW degradation, with impacts in the landscape. In addition, it was expected that soil cracking and IW activity would be halted or greatly reduced in frequency due to temperatures rising above the estimated climatic threshold. Vegetation and hydrological changes that took place in the tundra during the past 25 years were also documented in order to assess the impacts of changes in ALT and of IW degradation.
1.2 Study sites
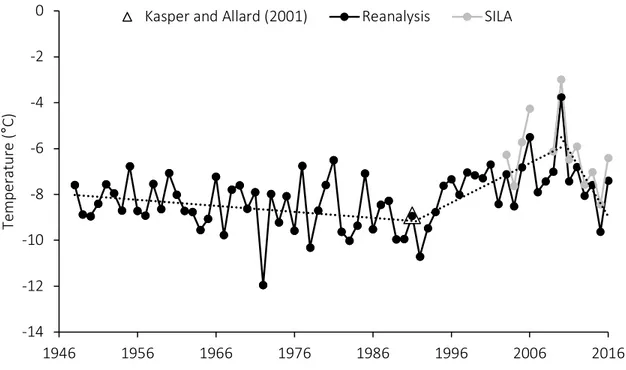
The study area extends over fluvial terraces on both sides of the lowest 8 km of the Narsajuaq river before it reaches Sugluk fjord, in Nunavik Canada (62°09’53”N, 75°47’53”W). The valley is located about 9 km west of Salluit (Figure 1.1a). The post-glacial marine and fluvial sediments on the floor of this U-shaped valley are underlain by continuous permafrost. The Salluit region has a climate typical of the low Arctic (Elger et al., 2012). It receives about 524 mm of precipitation annually, of which 50% is snow (Charron, 2015). A reanalysis based on data from Environment Canada shows that the average air temperature for the 1948-1992 period was -8.6°C (Figure 1.2) (Way & Bonnaventure, 2015; Way et al., 2017b; Way et al., 2017a). During this period, temperatures were cooling at an average rate of -0.02°C/yr until they abruptly started to rise. For the period 1992-2016, the average was -7.4°C, though there has been a slight cooling spell since 2010. A MAAT of -8.9°C was recorded in 1991 (Figure 1.2) (Kasper & Allard, 2001); in 2017, the Salluit automated climate station recorded -6.1°C (CEN, 2019).
It is estimated that the valley was deglaciated about 7.5 kyr ago (Kasper & Allard, 2001). As postglacial emergence took place, the river carved its bed into several raised channels, leaving fluvial terraces at elevations from 90 to 0.5 m a.s.l (Kasper & Allard, 2001). Following the emergence of the terraces in the late-Holocene, aeolian sand accumulated over the fluvial sediments, followed by alternating depositions of layers of sandy peat and peaty sand that started around 3020-3645 cal. BP. The top organic layer varies from almost absent with sparse lichens over sandy surfaces to thick (1-2 m) organic layers often supporting a low shrub vegetation cover (Figure 1.1b). Frost cracks and tundra polygons are visible on all terrace levels.
1.3 Methods
Sixteen IW polygon sites that had been studied in August between 1989 and 1991 by Kasper and Allard (2001) were revisited in the same month in 2016 and 2017. Located on different terrace levels, the sites varied in soil composition, vegetation composition and structure, and surface drainage conditions (Table 1.1). Given the lateness in the thawing season for all the survey years (August), the thaw front depth measured in soil pits and with a steel probe is considered here as representative of the ALT.
Except for site G4, all sites had polygonal networks. Four additional sites (D11, D12, D13, G8) were also sampled in order to increase the number of observations and better represent local variability. We noted at each site the types of polygons (high-centered, low-centered, flat), water saturation level in the troughs (dry, soil saturated with water or through filled with water) and completed vegetation surveys using classes from the ADAPT Protocol (www.cen.ulaval.ca/adapt/index.php), i.e. deciduous shrubs, evergreen shrubs, graminoids, forbs, mosses, lichens, rock and stones, bare soil, to which a Sphagnum sp. class was added. The 16 main study sites were visited again in 2018 to note ALT on each site (10 measurements per site). Soil temperature data were obtained near Salluit from a borehole in a polygonal peatland with similar soil conditions to sites with organic deposits, about 11 km east of the valley (Figure 1.3) (Fouché et al., 2014; Gagnon et al., 2016). This site has been recording soil temperature hourly at 2, 10, 20, 30, 40, 50, 60, 70, 80, 90, 100 and 125 cm depths since 2011. Air temperature measurements were obtained from the Salluit automated climate station, which belongs to the SILA network of CEN of Laval University and is operational since 2002.
To study soil composition, four pits were dug on each site, i.e. three in polygon troughs and one in a polygon center. The pits reached the thaw front and in most cases it was possible to reach mineral deposits beneath the surface organic layers (Table 1.1). In the active layer, we noted the different soil horizons, their color, texture, and whether the horizons seemed dominated by organic or mineral
deposits. On three sites (D1, D4, D5) where the base of the organic surface layer was deeper than the thaw front, a portable earth drill (Calmels et al., 2005) was used to core down to the mineral deposits, reached at depths between 1.3 and 2.5 m. Pits in troughs were also used to unearth IW tops. Additional pits were dug on sites where multiple pits had been dug by Kasper and Allard (2001) in 1991 (D1, D2, D4, D9, D10). Those pits were used to study IW shapes and to measure IW top depths in order to detect changes after 25-27 years. Three or four pits for IWs were also dug on the new sites (D11, D12, D13, G8). All pits were dug in sections of troughs that were slightly elevated above the surrounding troughs to avoid water seeping in too rapidly and filling the pits. Once the pits were open, they were deepened about every other day and after about a week of digging it was generally possible to see the IW (Figure 1.4). In those pits, IW and related structure characteristics were noted, i.e. the presence of tunnels, ice at the bottom of the tunnels, and ice veins at the bottom of the active layer. ALT was also measured as well as the width, depth, and shape of IW tops. We noted the color of wedge ice and whenever there were other forms of ice and ice veins connecting the IW to the surface. In total, 109 pits were dug in 20 different sites during the summers 2016 and 2017, and 88 of them were intended specifically to unearth IWs. In addition, field notes, photographs, 35-mm slides, and sketches dating back to 1989-1991 from Kasper and Allard (2001) were used to make direct comparisons. New landscape photographs from the same viewpoints (or as close as possible) were taken for comparisons of vegetation cover and detection of possible geomorphic changes.
In order to better assess the geomorphological context and explain the spatial variations of soil organic covers, a soil map was produced by interpreting air photographs of the area and by mapping vegetation/landform patterns on the high-resolution multispectral satellite image (Worldview-3; 31 cm resolution in panchromatic). We also used information about the nature of the surficial deposits (Kasper, 1995) and descriptions of stratigraphic sequences in river bluffs from Kasper and Allard (2001). The thickness of the top organic horizons and the concentration of ponds were critical interpretation criteria for defining and contouring the soil units of the map (see legend, Figure 1.1b).
1.4 Results
1.4.1 Variations in active layer thickness (ALT)
Following the 1946-1992 cooling period in Nunavik, the climate abruptly started to warm up and led to an increase in temperature of ~3°C in Salluit over 26 years. The warming brought about an large increase of ALT, which probably reached its maximum thickness in summer 2010, the warmest year on record with a mean annual air temperature of 3.0°C. The average ALT was about 52% (range = -13% to +94%), 49% (-19 to +138%) and 40% (-48% to +99%) deeper in 2016, 2017 and 2018
respectively than in 1991, although ALT decreased on some sites (D9 and D10) (Table 1.2). The change in ALT varied greatly from one terrace to another because of their different soil composition, hydrological conditions and vegetation composition. For example, whereas it was not possible to reach the thaw front on G5 (>100 cm), a site composed of sandy substrate with sparse vegetation on top, ALT was less than 40 cm for peat-rich sites such as D1, D5 and G6. ALTs on sites where the top organic-sandy layers were thicker than 30 cm were on average 25% shallower than on sites with thinner organic cover. ALTs on a same site generally varied within ±10 cm from the local average.
1.4.2 Ice wedges
Ice wedges were found in 12 sites and visible in 55 of the 88 pits dug (63%). More than 70% of the IWs found were located on sites where the surface sandy peat layer was >30 cm, which accounts for about half of the total number of sites. The shape, ice color, size and depth of the IW varied across sites, but most of the IWs were white with vertical foliations, sometime with sand in the ice (Figure 1.5). In a few instances, parts of the IWs were made of dark translucent ice or brownish ice (e.g. D11, D12) and it was sometime possible to see peat fibers or clumps incorporated into the ice (e.g. D5, G7). The dark ice was interpreted as pool ice (Mackay, 2000), which is the result of water accumulating in cavities left by melted IW during the previous summers and that froze in following winters.
Ice veins were found in 44 pits, i.e. 50% of all the pits dug (Table 1.3). Whereas most of the IWs unearthed in 1991 had ice veins extending upward to the thaw front, only 58% of the IWs in 2017 had ice veins connecting them to the thaw front. Most of those ice veins went through pool ice at the bottom of tunnels. Kasper and Allard (2001) noted open cracks in the active layer during their fieldwork, i.e. cracks that had remained open during the summer, but had not been filled by surface water to form ice veins. In 2016 and 2017, only cracks with thin vegetation roots crossing them when pulling the ground up with a shovel in troughs were visible. The next sections regroup soil and IW characteristics of sites with thick sandy peat, thin sandy peat and fluvial sand deposits, the three main types of soil material found in the valley (Figure 1.1b).
1.4.2.1 Sites with thick sandy peat cover: D1, D4, D5, D6, D8, D9, D12, G6, G7
Sites with thick sandy peat cover (TkSPC) were characterized by a top organic layer >30 cm, sometime more than one meter thick (e.g. D1, D4, D5) (Table 1.1). Most of the sites were dominated by graminoids and deciduous shrubs, except for sites D5 and D12 that were covered by mixed vegetation. Except for one site (D6), IWs were found in all pits and ice veins were visible at the
bottom of the thawed layer in the vast majority of them, although some of the veins did not reach down to the IW (D4_CG6, D5_CG4) (Table 1.3). IWs ranged in width from thick ice veins (2-5 cm) to wide, more mature IWs (110-120 cm). Average IW top depths were all deeper than the average depth of the IW main stages in 1991 (Table 1.4).
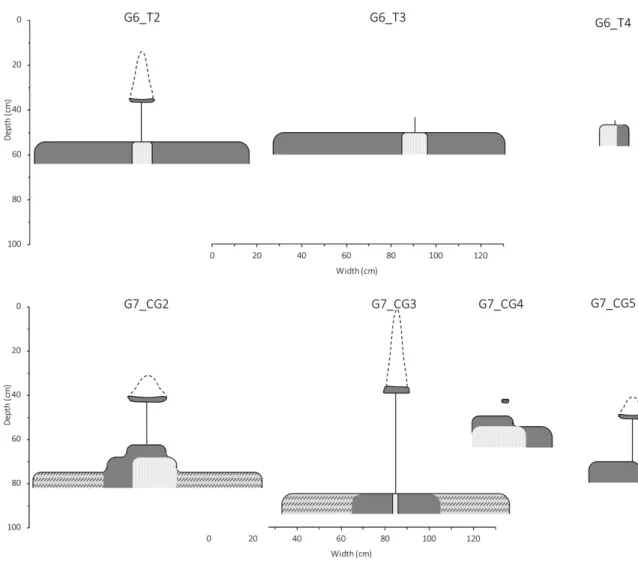
On D5, the IWs were not as sharply defined as in other sites because peat was often mixed with the ice. D6 was in a wet area with water standing in troughs and the ground was highly saturated with water. The troughs were quite large and appeared in degradation. Shrubs on this site were taller than on other sites, sometime close to 2 m high. There were no signs of surficial cracking and no ice vein or IW were visible. On sites D12 and G6, IWs were all wide (~1 m) (except for G6_T4) compared to other IWs found in the valley. They were also all composed of clear ice in the center and darker ice on the sides. Ice wedges on G7 were similar to those of D12 and G6, but some peat was mixed with the ice. IWs were largely composed of pool ice, and it was also possible to see stages in pool ice on G7_CG2 and G7_CG4.
1.4.2.2 Sites with thin sandy peat cover: D2, D7, D10, D11, D13, G3, G6B, G8
Sites with thin sandy peat cover (7 to 30 cm thick; TnSPC) were generally drier than sites with TkSPC. All polygonal networks were either flat or high-centered (Table 1.1). Most of the sites were dominated by graminoids and deciduous shrubs, except for D7 that was covered by mixed vegetation. IWs were found in only four of the eight sites (D2, D7, D10, D11), but not in all pits (Table 1.3). IW widths varied between 3 and 41 cm. Ice veins were visible at the bottom of the thawed layer in almost all the pits with IWs, but many of them did not reach down to the IW depth (D2_T3, D2_CG2, D7_CG2, D10_CG3, D11_CG1, D11_CG3). In addition, some ice veins were present in the frozen soil, but without an IW beneath (D7, D10, G6B, G8). On those sites, ice veins were found in V-shaped inclusion of organic matter going deeper in the troughs.
1.4.2.3 Sites with fluvial sand deposits: G2, G5
Sites on fluvial sand deposits, either with continuous or discontinuous surface vegetation, had dry surfaces and there was no standing water in the troughs. They had either mixed vegetation or no vegetation, and when vegetation was present, a thin layer of organic matter (<5 cm) covered the sand deposits. No IW on G2 or G5 were found; in 1991, G5 had multistage IWs with upgrowth forms as shallow as 52 cm from the surface.
1.4.2.4 Number of growth stages and changes in depth of ice-wedge tops
In August 1991, 94% of the IWs had recent upgrowths forms due to climate cooling between 1946 and 1991. Upgrowth forms varied in shape and ice composition and most of the IWs had two (37%) or three (26%) stages. In 2017, only 13% of the IWs unearthed still had stages left (Figure 1.5). Thus, the majority of upgrowth forms that formed during the second half of the 20th century melted in the past 26 years and the few IWs with upgrowth forms that remain (D2_T3, D4_CG3, D7_CG2, D7_CG5, D9_CG7, D10_CG4, D11_CG1) only have two stages left due to the deepening of the active layer. IW tops are now 1.1 to 1.6 times deeper than in 1991 (Table 1.4).
1.4.2.5 Tunnels and pool ice
Tunnels in the active layer over thawed IWs were found in 56% (n = 31) of the pits with an IW. The tunnels generally were triangular in cross-section and their size varied from a few centimeters in height and width to more than 60 cm. They were always in the top organic layers, above the mineral horizons. Two types of tunnels were observed: 1) above the IW and disconnected from the main body of ice, and 2) directly on top of the IW. Most of the tunnels (81%) were located between 5 and 50 cm above the main body of the IW. On site D4_CG8, which was located near the site of a cliff, flowing water carved into the IW forming a U-shaped runnel; peat clumps were frozen in the ice at the bottom of the runnel (Figure 1.5).
Pool ice was found at the bottom of the active layer and in tunnels. The ice sometime included organic matter clumps due to soil material falling from the sides of the water-filled cavities before refreezing (Kasper & Allard, 2001). In most cases, pool ice formed slabs of ice at the bottom of the tunnels (Figure 1.5). Pool ice was present without a tunnel in only a few pits (D5_CG3, D7_CG7 (not shown), D8_T1, D12_CG1, D12_CG2, D12_CG3). Many IWs that were made of white foliated ice were encased in dark pool ice (e.g. D11, DG6), the latter sometime composing most of the observed ground ice volume (e.g. G6).
1.4.3 Landscape changes
1.4.3.1 Polygonal networks
Cold climate conditions in the early 1990s were highly favorable for frost cracking. Kasper and Allard (2001) noted that high-centered polygons dominated on the drier sites with sandy substrates while peaty sites with wetter conditions had low-centered polygons. Almost all sites now have flat or high-centered polygons (Table 1.1). Comparison of photographs (1989-1991 vs 2017) shows a general
decrease in surface water coverage on the tundra (Figure 1.6). Whereas standing water was apparent in numerous shallow puddles and ponds the early 1990s, many of them had dried out in 2016 and 2017. In addition, polygon troughs were generally weakly or moderately saturated with water and fewer troughs had standing water in them in 2016 and 2017. Standing water was only visible on sites with TkSPC. In 2017, the conditions changed during the summer, i.e. there was a lot more standing water in troughs during July than in August. Kasper (1995) noted that standing water in troughs and in the centers of low-centered polygons at most sites was very common between 1989 and 1991. In 2016, 2017, 2018, we did not observe any polygon with water in the center.
On some terraces, it was possible to observe erosion gullies along the patterns of the polygonal networks (Figure 1.7 a-b). Starting from the edge, the number of ramifications of the gullies increased when going into the terraces, making a dendritic drainage basin expanding upstream. In active areas, pieces of ground were falling off and in some instances, the ground was collapsing (Figure 1.7 c-d). Some gullies had evolved into stabilized ravines several meters wide (e.g. D7, D10) (Figure 1.7 e-f). The trunk of those large erosion gullies appeared stabilized as no falling ground was apparent and vegetation covered the sides of the ravines.
1.4.3.2 Vegetation
Vegetation composition in the polygon fields varied mostly depending on the hydrological conditions of each site. The most abundant vegetation class found in the valley was a mix of graminoids and deciduous shrubs (33.3% cover), followed closely by the graminoids class (32.1%), which included sedges (e.g. Carex sp.), grasses (e.g. Poa sp.) and rushes (e.g. Luzula sp.). Deciduous shrubs (Betula sp. and Salix sp.) were found in open areas, but also in patches in hollows and along runnels, totaling 14.6% cover. The rest of the vegetation (mixed vegetation) was a mix of mosses, Sphagnum sp., evergreen shrubs, forb species and lichens, although the last two were less common.
Photographs from the early 1990s show that mosses and Sphagnum sp. were dominant on sites saturated with water. In addition, deciduous shrubs used to be mostly confined to areas protected from the prevailing winds whereas they are now also found in open areas (Figure 1.8). The photographs from 1991 also show a dominance of lichens on the raised ridges of the tundra polygons; this was no longer observed in 2016-2017 as the ridges were mostly covered by graminoids and shrubs. In the troughs, Kasper (1995) reported the presence of Carex aquatilus and Actophila fulva in wetter portions and Luzula confusa and Luzula nivalis in drier areas. We rather observed a dominance of graminoid and deciduous shrub species and in some instances thick Sphagnum sp. and moss cover.
1.5 Discussion
1.5.1 Variations in active layer thickness and impacts on water drainage
The climate variations that took place over the past 25 years first brought about an large increase in ALT. The current depths of the IW tops suggest that the maximum thaw depths in 2010 were 1.2 to 3.4 times greater than in 1991. This indicates that the base of the active layer on many sites reached down to levels pre-dating the cooling period of 1946-1992 during the recent warming trend. After the warm peak of 2010, colder years (Figure 1.2) caused the permafrost table to move back up. This is supported the decreasing ALTs measured in 2016, 2017 and 2018 that were shallower than the IW tops. Sites with TnSPC and fluvial sands had the deepest ALTs because mineral soils have a higher thawed thermal conductivity than organic soils. ALTs on those sites was 1.2-1.6 (TnSPC) to 2.7-3.2 (fluvial sands) times larger than sites with TkSPC. The truncated IWs that could still be present are now beyond reach of digging with a shovel.
Despite the overall warming of the past 26 years, two sites had shallower ALTs than in 1991: D9 and D10. It is difficult to explain exactly why it is so as these two sites have soil characteristics similar to other sites in the valley. Both are dominated by graminoids and are in relatively exposed areas where wind can easily erode snow and thus reduce accumulation. It is possible that some local surface conditions changed since 1991 and led to changes in the ground thermal regime, such as changes in vegetation, snow cover, wind patterns or organic matter accumulation. Nevertheless, the warming trend of 1992-2010 still caused an increase in ALT that was sufficient to melt the IW tops to levels below the main stages measured in 1991. Hence, the shallower ALTs observed in 2016-2017-2018 can be linked to the recent cooling spell (2010-now).
Deepening of the active layer in generally sandy soils also led to draining of shallow ponds and small lakes through groundwater seepage. Although Nunavik has been experiencing an increase in total annual precipitations of approximately 10% during the period 1981-2010 (Charron, 2015), a decrease in surface water coverage was observed in the Narsajuaq valley (Figure 1.6). Deepening of the active layer increases the space available for groundwater flow and thus allows for better surface water drainage (Jorgenson et al., 2010; Walvoord & Kurylyk, 2016). Variations in ALT are particularly important in permafrost hydrology as thaw depth regulates infiltration, water storage in the perched water table and subsurface flow (Carey & Woo, 2005; Yamazaki et al., 2006; Wright et al., 2009; Koch et al., 2014). The nature of the soil material can also affect groundwater flow as larger soil particles (e.g. coarse sand) have higher hydraulic conductivities than fine particles (e.g. clay) (Bear, 1988). Where thin organic surface layers were present, the maximum thaw depth moved down from
the top layers (<30 cm) to the underlying mineral layers. As a result, subsurface drainage was improved. Furthermore, tunnels that form on top of decayed IWs and that lead to erosion bluffs are conduits that can also contribute to improve surface drainage. When gullies reach far into the terraces with multiple ramifications, water is drained more easily and channeled into the larger ravines.
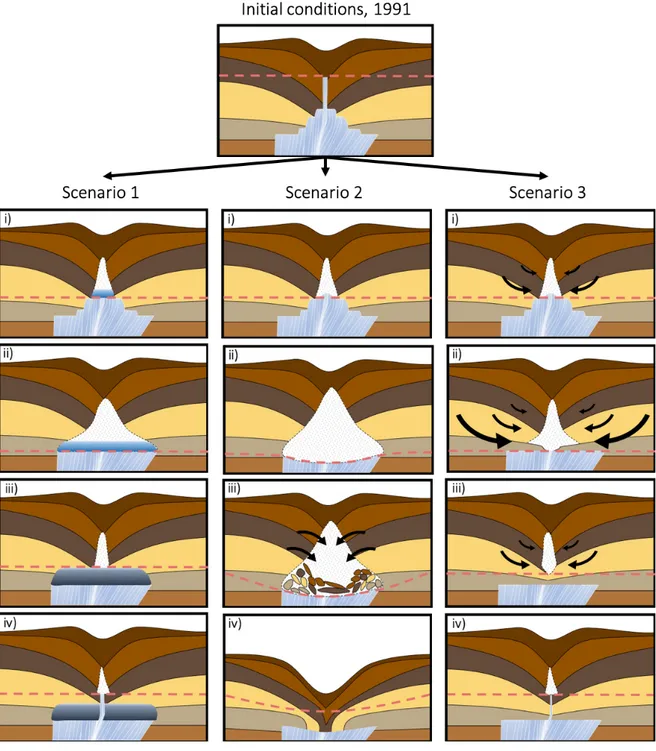
1.5.2 Scenarios for ice-wedge degradation
The excavation of IWs generally showed two features: 1) pool ice at the top of permafrost in voids formerly occupied by IWs, and 2) tunnels. Our observations suggest that once the upgrowth forms melt, three different scenarios can occur (Figure 1.9). First, water can accumulate in the tunnel and form pool ice that takes on the shape of the “ghost wedge” (Kasper & Allard, 2001). This creates a mass of pool ice above the main body of the IW or in melted upgrowth forms. Over time, if the climate gets cold enough again, renewed ground frost cracking will occur through the mass of pool ice and foliated white ice will form into it. This is likely what happened on sites with peaty organic matter such as on D12 and G6 where new IWs, which are white and foliated, have formed in dark translucent pool ice.
In the second scenario, the tunnel remains open directly on top of the IW and increases in size with time due to water and/or air flow. This scenario occurs on sites composed of cohesive material that can hold shape, i.e. peaty soils. In the tunnel, water and air circulate and thermally erode the IW deeper than the active layer in the surroundings (e.g. D4_CG8). As the IW melts and the tunnel is eroded, the tunnel eventually becomes too large and its roof collapses, forming an erosion gully where water is channeled. This can significantly affect the landscape (Fortier et al., 2007; Godin & Fortier, 2012) and lead to wider, more mature ravines (Figure 1.7).
The third scenario was the most common one encountered in the study area. In this case, the tunnel is found at the base of the active layer, above the IW deeper in sand. Since the tunnel is not directly on top of the IW, melting of IW tops alone cannot be the only formation mechanism. The disconnection is caused by the collapse of the tunnel from below due to thawed saturated sand creeping and caving in from the sides (Figure 1.9). In that process, the deeper sandy layers under the top organic layer, the caving in of liquefied saturated sand fills the tunnel left by the melting of the IW tops, leaving only the upper part of the tunnel open in the cohesive organic layer above. This caving in process was indeed observed when digging soil pits in water-saturated soil. On sites with TkSPC, the cavities cave in due to combined action of the water flowing in with sediments and the increasing pressure from the layers above as the thaw front progresses. If cold enough temperatures reoccur, the soil can crack and an ice vein can form again across the pool ice and caved in sand layers.
This is an indication that frost cracks opening in permafrost can run upward in the active layer (Mackay, 1984).
1.5.3 Ice-wedge activity
During the first half of the 20th century, IWs that formed in the Late Holocene in the Narsajuaq river valley were generally inactive, but not degrading; they remained dormant in permafrost. Starting around 1946, the cooling spell reactivated the majority of the IWs and led to the progressive formation of upgrowth forms. Thermal conditions leading to soil cracking became widespread in the study area in the different terrain conditions and most of the IWs had ice veins extending up to the thaw front (Kasper & Allard, 2001). It is very likely that the majority of the IWs remained active up to about 1995, but that soil cracking slowed down considerably after because temperatures were ~1.5°C warmer, averaging -7.1°C for the period 1995-2010, which is warmer than the suggested threshold for IW reactivation (between -7.8 and -8.9°C) (Kasper & Allard, 2001). The year 2010, the warmest year on record, probably resulted in a thick active layer and thus the melting of most veins and IW tops.
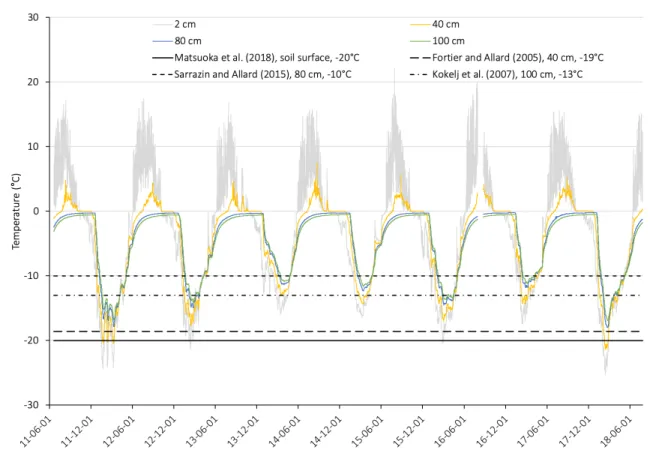
After 2010, the region experienced a climate cooling of about 6°C until 2015, which caused the thaw front to move back up. MAAT in Salluit have decreased since 2010 from -3.0°C to -9.6°C, which is cold enough to reactivate IWs (Kasper & Allard, 2001). Other thresholds in organic soils have been suggested for IW cracking based on ground temperature: -19°C at the top of permafrost (40 cm) (Fortier & Allard, 2005); -15°C and -13°C at depths of 5 cm and 100 cm, respectively (Kokelj et al., 2007); and -10°C at 80 cm (Sarrazin & Allard, 2015). For fine-grained soils, Matsuoka et al. (2018) suggested a threshold of -20°C at the soil surface combined with a gradient steeper than -10°C m-1 in the upper meter of ground. Based on the soil temperatures recorded in the borehole near Salluit, these possible thresholds have all been exceeded at least twice since 2011 (Figure 1.3). As a result, many IWs were reactivated as evidenced by the ice veins found in 50% of pits. Soil cracking became widespread in the study area most likely not earlier than 2014 since the annual ice veins noted in 2016 and 2017 were still thin, being either single or dual.
The results also show that the spatial occurrence and activity of IW was largely linked with the nature of the soil material. Ice wedges were more active on sites with a TkSPC than on sites with a TnSPC or fluvial sand (Tables 1.1 and 1.3). On those organic sites, ice veins were present in almost all pits (Table 1.3), which indicates recent soil cracking and IW reactivation. This is consistent with other observations (Kokelj et al., 2014) showing that IW cracking and growth is more common in organic soils than in mineral soils because frozen peat has a relatively high thermal conductivity and a high
coefficient of thermal contraction. This is also supported by the size of the IWs since larger IWs were found on sites with thick organic cover, suggesting that those soils have cracked more often over the lifetime of the IWs.
The recent formation of ice veins was also linked with soil material. Since sites with TnSPC and fluvial sand covers have thicker active layers, ice veins are more readily destroyed by annual thawing than on sites with TkSPC. As a result, ice veins are less likely to last through summer than on sites with TkSPC. In addition, since soil cracks close from the bottom up with ground thermal expansion (Sarrazin & Allard, 2015), they can persist longer into spring on sites with TkSPC than on sites with thin sandy peat of fluvial sand covers because of the differences in thermal conductivities. Ice veins without an IW were found in V-shaped inclusions of organic matter in sandy soil. During times of active cracking, organic matter penetrated in deeper layers when annual ice veins melted during successive summers (Kasper & Allard, 2001). The V-shaped inclusions of sandy peat have a lower unfrozen thermal conductivity than the surrounding sand and remained frozen while the thaw front progressed deeper on both sides of the troughs. This contributed to preserve the recent ice veins.
1.5.4 Change in vegetation
There has been a widespread shift in vegetation cover over the past 25 years from a moss and graminoid dominated cover to a graminoid and deciduous shrub dominated one. The shrubification of the landscape is becoming widespread in the Arctic, including Nunavik (Sturm et al., 2001; Tape et al., 2006; Myers-Smith et al., 2011; McManus et al., 2012; Loranty & Goetz, 2012; Myers-Smith et al., 2015; Ju & Masek, 2016). Under warmer temperatures, the Nunavik region has been experiencing longer growing seasons and an increase in growing degree-days for the period 1981-2010 (Charron, 2015), which largely explains the increase in shrub coverage. Another reason could be the change in polygon morphology. In the early 1990s, most polygons were low-centered with drier ridges dominated by graminoids and lichens (Figure 1.8c-d). The ridges have settled and most of the low-centered polygons are now flat or high-centered. This changed the hydrological conditions of the polygons and could partly explain the increased presence of deciduous shrubs on polygon ridges. Similarly, better soil drainage due to the deepening of the active layer could also partly be responsible for the shift in vegetation, for warmer and drier soil conditions favor the growth of herbaceous plants and shrubs over mosses (Elmendorf et al., 2012).
1.6 Conclusion
The comparison of recently measured field data with observations pre-dating a climate warming of known amplitude using in situ IW morphological characterizations and changes in surface ecological and morphological conditions allowed to determine the impacts of recent climate change in the Narsajuaq river valley. This region is very sensitive to climatic variations due to its transitional location in the low Arctic. Whereas 94% of the IWs unearthed in 1991 had recent growth structures, only 13% of the IWs unearthed in 2017 still had some lower growth stages left. Virtually all upgrowth forms that formed during the second half of the 20th century melted, and the IW tops are now consistently deeper than the main stages of the IWs measured in 1991, indicating that climate warming caused an unprecedented deepening of the active layer. Combined with the permeability of deeper sand layers, the deepening of the active layer improved surface drainage, resulting in less surface and standing water in the valley. Warming also brought about a general shift in vegetation cover, with a conspicuous expansion of shrubs. Colder years after 2010 were however sufficient to reactivate IWs as shown by the numerous ice veins found in 2017.
With climate change, it is to be expected that all IWs in the region will ultimately melt at a still uncalculated time, with major geomorphological and ecological impacts, as observed elsewhere across the Arctic. Ground temperature modelling with climate projection scenario shall provide an estimate of when this will occur in Narsajuaq. However, this detailed study of ground-ice forms at the active layer/permafrost boundary shows how the soil system and shallow ground ice respond quickly to short-term climate variations. An analysis of the ground thermal regime over the past 25 years using a heat conduction model of the transient temperature regime of the active layer and the near surface permafrost shall yield better hindsight about recent variations of active layer thickness and temperature conditions for frost cracking.
1.7 Figures
Figure 1.1. a) Location of the Narsajuaq river valley in Northern Québec, Canada, and location of the study sites. The valley is about 9 km west of Salluit. The SILA climate station and the borehole recording soil temperatures are indicated with red dots. b) Soil map of the Narsajuaq river valley. The edges of the main terraces are indicated with barbed lines (terrace bluff).
Figure 1.2. Mean annual air temperature trends for Salluit, Northern Québec, Canada. The data was obtained from a reanalysis (black line and points) based on data from Environment Canada (see Way et al., 2017) and from the Salluit automated climate station (gray line and points), which belongs to the SILA network of Centre d’études nordiques (CEN) at Laval University. The triangle shows the annual average for 1991 recorded by a climate station installed temporarily by Kasper and Allard (2001). -14 -12 -10 -8 -6 -4 -2 0 1946 1956 1966 1976 1986 1996 2006 2016 Tem peratu re (° C)
Figure 1.3. Soil temperature measured in a borehole located in a polygonal peatland near Salluit. Four estimated thresholds for ice-wedge cracking are indicated with horizontal dashed lines. Note that the threshold suggested by Matsuoka et al. (2018) also requires a thermal gradient steeper than -10°C m-1 in the upper meter of fine-grained mineral ground.
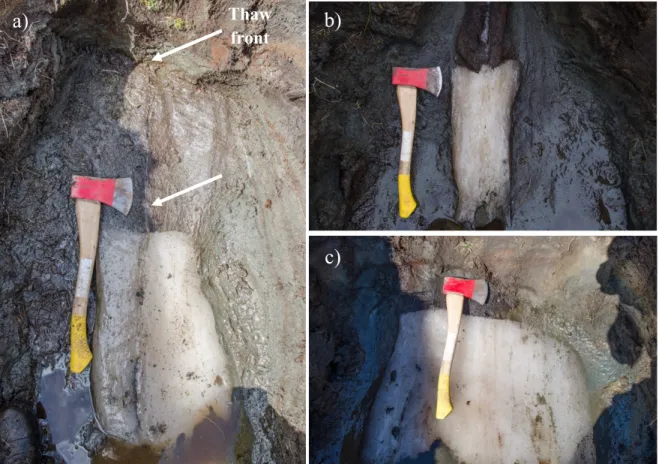
Figure 1.4. Photographs of ice wedges on D2 (a) and D9 (b, c). The arrows show ice veins connecting the ice wedges to the thaw front. Note that the photographs are not vertical cross sections; the floor of the pit is sloping.
a)
c)
b)
Thaw
front
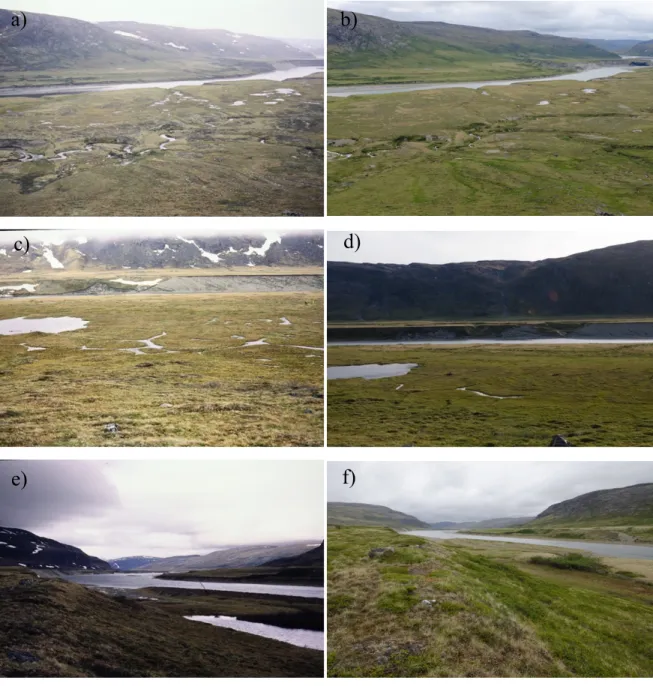
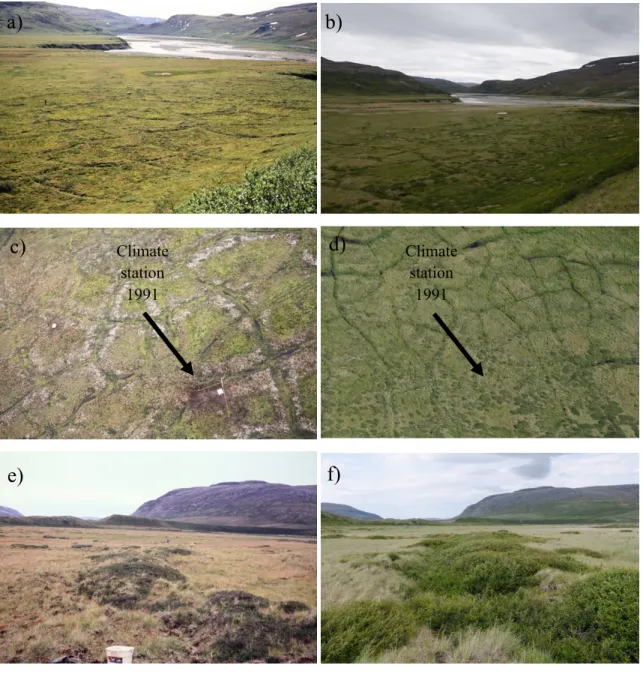
Figure 1.6. Photographs taken in 1991 (left) and in 2017 (right) of the sites G2 and G3 (a, b), D5 (c, d) and of a drained lake near G8 (e, f). Note the reduction in size and numbers of lakes, ponds and flooded polygon troughs.
a)
b)
d)
c)
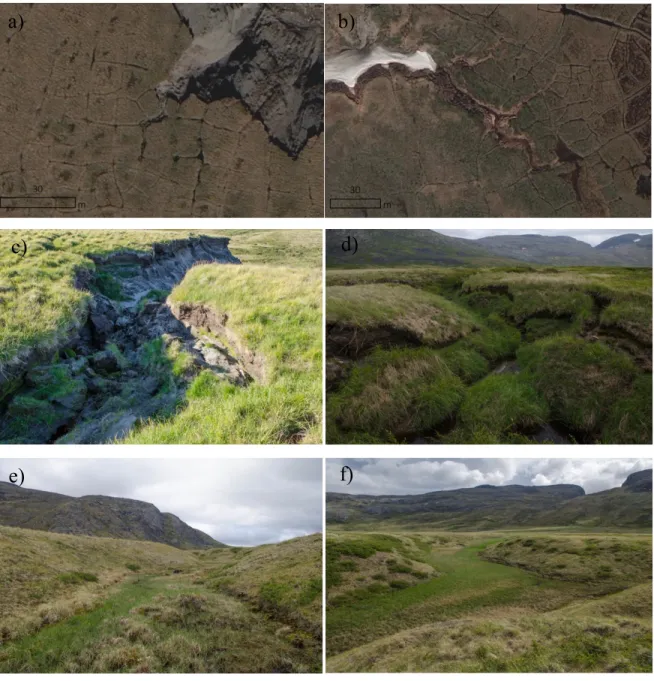
Figure 1.7. Erosion gullies initiated by ice-wedge degradation. a) and b) are satellite images of erosion gullies carving into the terraces of D4 and near D7, respectively. On c) and d) IW degradation has led to ground collapses (same gullies as a-b). This could be the beginning of a degradation sequence leading to the formation of mature ravines as seen near D10 (e, f).