«EVOLUTION OF BIODEGRADATION OF DEINKING BY-PRODUCTS USED AS ALTERNATIVE COVER MATERIAL »
By
Samah Aït-Benichou
Ph.D student, Dept. of Civil Engineering, Faculty of Engineering, University of Sherbrooke 2500, boul. De l’Université, Sherbrooke J1K 2R1 Canada
Tél: (819) 821 8000 poste 2756; Fax: 819-821-7974 [email protected]
Alexandre Rodrigues Cabral*
Professor, Dept. Civil Engineering, Faculty of Engineering, University of Sherbrooke 2500, boul. De l’Université, Sherbrooke J1K 2R1 Canada
Tél: (819) 821 7906; Fax: 819-821-7974 [email protected]
Claudia Teixeira. Panarotto
Professor, ISAM, University of Caxias do Sul C.P. 1352, Caxias do Sul, RS 95001-970 Brazil
Tél: +55 54 218-2507 [email protected]
Corresponding author:
Professor, Dept. Civil Engineering, Faculty of Engineering, University of Sherbrooke 2500, boul. De l’Université, Sherbrooke J1K 2R1 Canada
Tél: (819) 821 7906; Fax: 819-821-7974 [email protected]
Aït-Benichou, S., Cabral, A.R., Panarotto, C.T.# (2008). Evolution of Biodegradation of Deinking By-Products Used as Alternative Cover Material. Waste Management, 28 (1): 85-96.
Abstract
Deinking by-products (DBP) have been used as alternative material for the construction of cover systems for municipal waste disposal facilities and acid-producing mine residues. Considering the high organic content of this material, biodegradation occurs as meteoric water infiltrates through the cover. This ultimately may result in changes with time of the properties of DBP, thus of its behaviour as percolation control layer. This study concerns the evolution of the biodegradation of DBP in laboratory tests performed at 38°C for 1460 days. Periods of intermittent water percolation allowed for collection of leachate, whereas gas samples were collected throughout the tests. The evolution of gas and leachate production was monitored in terms of quality and quantity. The results show that biodegradation did not significantly alter the compaction behavior of DBP. There is, however, a marked increase in void ratio and water content, and a slight increase in the relative density. It is significant to note that while the void ratio of the samples increased, the volume of the samples decreased, which means that the porous structure of the non-confined samples was no longer the same after 1460 d of accelerated biodegradation. The results of permeability tests performed at various confining stresses show that the hydraulic conductivity of compacted biodegraded DBP decreases from 7 to approximately 2 x 10⁻⁷ cm/s in 1460 days.
Keywords: Mass Loss; Gas Production; Leachate Production; Hydraulic Conductivity; Landfills
INTRODUCTION
In 2001, the production of deinking by-products (DBP) reached 510 000 humid tons a year in Quebec. Great quantities of these by-products have been buried as wastes, even though they can be recycled as geotechnical material for the construction of municipal landfill facilities (MLF) and mine residues (such as tailings) covers. Indeed, several studies have been performed on the physico-chemical and geotechnical properties of DBP (Cabral et al. 1999; Burnotte et al. 2000; Cabral et al. 2002).
Certain types of mine tailings oxidize in the presence of oxygen and water, which results in the generation of acid mine drainage (AMD) that may contaminate aquatic ecosystems with heavy metals and high quantities of suspended solids (Gray 1997). Some studies aimed at reducing AMD have shown that DBPs are very effective in preventing the diffusion of oxygen to mine residues (Cabral et al. 2000; Cabral et al. 2004). In fact, these materials are able to maintain a high degree of saturation, especially when they are part of a cover with capillary barrier effect (CCBE), which causes a drastic decrease in the oxygen diffusion coefficient. Oxygen consumption caused by the biodegradation of DBP is an additional element for blocking the generation of AMD (Panarotto et al. 2005).
In the case of sanitary landfill sites, the aim is to try to control infiltrations through the cover. Some field (Brown et al. 1998; Kamon et al. 2001; Audet et al. 2002; Cabral et al. 2002) and laboratory (Moo-Young and Zimmie 1996; Robart 1998; Bédard 2005) studies show that DBPs
have low hydraulic conductivity and therefore, may limit water percolation from precipitation and snow-melt runoff, through the cover.
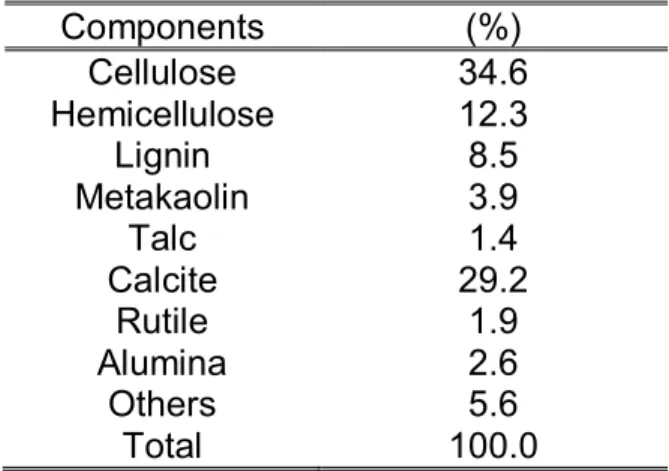
However, close to 50% of the solid phase of DBPs consists of biodegradable organic matter, that can, therefore, alter certain geotechnical and hydraulic parameters of the cover material, such as the void ratio, the relative density of solid grains, the hydraulic conductivity, etc. (Bédard 2005; Panarotto et al. 2005). DBPs largely consist of fibers, minerals and water. Analyses from several plants show that this material consists of 55 to 68% organic matter, 17 to 22% calcite, 9 to 10% kaolinite, and 6 to 13% silica, talc and others (Cabral et al. 1998) .
This study concerns the evolution of the biodegradation of DBP in laboratory tests performed at 38°C for 1460 days. The influence of temperature changes at the end of the tests is also investigated. The results of the first 400 days of testing were reported by Teixeira (2001) and Panarotto et al. (2005).
MATERIALS AND METHODS
General conditions
The experimental laboratory program included a series of 15 samples that were monitored during 400 days (Panarotto et al. 2005). Four of these samples continued to be monitored for an additional 1060 days. In addition to being used to study the evolution of DBP biodegradation with time, two of these four samples served to evaluate the effect of temperature change on DBP
The four cells were incubated at approximately 38°C. This temperature is considered optimal for the activity of anaerobic (methanogenic) micro-organisms (Zeikus and Winfrey 1976; Hartz et al. 1982). After the 1360th day, two of the cells were transferred into an environmentally controlled chamber, where the temperature was approximately 14°C, which is the average temperature in the middle and at the base of an existing DBP layer (Cabral et al. 1999). The two cells remained in this chamber for 100 days.
The DBPs
The DBPs used in the tests consist of 60.3% volatile matter and 39.7 % non-volatile matter. The principal components and their importance are presented in Table 1.
Biodegradation Cell
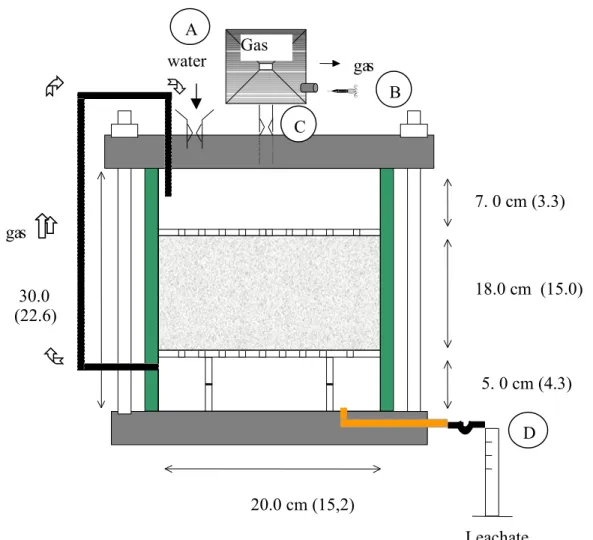
The DBP samples were compacted into PVC cells that were part of a closed system, as illustrated in Figure 1. The quick release in point A allows for water intake, whereas water is collected at point D. Point C is connected to a laminated polyethylene bag that collects the gases formed as a result of DBP biodegradation. The gases are sampled at point B using a graduated needle. It should be emphasized that the samples were not submitted to any load during the accelerated biodegradation tests.
Sample preparation and testing
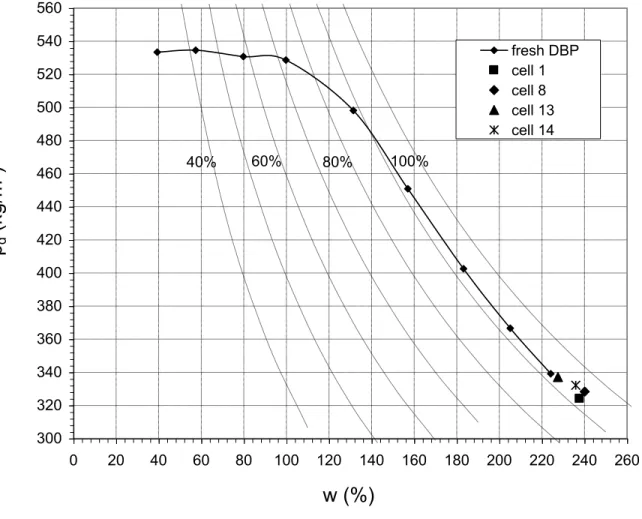
Samples were compacted in a manner that reproduced field conditions as closely as possible in terms of density and water content (Figure 2). The sequence and energy prescribed in the ASTM
D698 procedure (ASTM 2000) was employed. After compaction in 3 layers (6 cm each), the cells were hermetically sealed, with a layer of silicon applied to the cover. The initial degree of saturation of the samples averaged 89.9% ( 0.6%), their dry density 411.8 kg/m3 ( 5.8 kg/m3), their water content 172.3% ( 3.1%) and their void ratio 3.7% ( 0.1%).
Deaerated, deionized, distilled water was employed in all tests. Periods of intermittent water percolation (herein denominated leaching periods, or LP) were followed by leachate collection and consequent analysis of its characteristics. During leaching periods, approximately one equivalent volume of voids (EVV) was percolated through the sample under a hydraulic gradient of approximately 1.4. One EVV is equivalent to the porosity volume of the sample, which, in the present case, is equal to approximately 4 liters. In order to preclude the system from being under suction, water was recuperated before emptying the gas bags.
Leachate collection and analyses
For each leaching period, the following analyses were performed, as described in the APHA Standard Method (1995) (APHA or other methods are indicated in parenthesis): pH (4500-H+ B - electrometric method), total solids content (TS) (2540-B), total volatile solids (TVS) (2540-E), and chemical oxygen demand (COD) (5220-D).
There were eight leaching periods (LP), four of which (1st to 4th LP) were conducted during the first 400 days. The results are discussed by Panarotto et al. (2005). Within 960 days, four other LP were conducted (5th to 8th LP) using the 4 remaining samples incubated at 38°C. After having
transferred two of the samples to a cooler environment (14°C), a last and 9th LP was conducted on these two samples.
Gas collection and analysis
As shown in Figure 1, bags of laminated polyethylene were attached to the cells for storage and removal of the biogas generated. To collect gas samples, 60 ml syringes were used. The volumes of O2, CO2 and CH4, and their respective compositions were determined. The concentrations of the three gases were measured with a LFG-20 apparatus (Triple Landfill Gas Analyser) from ADC-Analytical Company Ltd. The precision of the apparatus is ± 0.4% for oxygen and 3% for CO2 and CH4 (for concentrations under 10%, the precision is ± 0.5%). Before injection of the collected gas sample, the LFG-20 was purged with a gas composed of 50% methane and 50% carbon dioxide to calibrate the machine. Gas measurements were done in duplicate. Once the composition of the gases had been analyzed, the bags were emptied using a 500 ml syringe. The volumes were then corrected to the standard temperature and pressure.
Cell opening and sample exhumation
After the 8th leaching period (1448 d), two of the 4 cells placed at 38°C were disassembled, sub-samples were then taken from each of the three layers in which the sub-samples had initially been compacted, and a series of tests were performed in order to determine the direct mass loss, the organic matter content, and several geotechnical parameters described later. Details of cell opening and the exhumation procedure are provided by Panarotto et al. (2005), who also describe the array of tests done for the cells exhumed during the initial 400 days of testing. The two
remaining cells were placed at 14°C on the 1360th day. After the 9th leaching period the two cells were disassembled (1460th day).
Geotechnical characterization
For fresh samples and each sub-sample exhumed from the biodegradation cells, the water content (w%), void ratio (e), degree of saturation (Sr) and relative density (Dr; this parameter is also known as specific gravity, Gs) were determined. The density-water content relationship (Proctor curve; Figure 2) was also determined according to the ASTM D698 (ASTM 2000) procedure. The water content was determined by drying at 110 5°C, in accordance with the CAN/BNQ 2501-070-M-86 (Bureau de Normalisation du Québec 1986) procedure; the volatile matter content was determined according to the ASTM D2974-C (ASTM 1987) standard; and the relative density was obtained according to the procedure CAN/BNQ 2501-070-M-86 (Bureau de Normalisation du Québec 1986). In addition, consolidation and permeability tests were conducted on the samples compacted at the same water content determined at the end of the incubation period. The purpose of these tests was to determine the effect of accelerated biodegradation on hydraulic conductivity and on the geotechnical behavior of DBP. The results of consolidation tests are not presented in this paper.
Mass loss evaluation
Mass loss as a result of biodegradation was calculated directly or indirectly. Direct mass loss was evaluated by the difference between the initial and final weight. Indirect mass loss was calculated from the solid masses (organic or inorganic) present in the leachate collected and CO2 and CH4 masses collected in the laminated polyethylene bags (point C in Figure 1). These
masses were calculated from the volumetric concentrations of the two gases, according to the perfect gas law ( pV nRT ), using their respective molecular weights (44 g/mol for CO2 and 20 g/mol for CH4). The volumes of the two gases were converted to mass and were expressed as mass loss with time.
RESULTS AND DISCUSSION
Evolution of biogas production
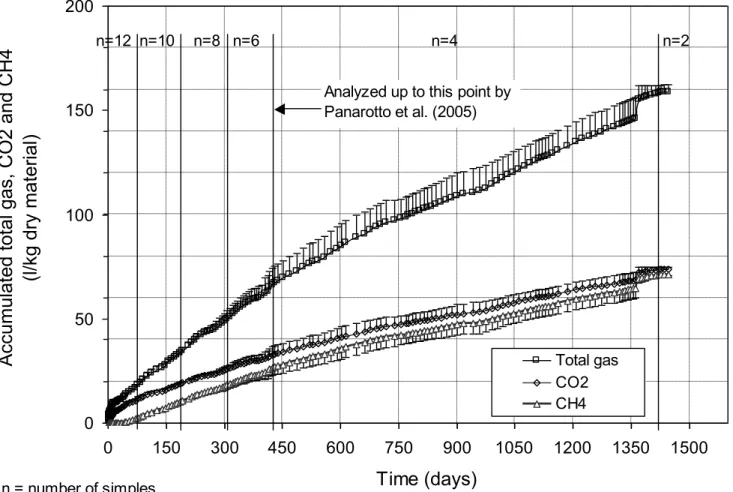
Figure 3 presents the evolution of biogas production on the basis of DBP samples placed at 38°C and not submitted to load application and continuous flow. This production attains a total of 158.9 3.2 l/kg dry material. An increase in the production of CO2 and CH4 is observed, reaching 73.8 1.0 and 71.3 0.5 l/kg respectively, or approximately 91% of the total production. The remaining 9% probably consists of ammonia, hydrogen, sulphites, mercapatans (thiols), etc. (Tchobanoglous et al. 1993; Teixeira 2001). As shown in Figure 3, biogas production is still not stable after 1460 days of accelerated biodegradation testing.
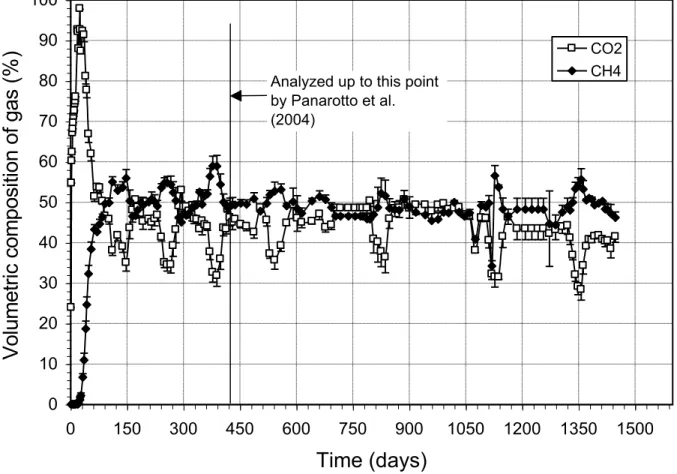
Figure 4 presents the evolution of biogas composition produced by DBPs placed at 38°C. Gas composition stabilizes from the 150th day with more or less equal distribution between CO2 and CH4. CO2 and CH4 percentage fluctuations coincide with the leaching periods. During these periods, the volume of CH4 exceeds that of CO2 due to the fact that the CO2 dissolves in water during leaching (Teixeira 2001), while CH4 is less soluble (Tchobanoglous et al. 1993). Panarotto et al. (2005) discussed the evolution of gas production due to DBP biodegradation, during the first 400 days. In the first days of the test, organic matter biodegrades, especially cellulose and hydrolyzed hemicellulose, in the presence of oxygen (O2), the latter being quickly consumed by aerobic microorganisms. The depletion of O2 sets off fermentative reactions resulting in intense CO2 production. In fact, CO2 concentration reaches approximately 90 % by the 20th day. CH
90th day, when it exceeds that of CO
2, which is characteristic of the methanogenesis phase of biodegradation. Figure 4 shows that the percentage of CH4 remains relatively stable, which is characteristic of the advanced methanogenesis phase.
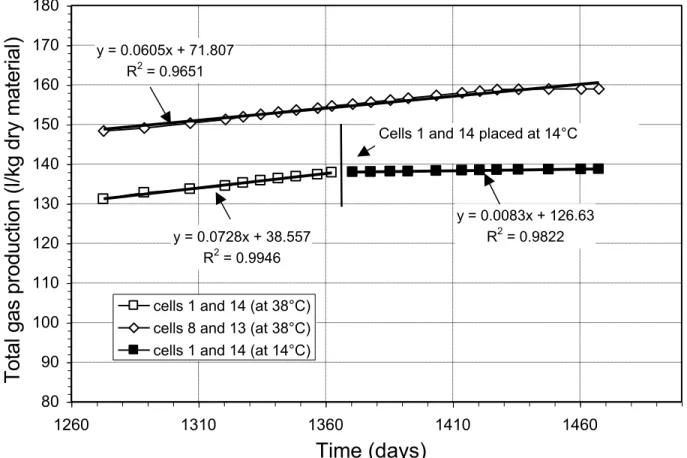
The anaerobic biodegradation of organic matter is affected by temperature change (Christensen and Kjeldsen 1989; Barlaz 1997; Teixeira 2001). Between the 400th and 1360th days of the test, the four remaining biodegradation cells were placed at 38°C, after which two of the cells (1 and 14) were placed in the temperature controlled chamber, at 14°C, for the last 100 days of the test. This change was made to evaluate the effect of low temperature on the activity of microorganisms responsible for DBP biodegradation. As shown in Figure 5, the rates of gas production are 0.0728 l/kg-d for samples 1 and 14, and 0.0605 l/kg-d for samples 8 and 13. All rates refer to dry mass. Each graphic point of Figure 5 represents the average reading of the two cells. Once cells 1 and 14 were placed at 14°C, the gas production rate decreased to 0.0083 l/kg-d, which equals approximately 10% of the rate at 38°C (Figure 5). This rate remained stable during the 100 days of incubation at 14°C. Tests conducted on DBP samples incubated at different temperatures (38, 21 and 12°C) (Figure 5 in Panarotto et al. 2005), resulted in an approximate gas production of 0.15 l/kg-d at 38°C and 0.1 l/kg-d at 21°C. At 12°C, production drops to less than 0.013 l/kg-d. The gas production rate at 12°C represents, therefore, barely 4% of that of samples incubated at 38°C. The results in Figure 3 show that gas production rates slowly decrease with time.
Physico-chemical evolution of DBP leachate
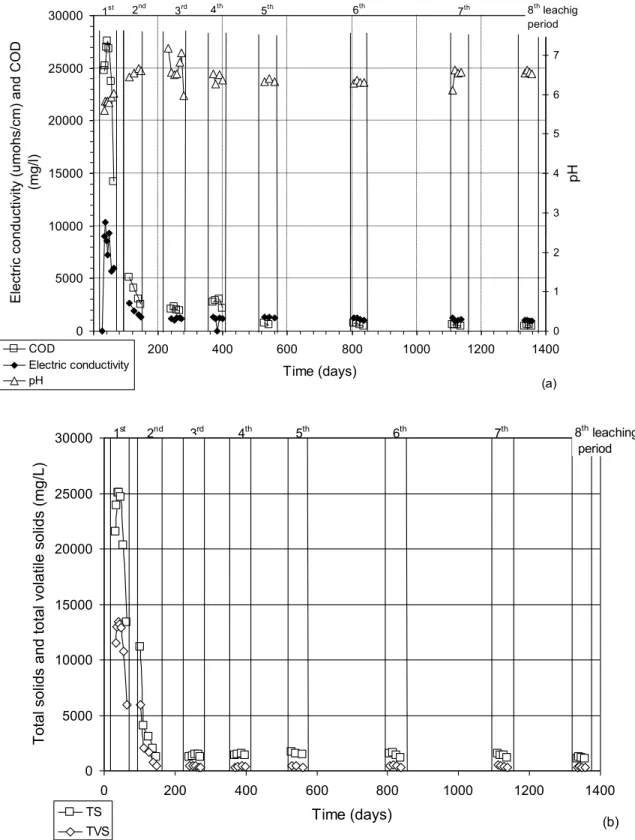
The results of the physico-chemical analyses conducted on leachate samples recuperated during each leaching period (8 LP) are presented in Figure 6. As observed in Figure 6a, from the 4th EVV, leachate pH stabilizes around 6.5. Figure 6a also shows the evolution of the chemical oxygen demand (COD) and electric conductivity of DBP leachate. The results show that the COD rapidly drops approximately 30 000 mg/l to 5 000 mg/l, continues to drop less abruptly, and finally stabilizes at 560 mg/l at the 3rd LP. The electric conductivity of the leachate quickly decreases from 10 000 mohs/cm to 2 000 mohs/cm and stabilizes at 1 300 mohs/cm at the third LP. The concentrations of total solids (TS) and total volatile solids (TVS) are represented in Figure 6b. The concentration of TS also quickly drops from 25 000 mg/l to 10 000 mg/l and, as all the other parameters, stabilizes at the third LP at 1 200 mg/l. The concentration of the TVS, which at the beginning is 15 000 mg/l, drops to 5 000 mg/l and also stabilizes at 450 mg/l at the third LP.
In summary, an important drop in the values of the main physico-chemical parameters (except pH) is observed in the initial stages of the tests. The COD and VOC also decreased between the 1st and 2nd leaching periods (Panarotto et al. 2005). This decrease is explained by the use of dissolved carbon sources in the leachate by micro-organisms, resulting in gas production. Once CH4 started to be produced, the total gas production rate remained constant (Figure 3), although the proportion of CH4 in the gas quickly increased (Figure 4). That takes place due to the activity of microorganisms that transform organic acids into biogas (Tchobanoglous et al. 1993). Hydrolysis and fermentation continue, but the methanogenic activity increases until the point
where the consumption rate of the final products approaches the hydrolysis rate (McBean et al. 1995).
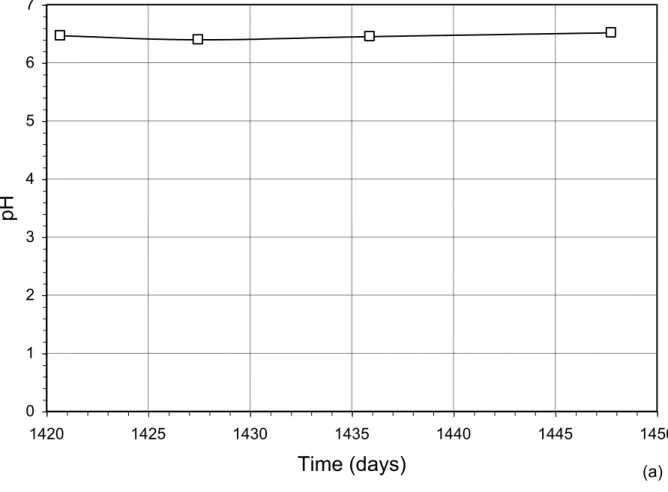
Figure 7 presents the evolution of pH, electric conductivity, COD, TS and TVS during leaching of the last (9th) LP, conducted on the two biodegradation cells placed at 14°C. Figure 7a, shows that the pH remains stable at an approximate value of 6.5, while the electric conductivity drops from 1 200 mohs/cm to approximately 800 mohs/cm in 5 days, then remains constant (Figure 7b). COD also decreases (Figure 7c), followed by a stabilization of around 350 mg/L. The TVS also drops from 240 to 200 mg/L, whereas the TS drops from 1020 mg/L to 820 mg/L (Figure 7d). This slight drop may be attributed to slower microbial activity that followed the change to a lower room temperature. This, in turn, leads to a slower solubilization rate, which clearly affected gas production (Figure 5).
DBP mass loss
Figure 8a presents the evolution of mass loss from the DBP samples, indirectly calculated from the production of CO2 and CH4. The mass loss is shown to linearly evolve with time. After 1460 days of incubation at 38°C, mass loss in the form of CO2 is approximately 14.5% of the initial mass, while approximately 5.1% of the mass is lost by CH4 production. Mass loss by CO2 is higher than that by CH4. The high CO2 production appears at the beginning of the tests. It coincides with phase II (fermentative and et acidogenic) of DBP biodegradation that takes place between the 6th and 37th d (Panarotto et al. 2005). After this phase, the methanogenic phase begins where CH4 production increases. After 1460 d, a total of 19.6% of the initial mass is lost as gas.
Figure 8b shows the evolution of DBP mass loss by leaching. The control parameter is the percentage of total solids leached (organic and inorganic). A significant and abrupt loss is observed during the first leaching period. Afterwards, the mass loss increases almost monotonically to reach 6.1% of the initial mass, at the end (1460th d) of the incubation test at 38°C. This loss was only 0.7% between the 400th and 1460th d. Figure 8b shows that mass loss is more significant during the first leaching periods, due to the strong concentration of organic acids in the leachate (Figure 6). The total mass loss calculated indirectly, i.e. by summing up the losses by gas production and leaching, amounts to 25.7% (19.6% by gas and 6.1% by leaching), following an incubation period of 1460 d at 38°C.
Mass loss by leaching in actual field conditions is much slower due to the slow infiltration, i.e. rate of pore water replacement. This slow rate is mainly due to the low hydraulic gradients that prevail in the field (approximately equal to unity when sufficient precipitation causes the DBP layer to be saturated, which only happens part of the time). In the absence of a hydraulic gradient causing significant downward flow, mass is lost by gas production. Gas flow through the material may be difficult depending on the level of saturation: the higher the degree of saturation, the slower gas migrates, which may eventually slow down the biodegradation process due to excessive accumulation of organic acids, which eventually inhibits the activity of methanogenic micro-organisms. The thickness of the DBP layer also plays a role: the thicker it is, the slower the change in pore water, thus the slower the rate of mass loss. According to results recently presented by Bédard (2005), who monitored two large DBP samples submitted to a constant hydraulic gradient over 1700 d in the laboratory, mass loss by leaching is directly related to the
flow rate through two large DBP samples. Flow rates may be altered by gas production, which causes an increase in the pore pressure distribution inside the sample. The dynamics of mass loss from DBP have yet to be fully understood.
Table 2 summarizes the mass losses calculated directly by the difference in sample weight between the beginning and the end of the test. The average mass loss is 30.8%, which is higher than that calculated indirectly (25.7%). This difference is probably due to possible gas leaks and imprecision during physico-chemical analyses of the leachate. Teixeira (2001) calculated a direct mass loss of approximately 16% after 400 d of incubation at 38°C, compared to 13% loss calculated indirectly. After the 400th d, biodegradation of the organic matter and leaching of solids (organic and inorganic) caused an additional mass loss of approximately 14.8%.
Impact of biodegradation on the geotechnical behavior of DBP
Figure 2 presents the results of the Proctor tests conducted on the DBP samples recuperated during disassembling of the biodegradation cells. As can be observed, biodegradation does not seem to significantly influence the compaction behavior of DBP, since the results align with the Proctor curve obtained with fresh samples. The degree of saturation of the samples is approximately 91%, for a dry relative density of between 320 and 340 kg/m3. At such high degrees of saturation, samples could not (and would not) be compacted any further.
Table 3 summarizes the values of several geotechnical parameters for the samples incubated for 1460 days. The results in the first two lines in Table 3 were obtained by Panarotto et al. (2005); they show that, for the first 400 d of testing, there was a slight increase in volume of the samples,
accompanied by significant increases in void ratio and water content. The degrees of saturation and relative density did not change significantly, showing that the structure of the samples does not seem to be altered after 400 d of incubation. The increase in volume is probably due to swelling of organic fibers (cellulose and hemicellulose).
However, continued biodegradation for another 1000 days, led to a 6.4 to 9.9% decrease in volume, accompanied not by a decrease, but by a 40 to 60% increase in void ratio. The values in Table 3 show that the proportionality between variations in volume and void ratio (valid for mineral soils), V/V = e/(1+e0), is far from being respected. This seems to indicate that the
porous structure of the non-confined samples was no longer the same. This is related to the greater loss of organic matter (nearly 20% after 1460 d, and increasing), as compared to the loss of inorganic matter due to leaching (6.1%, and stable after 1460 d).
Biodegradation of organic matter generates water, which explains the increase in gravimetric water content. Since there is greater loss of organic matter than loss of mineral matter (with the latter being heavier than the former), biodegradation also explains the small, though measurable, increase (3 to 7%) in the relative density (Dr) of the samples. With the exception of the sample from cell 1, for which the Sr apparently did not change, the final degrees of saturation after 1460 d are 3 to 10% lower than the initial values. Most important of all, the phase relationship, eSr =wDr, is respected for all samples, with an error of less than 0.7% (0.1% in average).
Figure 9 presents the evolution of the relationship between the saturated hydraulic conductivity and void ratio. The values of ksat were obtained at each of the following stages of confining
stresses in the oedometer (1-D consolidation) cell: 12, 24, 48 and 96 kPa. Up to approximately 50 d of incubation, the ksat of fresh DBP samples (7 x 10⁻⁷ cm/s) does not seem to be affected by
biodegradation (Figure 9a). As time progresses, however, the hydraulic conductivity starts to drop, for an equivalent level of confining stress (Figure 9b-d). The ksat values obtained after 400
d (Figure 9d) are surprisingly high; however, other tests performed using samples taken from cells incubated at 21°C for 400 d resulted in an average ksat of 2 x 10⁻⁷ cm/s. In addition, the several tests performed with samples incubated for 1460 d (also shown in Figure 9d) confirm the trend of a diminishing hydraulic conductivity with time (again, for a comparable level of confining stress).
Figure 10 presents the evolution of ksat associated with a void ratio equal to 3.2 (typical of field
conditions). The results indicate that the ksat of biodegraded DBP samples initially does not change (up to 50 d), drops, and then tends to stabilize at a value of approximately 1.5 x 10⁻⁷ cm/s. The latter value is corroborated by the results presented by Bédard (2005), who observed that the ksat of large DBP samples submitted to leaching for 1700 days leveled off at approximately 2 x 10⁻⁷ cm/s.
It can be argued that the hydraulic conductivity did not start to drop after 50 d, but after approximately 100 d. It is approximately at that time that the significant drop in TS and TVS started to level off (Figure 6b). It is also around that time that CH4 production started (Figure 3) – note that when that occurred, the rate of total gas production diminished (Figure 3).
Considering the low temperatures that prevail part of the year in the northern parts of North America, the fact that covers are submitted to infiltration only part of the year, and that under field conditions DBP layers are usually submitted to a confining stress of approximately 12 kPa (equivalent to 0.6 m of a protective layer composed of coarse textured soils), mass loss by leaching would occur at a rate in the vicinity of 0.6%/yr, whereas the rate of mass loss by gas production would vary between 4.2%/yr (during the short warm months, when the temperature within the DBP raises to 25°C ) to 0.8% ((Panarotto et al. 2005) and Figure 5), during most of the year.
CONCLUSIONS
The organic nature of the DBP means that this material has an important biodegradation potential, which can have an impact on the long term hydraulic and geotechnical performance of landfill or tailings covers constructed with it. An experimental program aimed at evaluating – at least in part - this impact was performed by means of laboratory tests, whereby DBP samples were submitted to accelerated biodegradation for 1460 at 38°C.
The results of the laboratory analyses presented show that the production of CO2 and CH4 at a temperature of 38°C steadily increases and did not level off after 1460 days of testing. As a consequence, nearly 20% of the mass is lost due to CO2 and CH4 production (respectively 14.5% and 5.1 %), while water percolation through the samples lead to an additional 6.1% mass loss, for a total mass loss of 26%. Mass loss by leaching was higher in the early days of the experiments. Within 200 days, the total solids concentration had dropped significantly from
period. With the exception of the pH, which remained stable at 6.5, all physico-chemical parameters that were monitored (COD, electrical conductivity, TS and TVS) dropped significantly in the early stages and leveled off at much lower values than in the beginning. Near the end, some of the samples were placed at a much lower temperature (14°C). A slight drop was observed in TS and TVS. This can be attributed to a slower microbial activity which, in turn, leads to a slower solubilization rate. The latter also affected gas production.
Subsequent to cell opening (exhumation), sub-samples were taken in order to obtain some basic geotechnical parameters and to perform consolidation and hydraulic conductivity tests. The results show that biodegradation did not significantly alter the compaction behavior of DBP. There is a marked increase in void ratio and water content, and a slight increase in the relative density (mainly due to greater loss of organic matter, as compared to inorganic matter, which is heavier). The degree of saturation slightly decreased. It is significant to note that while the void ratio of the samples increased, the volume of the samples decreased, which means that the porous structure of the non-confined samples was no longer the same after 1460 d of accelerated biodegradation.
Hydraulic conductivity tests were performed in the consolidation (oedometer) cell at various confining stresses. The results show that the hydraulic conductivity of compacted biodegraded DBP decreases from 7 to 2 x 10⁻⁷ cm/s in 400 d. Despite the steady gas production and leaching of the samples, ksat did not continue to drop significantly leveling off at 1.5 x 10⁻⁷ cm/s at 1460 d.
ACKNOWLEDGEMENTS
Funding for this study was provided in part by Industries Cascades Inc., Perkins Papers Ltd. and NSERC (Canada) under the University-Industry partnership grant number CRD 192179. The NSERC (Canada) Discovery Grant of A. R. Cabral funded the remainder of the project. The participation of Ms Panarotto was possible due to a grant from the CNPq (Brazil). The help of our chief laboratory technician, Jean-Guy Lemelin and of Martha Montenegro, who so kindly devoted time to help us throughout her post-doctoral internship at Université de Sherbrooke, is also appreciated.
REFERENCES
Aït-Benichou, S. (2004). Évolution de la dégradation des sous-produits de désencrage comme matériaux géotechnique pour le recouvrement de parcs à résidus miniers et de sites d'enfouissement sanitaire. Civil Engineering. Sherbrooke, Université de Sherbrooke: 87. American Public Health Association, American Water Works Association and Water
Environment Federation, Eds. (1995). Standard Methods for the Examination of Water and Waste-water 19th ed., American Public Health Association.
ASTM (1987). D 2974: Standard Test Methods for Moisture, Ash, and Organic Matter of Peat and other Organic Soils. Philadelphia, American Society for Testing and Materials: 4. ASTM (2000). D 698: Standard Test Methods for Laboratory Compaction Characteristics of Soil
Using Standard Effort. Philadelphia, American Society for Testing and Materials: 11. Audet, C., G. Lefebvre, A. R. Cabral and F. Burnotte (2002). State of development in the
valorization of deinking by-products as an alternative to fine grained soils. TAPPI 2002, Montreal, TAPPI.
Barlaz, M. A. (1997). Mibrobial studies of landfills and anaerobic refuse decomposition. Manual of Environmental Microbiology. e. a. Christon J. Hurst. New York, American Society for Microbiology: 541-557.
Bédard, D. (2005). Effet du fluage à long terme des sous-produits de désencrage dû à la perte de masse et son effet sur la compression et la conductivité hydraulique. Civil Eng.
Sherbrooke, Université de Sherbrooke.
Brown, R. A., A. B. Fourie and R. Snyman (1998). Pulp sludge: waste or valuable capping material? Fourteenth Congress of the Institute of Waste Management, Kempton Park, South Africa.
Bureau de Normalisation du Québec (1986). Sols - Détermination de la densité relative. Ottawa, Conseil canadien des normes: 7.
Bureau de Normalisation du Québec (1986). Sols - Détermination de la relation teneur en eau-masse volumique. Ottawa, Conseil canadien des normes: 12.
Burnotte, F., G. Lefebvre, A. Cabral, C. Audet and A. Veilleux (2000). Use of deinking residues for the final cover of a MSW landfill. 53rd Canadian Geotechnical Conference, Montreal. Cabral, A., I. Racine, F. Burnotte and G. Lefebvre (2000). "Diffusion of oxygen through a pulp
and paper residue barrier." Canadian Geotechnical Journal 37(1): 201-217.
Cabral, A. R., F. Burnotte, G. Lefebvre, G. Amyot and G. Lacasse (1999). Design construction and monitoring of a waste rock cover using pulp and paper residues. Tailings and Mine Waste '99, Fort Collins, Balkema.
Cabral, A. R., F. Burnotte, G. Lefebvre and C. T. Panarotto (2002). Geotechnical
characterization of a pulp and paper (deinking) residue used in cover systems. 4th International Conference on Environmental Geotechnics, Rio de Janeiro, Brazil, Balkema.
Cabral, A. R., G. Lefebvre, F. Burnotte, M.-F. Proulx, I. Racine and C. Audet (1998).
Developments in the use of deinking residues in cover systems for acid generating mine tailings. Tailing and Mine Waste '98, Fort Collins, CO, Balkema.
Cabral, A. R., P. Tremblay and G. Lefebvre (2004). "Determination of the diffusion coefficient of oxygen for a cover system composed of pulp and paper residues." Geotech. Testing
Christensen, T. H. and P. Kjeldsen (1989). Basic biochemical processes in landfill. Sanitary Landfill: Process, Technology and Environmental Impact. T. H. Christensen, R. Cossu and R. Stegmann. London, Academic Press Limited: 29-49.
Gray, N. F. (1997). "Environmental impact and remediation of acid mine drainage: a management problem." Environmental Geology 30: 62-71.
Hartz, K. E., R. E. Klink and R. K. Ham (1982). "Temperature effects: methane generation from landfill samples." Journal of Environmental Engineering 108(4): 629-638.
Kamon, M., S. Inazumi, T. Takashi and T. Inui (2001). Waste sludge applicability and waste balance analysis of landfill cover system. Proceedings of the First Korea-Japan Joint Seminar on Geoenvironmental Engineering, Seoul, Korea.
McBean, E. A., F. A. Rovers and G. J. Farquhar, Eds. (1995). Solid Waste Landfill Engineering and Design. Solid & Hazardous Waste. Englewood Cliffs, Prentice Hall.
Moo-Young, H. K. and T. F. Zimmie (1996). "Geotechnical properties of paper mill sludges for use in landfill covers." Journal of Geotechnical Engineering 122(9): 768-775.
Panarotto, C. T., A. R. Cabral and G. Lefebvre (2005). "Biochemical Evolution of a Cellulose-rich By-product Used as Alternative Cover Material. Part I: Laboratory Study." J. Env. Engin. and Science 4: 123-138.
Robart, G. (1998). Étude de la perméabilité de la compressibilité des résidus de désencrage. Département de génie civil. Sherbrooke, Université de Sherbrooke: 140.
Tchobanoglous, G., H. Theisen and S. Vigil (1993). Integrated Solid Waste Management - Engineering Principles and Management Issues. NY, USA, McGraw-Hill.
Teixeira, C. E. (2001). Evolution biochimique des résidus de désencrage dans un contexte de valorisation comme barrière de recouvrement. Dep. Civil Eng. Canada, Université de Sherbrooke: 209.
Zeikus, J. G. and M. Winfrey (1976). "Temperature limitation of methanigenesis in aquatic sediments." Applied and Environmental Microbiology 31(1): 99-107.
List of Tables and Figures
Table 1 - Characteristics of the DBP used in the present study
Table 2 - Mass loss measured directly for DBP samples left at 38°C for 1460 d
Table 3 - Geotechnical parameters of DBP samples after 400 d (cells 6 and 9) and 1460 d (other samples) of incubation
Figure 1: Diagram of Accelerated Bioegradation Cell Used During Laboratory Studies (Teixeira 2001)
Figure 2 - Proctor Test Conducted on DBP Samples after 1460 d
Figure 3 - Evolution of Total Volumes of CO2 and CH4 over Time, at 38°C
Figure 4 - Volumetric Composition of Biogas Resulting From the Biodegradation of DBP Figure 5 - Evolution of Biogas Production over Time at Different Temperatures
Figure 6 - Evolution of Selected Physico-chemical parameters of the DBP Leachate at 38°C: a) pH, Electric Conductivity and COD. b) Total Solids and Total Volatile Solids
Figure 7 - Evolution of a) pH b) Electric Conductivity, c) COD and d) TS and TVS during the 9th EVV Conducted on DBP at 14°C
Figure 8: Evolution of Indirect Mass Loss of DBP: a) Loss by Gas Production (CO2 and CH4); b) Loss by Leaching of Total Solids
Figure 9 - Variation of the hydraulic conductivity with void ratio and incubation periods: a) fresh and 50 d of incubation; b) 150 d; c) 270 d and d) 400 d (cells 6 and 9) and 1460 d (cells 1, 8, 13 and 14)
Figure 10 - Evolution of the saturated hydraulic conductivity associated with a void ratio equal to 3.2
Table 1 - Characteristics of the DBP used in the present study Components (%) Cellulose 34.6 Hemicellulose 12.3 Lignin 8.5 Metakaolin 3.9 Talc 1.4 Calcite 29.2 Rutile 1.9 Alumina 2.6 Others 5.6 Total 100.0
Table 2 - Mass loss measured directly for DBP samples left at 38°C for 1460 d
Cell Number Cell 1 Cell 8 Cell 13 Cell 14 Initial dry mass (g) 2315.2 2338.8 2263.7 2319.1 Final dry mass (g) 1679.33 1561.39 1608.82 1545.9 Mass loss (g) 635.87 777.41 654.88 773.2
Average 710.3 g
Table 3 - Geotechnical parameters of DBP samples after 400 d (cells 6 and 9) and 1460 d (other samples) of incubation Cell Nb (elapsed time, d) Vi [Vf] (cm3) Mi [Mf] (g) V/V (%) e0 [ef] 1 e0 e (%) wi [wf] (%) Sri [Srf] (%) Dri [Drf] 6 (400) [5.692] 5.663 [1969.4] 2276.5 0.51 [4.69] 3.85 17.4 [211.8] 178.6 [89.0] 90.4 [1.97] 1.95 9 (400) [5.610] 5.600 [1970.5] 2338.7 0.18 [4.69] 3.67 21.9 [224.5] 169.4 [90.0] 89.9 [2.0] 1.95 1 (1460) [5207.3] 5569.1 [1679.3] 2315.3 -6.5 [5.17] 3.69 31.6 [237.4] 172.6 [91.4] 91.2 [1.99] 1.95 8 (1460) [5065.7] 5600.56 [1561.4] 2338.7 -9.6 [5.78] 3.67 45.2 [241.4] 169.8 [87.3] 90.2 [2.09] 1.95 13 (1460) [5090.8] 5647.75 [1603.8] 2263.7 -9.9 [5.55] 3.86 34.8 [231.3] 178.3 [86.3] 89.9 [2.07] 1.95 14 (1460) [5021.6] 5363.53 [1545.9] 2319.2 -6.4 [5.59] 3.51 46.1 [238.1] 172.12 [86.4] 95.6 [2.03] 1.95
Figure 1: Diagram of Accelerated Bioegradation Cell Used During Laboratory Studies (Teixeira 2001) (22.6) cm) 20.0 cm (15,2) cm) 7. 0 cm (3.3) cm) 5. 0 cm (4.3) cm) 18.0 cm (15.0) cm) ga s water Leachate
B A C D ga s
Gas bag 30.0 cmFigure 2 - Proctor Test Conducted on DBP Samples after 1460 d 300 320 340 360 380 400 420 440 460 480 500 520 540 560 0 20 40 60 80 100 120 140 160 180 200 220 240 260
w (%)
p
d(k
g/
m
3)
fresh DBP cell 1 cell 8 cell 13 cell 14 40% 60% 80% 100%Figure 3 - Evolution of Total Volumes of CO2 and CH4 over Time, at 38°C 0 50 100 150 200 0 150 300 450 600 750 900 1050 1200 1350 1500 Time (days) Accumu late d to tal g as, CO2 an d CH4 (l/kg dry materia l) Total gas CO2 CH4 n=10 n=8 n=6 n=4 n=2 n = number of simples
Analyzed up to this point by Panarotto et al. (2005) n=12
Figure 4 - Volumetric Composition of Biogas Resulting From the Biodegradation of DBP 0 10 20 30 40 50 60 70 80 90 100 0 150 300 450 600 750 900 1050 1200 1350 1500
Time (days)
Vo
lu
m
et
ric
c
om
po
si
tio
n
of
g
as
(%
)
CO2 CH4 Analyzed up to this pointby Panarotto et al. (2004)
Figure 5 - Evolution of Biogas Production over Time at Different Temperatures y = 0.0605x + 71.807 R2 = 0.9651 y = 0.0728x + 38.557 R2 = 0.9946 y = 0.0083x + 126.63 R2 = 0.9822 80 90 100 110 120 130 140 150 160 170 180 1260 1310 1360 1410 1460
Time (days)
To
ta
l g
as
p
ro
du
ct
io
n
(l/
kg
d
ry
m
at
er
ia
l)
cells 1 and 14 (at 38°C) cells 8 and 13 (at 38°C) cells 1 and 14 (at 14°C)
Figure 6 - Evolution of Selected Physico-chemical parameters of the DBP Leachate at 38°C: a) pH, Electric Conductivity and COD. b) Total Solids and Total Volatile Solids
0 5000 10000 15000 20000 25000 30000 0 200 400 600 800 1000 1200 1400 Time (days) Electric con duc tivity (umoh s/cm) a nd COD (mg/l) 0 1 2 3 4 5 6 7 8 pH COD Electric conductivity pH 5th 1st 2nd 3rd 4th 6th 7th 8th leachig period (a) 0 5000 10000 15000 20000 25000 30000 0 200 400 600 800 1000 1200 1400 Time (days) Total solid s an d to tal v olat ile so lids ( mg/L) TS TVS 1st 2nd 3rd 4th 5th 6th 7th 8th leaching period (b)
Figure 7 - Evolution of a) pH b) Electric Conductivity, c) COD and d) TS and TVS during the 9th EVV Conducted on DBP at 14°C 0 1 2 3 4 5 6 7 1420 1425 1430 1435 1440 1445 1450
Time (days)
pH
(a)0 200 400 600 800 1000 1200 1400 1420 1425 1430 1435 1440 1445 1450
Time (days)
El
ec
tri
c
co
nd
uc
tiv
ity
(u
m
oh
s/
cm
)
(b)0 50 100 150 200 250 300 350 400 450 1420 1425 1430 1435 1440 1445 1450
Time (days)
C
O
D
(m
g/
L)
(c)0 200 400 600 800 1000 1200 1420 1425 1430 1435 1440 1445 1450
Time (days)
To ta l s ol id s an d to ta l v ol ati le s ol id s (m g/ L) TS TVS (d)Figure 8: Evolution of Indirect Mass Loss of DBP: a) Loss by Gas Production (CO2 and CH4); b) Loss by Leaching of Total Solids 0 2 4 6 8 10 12 14 16 0 150 300 450 600 750 900 1050 1200 1350 1500
Time (days)
M
as
s
lo
ss
(%
) b
y
ga
s
pr
od
uc
tio
n
CO2 CH4 n=10 n=8 n=6 n=4 n=2 n=12n: number of samples (a)
Analyzed up to this point by Panarotto et al. (2005)
0 0.5 1 1.5 2 2.5 3 3.5 4 4.5 5 5.5 6 6.5 7 0 100 200 300 400 500 600 700 800 900 1000 1100 1200 1300 1400 1500
Time (days)
M
as
s
lo
ss
b
y
le
ac
hi
ng
(%
)
.
n=12 n=10 n=8 n=6 n=4 n=4 n=4 n=4 1st 2nd 3rd 4th 5th 6th 7th 8th n: number of samples (b) leaching periodFigure 9 - Variation of the hydraulic conductivity with void ratio and incubation periods: a) fresh and 50 d of incubation; b) 150 d; c) 270 d and d) 400 d (cells 6 and 9) and 1460 d (cells 1, 8, 13 and 14)
2.2 2.4 2.6 2.8 3.0 3.2 3.4 3.6 3.8 4.0 4.2 4.4
1.00E-08 1.00E-07 1.00E-06 1.00E-05
ksat (cm/s) V oi d ra tio ( -) fresh SPD; w = 162% fresh SPD; w = 205% cell 02; w = 202% cell 11; w = 202%
Tests performed with exhumed material from cells 2 and 11, after consolidation to 12, 24, 48 and 96 kPa (exhumation after 50 d) (a) 12 kPa 24 kPa 24 kPa 48 kPa 96 kPa
2.2 2.4 2.6 2.8 3.0 3.2 3.4 3.6 3.8 4.0 4.2 4.4
1.00E-08 1.00E-07 1.00E-06 1.00E-05
ksat (cm/s) V oi d ra tio (-) fresh SPD; w = 162% fresh SPD; w = 205% cell 5; w = 207% cell 12; w = 207% (b)
Tests performed with exhumed material from cells 5 and 12, after consolidation to 12, 24, 48 and 96 kPa
2.2 2.4 2.6 2.8 3.0 3.2 3.4 3.6 3.8 4.0 4.2 4.4
1.00E-08 1.00E-07 1.00E-06 1.00E-05
k
sat(cm/s)
V
oi
d
ra
tio
(-)
fresh DBP; w = 162% fresh DBP; w = 205% cell 3; w=213.6% cell 7; w = 212.7%Tests performed with exhumed material from cells 3 and 7, after consolidation to 12, 24, 48 and 96 kPa
(exhumation after 273 days)
2.2 2.4 2.6 2.8 3.0 3.2 3.4 3.6 3.8 4.0 4.2 4.4
1.00E-08 1.00E-07 1.00E-06 1.00E-05
ksat (cm/s) V oi d ra tio (-) Fresh DBP; w=162% Fresh DBP; w=205% cell 6; w=213.1% cell 9; w=216.9 % cell 1; w=237.4% cell 8; w=241.4% cell 13; w=231.2% cell 14; w=238.1%
Tests performed with exhumed material from cells 6 and 9 (after 400 d) and from cells 1, 8, 13 and 14 (after 1450 d), after
consolidation to 12, 24, 48 and 96 kPa
Figure 10 - Evolution of the saturated hydraulic conductivity associated with a void ratio equal to 3.2 0.00E+00 2.00E-07 4.00E-07 6.00E-07 8.00E-07 1.00E-06 1.20E-06 0 200 400 600 800 1000 1200 1400 1600
Time (days)
K
sa t(c
m
/s
)
? void ratio = 3.2Average of 3 tests using material taken from 3 other cells incubated at 21°C for 400 d
Average ksat for the tests with samples from cells 6 and 9 (incubated at 38°C)

![Table 3 - Geotechnical parameters of DBP samples after 400 d (cells 6 and 9) and 1460 d (other samples) of incubation Cell Nb (elapsed time, d) V i[Vf ] (cm3 ) Mi [Mf] (g) V/V (%) e 0[ef ] 1 e 0e (%) w i[w f ] (%) S ri[S rf ] (%) Dr i[](https://thumb-eu.123doks.com/thumbv2/123doknet/3118787.88610/26.1188.245.949.187.570/table-geotechnical-parameters-samples-cells-samples-incubation-elapsed.webp)