O
pen
A
rchive
T
OULOUSE
A
rchive
O
uverte (
OATAO
)
OATAO is an open access repository that collects the work of Toulouse researchers and
makes it freely available over the web where possible.
This is an author-deposited version published in :
http://oatao.univ-toulouse.fr/
Eprints ID : 18158
To link to this article : DOI:
10.1002/jor.23459
URL :
http://dx.doi.org/10.1002/jor.23459
To cite this version :
Reina, Nicolas and Cavaignac, Etienne and
Pailhe, Régis and Pailliser, Aymeric and Bonnevialle, Nicolas and
Swider, Pascal and Laffosse, Jean-Michel BMI-related
microstructural changes in the tibial subchondral trabecular bone
of patients with knee osteoarthritis. (2017) Journal of Orthopaedic
Research, vol. 35 (n° 8). pp. 1653-1660. ISSN 0736-0266
Any correspondence concerning this service should be sent to the repository
administrator:
[email protected]
BMI-Related Microstructural Changes in the Tibial Subchondral
Trabecular Bone of Patients With Knee Osteoarthritis
Nicolas Reina,1,2Etienne Cavaignac,1,2R!egis Pailh!e,3,4Aymeric Pailliser,3Nicolas Bonnevialle,1,3Pascal Swider,3
Jean-Michel Laffosse1,3
1Department of Orthopaedic and Trauma Surgery, H^opital Pierre Paul Riquet, Centre Hospitalier Universitaire de Toulouse, Place du Docteur Baylac, TSA 40031, 31059 Toulouse cedex 9, France,2Hominid Evolutionary Biology, AMIS-UMR 5288 CNRS, University of Toulouse, Toulouse, France, 3Biomechanics Laboratory, IMFT UMR 5502, University of Toulouse, Toulouse, France, 4Department of Orthopaedic and Trauma Surgery, CHU Grenoble, Toulouse, France
ABSTRACT: Overweight is a risk factor for osteoarthritis on the knees. Subchondral trabecular bone (SCTB) densification has been shown to be associated with cartilage degeneration. This study analyzed the microarchitectural changes in the SCTB of tibial plateaus to validate the hypothesis that the degree of remodeling is correlated with a patient’s body weight. Twenty-one tibial plateaus were collected during total knee arthroplasty from 21 patients (15 women and 6 men). These patients had a mean age of 70.4 years (49–81), mean weight of 74.7 kg (57–93) and mean body mass index (BMI) of 28.4 kg/m2(21.3–40.8). One cylindrical plug was harvested in the center of each tibial plateau (medial and lateral). Micro-CT parameters (7.4 mm resolution) were determined to describe the SCTB structure. On the medial plateau, there were significant correlations between BMI and bone volume fraction BV/TV (r ¼ 0.595, p ¼0.004), structure model index SMI (r ¼ "0.704 p ¼ 0.0002), trabecular space Tb.Sp (r ¼ 0.600, p ¼ 0.04) and trabecular number Tb.N (r ¼ 0.549, p ¼ 0.01). SCTB densification during osteoarthritis is associated with a reduction in its elastic modulus, which could increase cartilage stress, and accelerate cartilage loss. SCTB densification has been shown to precede cartilage degeneration. The correlation of SCTB microarchitecture and body weight may explain why knee osteoarthritis is more common in overweight or obese patients.
Keywords: osteoarthritis; obesity; weight; subchondral bone; microstructure
Osteoarthritis of the knee can lead to severe functional disability. The risk of knee osteoarthritis increases greatly with age: the prevalence is 5% at age 55 but increases to 40–50% in those over 80 years of age.1
Many factors beyond age and physiological aging of the joint have been identified to explain the complex, multifactorial pathophysiology of knee osteoarthritis.2 A patient’s body weight is one of the main predispos-ing factors. This has been confirmed by the statistical relationship between excess weight and early, rapid development of knee osteoarthritis.1,3
Being overweighted (BMI > 25)4 places excessive mechanical loads on a person’s knees5and contributes to degenerative arthritis of the knee. The pathophysi-ology of this phenomenon is not well defined. Densifi-cation of subchondral trabecular bone (SCTB) is a classic radiographic sign of osteoarthritis, no matter which joint is affected. It is very clearly visible at the proximal tibial on standard radiographs in knee osteoarthritis patients. In terms of micro-architecture, this translates to changes in microstructural parame-ters that can be analyzed by micro-computed tomogra-phy (micro-CT): increase in the bone volume fraction (BV/TV), increase in trabecular thickness (Tb.Th) and reduction in the structure model index (SMI).6–8
In parallel, studies have demonstrated that a chronological relationship9 or association10 exists be-tween changes in these microarchitectural parameters and the development of osteoarthritis in animal mod-els. Thickening of subchondral bone and increases in Tb.Th and BV/TV precede chondrocyte apoptosis and cartilage degeneration. Subchondral bone remodeling may be a factor leading to chondrocyte apoptosis.9 Microarchitectural remodeling of subchondral bone may be the link between excess weight and knee osteoarthritis.
We hypothesized that in knee osteoarthritis, the magnitude of SCTB microarchitectural changes and remodeling in the tibial plateaus are correlated with a patient’s weight. The primary objective of this study was to determine if a correlation exists between tibial plateau SCTB microstructural changes and body weight. The secondary objective was to verify the correlation between microarchitectural parameters and other patient patterns.
MATERIALS AND METHODS
Patient Selection
After gaining approval from our institutional review board and obtaining informed consent from our patients, 21 tibial pla-teaus were collected during total knee arthroplasty (TKA) from 21 patients who had been diagnosed with primary knee osteoarthritis based on clinical and radiographic criteria. Any medical and surgical histories were noted. Patients were excluded if the TKA indication was something other than primary osteoarthritis (e.g., rheumatoid arthritis, osteonecro-sis, posttraumatic osteoarthritis), there was a history of tibial and/or femoral osteotomy or of long-term corticosteroid therapy or bisphosphonate treatment. The patient’s weight and height were recorded preoperatively and the BMI calculated, making
All authors have read and approved the final submitted manu-script.
Conflict of interest: No benefits in any form have been received or will be received by any authors from a commercial party related directly or indirectly to the subject of this article. Correspondence to: Nicolas Reina (T: 5-61-77-56-33; F: þ33-5-61-77-76-17; E-mail: [email protected])
sure that the patient’s weight had not changed during the year leading up to the surgery. Patients underwent a preoperative radiographic assessment consisting of standard A/P and lateral radiographs, and schuss view of the knee (A/P view with patient standing on single leg in 30˚ flexion) to confirm the presence of osteoarthritis and its stage. There were 15 women and 6 men. The mean age at the time of surgery was 70.4 $ 9 years (49–81). Eleven patients were less than 70 years old (young subgroup) and 10 were more than 70 years old (old subgroup). The mean weight was 74.7 $ 10.8 kg (57–93) and the mean height was 163 $ 9 cm (150–184). The mean BMI was 28.1 $ 4.8 kg/m2 (21.3–40.8); five patients had a normal
weight (BMI % 25), 11 patients were overweight (25 < BMI %30) and five were obese (BMI > 30).
Specimen Preparation
The tibial plateaus were harvested during knee surgery cutting perpendicular to tibia axis on the proximal epiphysis. Samples were frozen for storage at "18˚C. One cylindrical plug was harvested by drilling the frozen bone in the center of the medial and lateral parts of each tibial plateau. Each specimen was 10 mm in diameter to ensure that sufficient bone tissue was available to obtain reliable numerical data and avoid cutting-related artifacts. The region of interest was the central weight-bearing portion. The orientation of the cylindrical plug was carefully checked to ensure that the longitudinal axis of the tibia corresponded to that of the cylindrical specimen.
Microstructural Analysis
A micro-CT system (Skyscan1
1174, Bruker micro-CT, Kontich, Belgium) was used to determine the microarchitec-ture of the tibial plateau’s SCTB. Each specimen was placed in a cylindrical sample holder in Ringer’s solution to prevent
movement and changes in the micro-CT parameters due to drying during the scanning process. Each plug was scanned continuously in 7.4 mm thick slices. The voxel size was 7.4 & 7.4 & 7.4 mm. Boundaries and cartilage zones were care-fully excluded to avoid artifacts. The regions of interest (ROI, 8,5 mm in diameter and 5 mm in height) were located in the center of the SCTB of the specimen under the tibial plateau’s subchondral plate, which was excluded from the analysis. The same procedure was used to select all the ROIs in all plugs. The following three-dimensional parameters were used to describe the SCTB structure: bone volume fraction (BV/TV); specific bone surface (BS/BV); trabecular number (Tb.N); trabecular thickness (Tb.Th); trabecular separation (Tb.Sp); trabecular pattern factor (Tb.Pf); degree of architec-tural anisotropy (DA), and structure model index (SMI). Statistical Analysis
Calculations were performed with Statview1software (SAS
Institute Inc., Cary, NC). Nominal variables were reported as sample sizes and percentages. Continuous variables were described by the mean, standard deviation, maximum and minimum. Normal data distribution was verified. The groups were compared with an independent Student’s t-test if the data were normally distributed and a nonparametric test if they were not. A Chi-square test was performed on nominal variables if the expected frequencies were five or more; if not, a Fischer’s exact test was carried out. Correlations r were determined using Pearson or Spearman correlation or determination coefficients r2 with 95% confidence intervals. The significance threshold was set at p < 0.05.
RESULTS
The radiographs identified 14 cases of predominantly medial osteoarthritis with varus deformity and seven
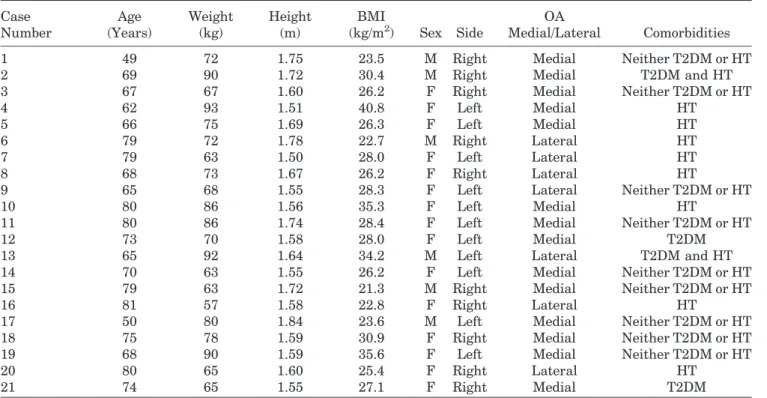
Table 1. Clinical and Radiographic Preoperative Data Case Number Age (Years) Weight (kg) Height (m) BMI (kg/m2) Sex Side OA Medial/Lateral Comorbidities
1 49 72 1.75 23.5 M Right Medial Neither T2DM or HT
2 69 90 1.72 30.4 M Right Medial T2DM and HT
3 67 67 1.60 26.2 F Right Medial Neither T2DM or HT
4 62 93 1.51 40.8 F Left Medial HT
5 66 75 1.69 26.3 F Left Medial HT
6 79 72 1.78 22.7 M Right Lateral HT
7 79 63 1.50 28.0 F Left Lateral HT
8 68 73 1.67 26.2 F Right Lateral HT
9 65 68 1.55 28.3 F Left Lateral Neither T2DM or HT
10 80 86 1.56 35.3 F Left Medial HT
11 80 86 1.74 28.4 F Left Medial Neither T2DM or HT
12 73 70 1.58 28.0 F Left Medial T2DM
13 65 92 1.64 34.2 M Left Lateral T2DM and HT
14 70 63 1.55 26.2 F Left Medial Neither T2DM or HT
15 79 63 1.72 21.3 M Right Medial Neither T2DM or HT
16 81 57 1.58 22.8 F Right Lateral HT
17 50 80 1.84 23.6 M Left Medial Neither T2DM or HT
18 75 78 1.59 30.9 F Right Medial Neither T2DM or HT
19 68 90 1.59 35.6 F Left Medial Neither T2DM or HT
20 80 65 1.60 25.4 F Right Lateral HT
21 74 65 1.55 27.1 F Right Medial T2DM
cases of predominantly lateral osteoarthritis with valgus deformity. The entire set of preoperative clini-cal and radiologiclini-cal data is presented in Table 1.
The results of the micro-CT analysis of the medial and lateral plateaus are given in Table 2 (BV/TV, BS/ BV, SMI, Tb.Th, Tb.N, Tb.Sp, Tb.Pf). There was no significant gender difference in the mean values (p > 0.05) for any of the microarchitectural data, either medially and laterally; therefore, the data were pooled for the remaining analyses.
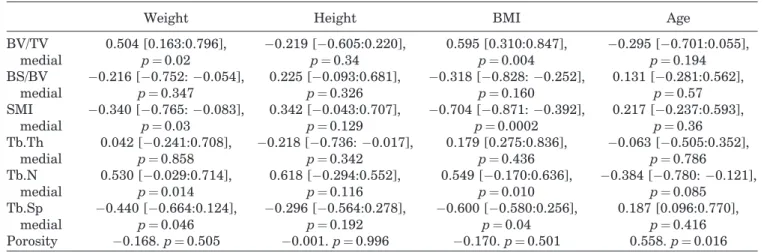
Weight and BMI were significantly correlated to microarchitectural parameters in the medial plateau (BV/TV, SMI, Tb.Th, Tb.N) (Table 3). There were
strong correlations between BMI and BV/TV
(r ¼ 0.595, p ¼ 0.004), SMI (r ¼ "0.704 p ¼ 0.0002), Tb. Sp (r ¼ 0.600, p ¼ 0.04) and Tb.N (r ¼ 0.549, p ¼ 0.01) (Fig. 1A, B, and C; Fig. 2A and B). Some of the microarchitectural parameters in the medial tibial plateau varied based on patient weight (Table 4 and Fig. 3A and B). However, none of the endostructure pattern was significantly correlated with the patient’s height. None of the parameters measured in the lateral plateau samples were correlated with height, weight or BMI.
Porosity tended to increase with age (r ¼ 0.558, p ¼0.016) in the medial tibial plateaus. This was associated with a significant decrease in Tb.N (r ¼ "0.384, p ¼ 0.08) (Fig. 4A and B; Fig. 5A and B). In the subgroup of patients under 70 years of age, the bone network was denser (BV/TV ¼ 42.4 $ 9% vs. 34.8 $ 9.8%, p ¼ 0.23), contained more trabeculae (Tb.N ¼ 1.88 $ 0.36 vs. 1.72 $ 0.18, p ¼ 0.054) than in patients above 70 years of age.
DISCUSSION
To our knowledge, this is the first study showing a significant correlation between changes in various microarchitectural parameters and the weight of patients with knee osteoarthritis. These correlations are even stronger when BMI is taken into account. Wen et al.11 evaluated the effect of type 2 diabetes
mellitus (T2DM) and hypertension on bone mineral density (BMD) of the subchondral plate and SCTB porosity in the medial plateau of arthritic knees. In their study, 79% of patients were overweight or obese, 63% suffered from hypertension and 30% had T2DM. Hypertension and T2DM were associated with a significant reduction in the subchondral plate BMD and an increase in the SCTB porosity. They also found a significant decrease in subchondral plate BMD and an increase in SCTB porosity as BMI increased. These results differ from those in the current study. We found an increase in the bone volume fraction (BV/TV) and trabecular thickness and intertrabecular connec-tivity as BMI increased. Our study showed a direct relationship between remodeling of the tibial plateaus in arthritic knees and body weight; excess weight places additional demands on the bone to which it must adapt mechanically. The limits of our study were
Table 2. Micro-CT Data BV/TV BS/BV SMI Tb.Th (m m) Tb.N (1/mm) Tb.Sp (m m) Tb.Pf Case Number Medial Lateral Medial Lateral Medial Lateral Medial Lateral Medial Lateral Medial Lateral Medial Lateral Mean $ SD (min; max) 34.82 $ 10.81 (17.45; 58.97) 26.94 $ 8.85 (14.11; 43.81) 18.70 $ 3.58 (13.04; 27.09) 19.81 $ 3.88 (13.71; 31.84) -0.33 $ 1.67 (" 3.5; 2.1) 0.61 $ 1.25 (" 1.60; 2.78) 228 $ 42 (128; 332) 207 $ 36 (151; 297) 1.64 $ 0.29 (1.17; 2.11) 1.41 $ 0.27 (0.86; 1.81) 456 $ 89 (283; 631) 509 $ 82 (393; 693) " 6.173 $ 6.596 (" 25.492; 2.780) " 1.548 $ 5.030 (" 16.033; 4.083) B V /T V , b on e v ol u m e fr a ct io n ; B S /B V , sp ec ifi c b on e su rf a ce ; S M I, st ru ct u re m od el in d ex ; T b .T h , tr a b ec u la r th ic k n es s; T b .N , tr a b ec u la r n u m b er ; T b .S p , tr a b ec u la r se p a ra ti on ; T b .P f, tr a b ec u la r p a tt er n fa ct or .
the absence of non-arthritic young or old people as witness and the little numbers of cases but our results confirm our hypothesis that a patient’s weight and BMI affect the SCTB microstructure (Table 3).
While an increase in body weight is associated mainly with an increase in trabecular thickness (Tb.Th), intertrabecular connectivity (Tb.Pf) and
bone volume fraction (BV/TV) in arthritic knees, the number of trabeculae decreases (Tb.N) and trabecular separation (Tb.Sp) increases, resulting in significantly lower bone bone volume fraction (BV/TV) with age. The correlation between age and these microarchitectural data has already been demonstrated.12–14 In healthy knees, these
age-Table 3. Correlations Between Micro-CT Parameters and Weight, Height, BMI, and Age
Weight Height BMI Age
BV/TV medial 0.504 [0.163:0.796], p ¼0.02 "0.219 ["0.605:0.220], p ¼0.34 0.595 [0.310:0.847], p ¼0.004 "0.295 ["0.701:0.055], p ¼0.194 BS/BV medial "0.216 ["0.752: "0.054], p ¼0.347 0.225 ["0.093:0.681], p ¼0.326 "0.318 ["0.828: "0.252], p ¼0.160 0.131 ["0.281:0.562], p ¼0.57 SMI medial "0.340 ["0.765: "0.083], p ¼0.03 0.342 ["0.043:0.707], p ¼0.129 "0.704 ["0.871: "0.392], p ¼0.0002 0.217 ["0.237:0.593], p ¼0.36 Tb.Th medial 0.042 ["0.241:0.708], p ¼0.858 "0.218 ["0.736: "0.017], p ¼0.342 0.179 [0.275:0.836], p ¼0.436 "0.063 ["0.505:0.352], p ¼0.786 Tb.N medial 0.530 ["0.029:0.714], p ¼0.014 0.618 ["0.294:0.552], p ¼0.116 0.549 ["0.170:0.636], p ¼0.010 "0.384 ["0.780: "0.121], p ¼0.085 Tb.Sp medial "0.440 ["0.664:0.124], p ¼0.046 "0.296 ["0.564:0.278], p ¼0.192 "0.600 ["0.580:0.256], p ¼0.04 0.187 [0.096:0.770], p ¼0.416 Porosity "0.168. p ¼ 0.505 "0.001. p ¼ 0.996 "0.170. p ¼ 0.501 0.558. p ¼ 0.016 Correlations are expressed using Pearson or Spearman correlation coefficients (r [CI 95%]. p-value).
Figure 1. Correlation of body mass index (kg/m2) with bone volume fraction (BV/TV) r ¼ 0.595, p ¼ 0.004 (A), structure model index (SMI) r ¼ "0.704 p ¼ 0.0002 (B) and trabecular space (Tb.Sp) r ¼ 0.600, p ¼ 0.04 (C) for the medial tibial plateau.
related changes affect both tibial plateaus in a similar manner.13 Ding et al.14 found a reduction in trabecular thickness (Tb.Th) and an increase in the SMI (to a more rod-like structure) especially after 60 years of age. They reported no significant decrease in the number of trabeculae (Tb.N). This was associated with a significant decrease in the SCTB mechanical properties in these subjects with a reduction in stiffness and Young’s modulus.15 Chen
et al.16 had similar findings in an Asian population but also found this decrease to be lesser in men than women. In the current study, these differences were found only in the medial tibial plateaus, while Ding et al.12had found this in both the medial and lateral
condyles. In early osteoarthritis, these changes are mainly found in the most damaged compartment.6
We hypothesized that in knee osteoarthritis, the magnitude of SCTB microarchitectural changes and remodeling in the tibial plateaus are correlated to patient weight. This could explain the high prevalence of knee osteoarthritis in overweight and obese patients. This led us to analyze the SCTB micro-architectural parameters in the tibial plateaus of arthritic knees based on weight and BMI. The values were similar and consistent with those found by other groups for arthritic tibial plateaus.6–8,18 The small differences between this and certain other studies can be attributed to the higher voxel size used in the current study (7.4 mm) versus 15 mm for Chen et al.16
22 mm for Ding et al.6 26 mm for Patel al.18 or 22 mm
for Ding14. The micro-CT system used in the current study has similar reliability to other systems.19
Figure 2. Micro-CT slices showing the effect of weight and BMI on the architecture of subchondral trabecular bone of the medial tibial plateau: (A) case 1, 49-year-old man with BMI of 23.5 (BV/TV ¼ 27.88) and (B) case 19, 68-year-old woman with BMI of 35.6 (BV/TV ¼ 38.77).
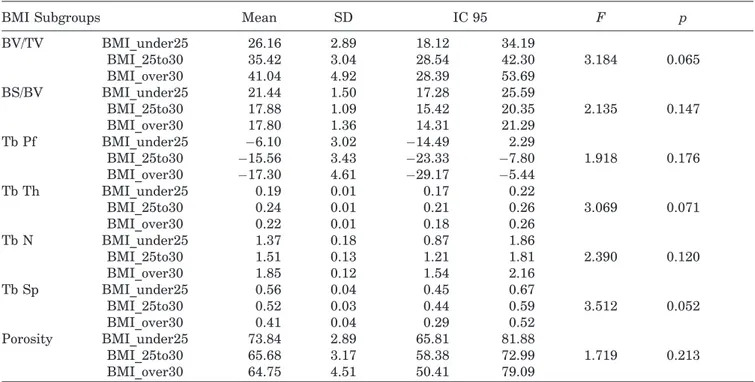
Table 4. Micro-CT Data by Weight Subgroup
BMI Subgroups Mean SD IC 95 F p
BV/TV BMI_under25 26.16 2.89 18.12 34.19 3.184 0.065 BMI_25to30 35.42 3.04 28.54 42.30 BMI_over30 41.04 4.92 28.39 53.69 BS/BV BMI_under25 21.44 1.50 17.28 25.59 2.135 0.147 BMI_25to30 17.88 1.09 15.42 20.35 BMI_over30 17.80 1.36 14.31 21.29 Tb Pf BMI_under25 "6.10 3.02 "14.49 2.29 1.918 0.176 BMI_25to30 "15.56 3.43 "23.33 "7.80 BMI_over30 "17.30 4.61 "29.17 "5.44 Tb Th BMI_under25 0.19 0.01 0.17 0.22 3.069 0.071 BMI_25to30 0.24 0.01 0.21 0.26 BMI_over30 0.22 0.01 0.18 0.26 Tb N BMI_under25 1.37 0.18 0.87 1.86 2.390 0.120 BMI_25to30 1.51 0.13 1.21 1.81 BMI_over30 1.85 0.12 1.54 2.16 Tb Sp BMI_under25 0.56 0.04 0.45 0.67 3.512 0.052 BMI_25to30 0.52 0.03 0.44 0.59 BMI_over30 0.41 0.04 0.29 0.52 Porosity BMI_under25 73.84 2.89 65.81 81.88 1.719 0.213 BMI_25to30 65.68 3.17 58.38 72.99 BMI_over30 64.75 4.51 50.41 79.09
BV/TV, bone volume fraction; BS/BV, specific bone surface; SMI, structure model index; Tb.Th, trabecular thickness; Tb.N, trabecular number; Tb.Sp, trabecular separation; Tb.Pf, trabecular pattern factor.
Prospective studies have shown that obesity and excess weight are risk factors for knee osteoarthri-tis.2,17,3 They are also risk factors for abnormal lower limb alignment, as this places excessive loads on the tibial plateaus.5,20 These excessive loads, no matter the cause, induce premature cartilage wear, probably by direct action. However, the pathophysiology is more complex and involve many other indirect phenomena.2
Studies have already related SCTB thickening and densification with cartilage deterioration in rabbit and mouse OA models.21,22 Mechanically, there is a decrease in the SCTB modulus of elasticity in the tibial plateau of arthritic knees,23 and some research-ers have suggested that the lower SCTB modulus can increase cartilage stress and accelerate cartilage loss.24In an animal OA model9it has been shown that
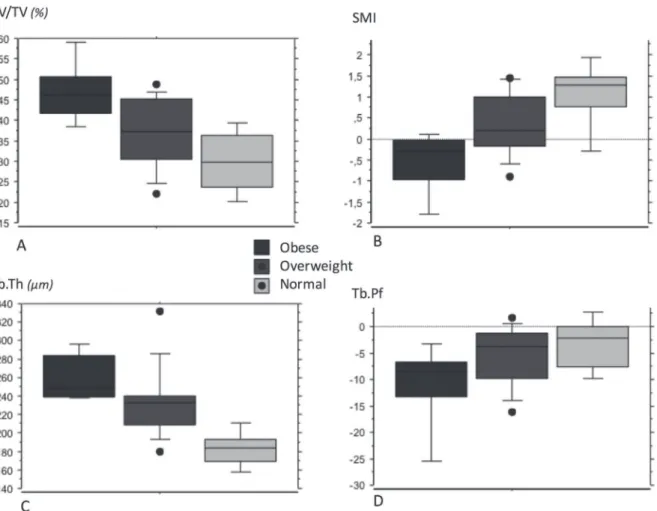
Figure 3. Box-plot for each body weight subgroup (normal, overweight, obese) for micro-CT parameters of the medial tibial plateau: bone volume fraction (BV/TV) (A), structure model index (SMI) (B), trabecular thickness (Tb.Th) (C), and trabecular pattern factor (Tb.Pf) (D).
Figure 4. Correlation of age (years) with trabecular number (Tb.N) (A) and trabecular separation (Tb.Sp) (B) in the medial tibial plateau.
SCTB densification precedes chondrocyte apoptosis and cartilage degradation. This suggests that chondro-cyte apoptosis could be a consequence of subchondral bone remodeling,9however the pathophysiology of this effect is not known. Articular cartilage and subchon-dral bone are a functional unit.25 Any structural and
biochemical changes in one structure will affect the homeostasis of the other.11,26
The current study confirms the intricacy of many phenomena in the appearance and development of osteoarthritis. The increase in the frequency of knee osteoarthritis with age1 in the absence of other
predisposing factors shows that physiological aging processes contribute to cartilage degeneration. The higher occurrence of knee osteoarthritis in overweight and obese individuals, or those with lower limb misalignment, shows that associated mechanical phe-nomena are important. The role of the subchondral bone in the initiation and progression of osteo-arthritis has already been demonstrated.2,17,27 Burr and Gallant2 believe that subchondral bone densifica-tion is not the initiating factor for cartilage degrada-tion and that it does not act in isoladegrada-tion to allow disease progression. The correlation between SCTB microarchitectural changes and weight and the demon-strated temporal relationship, in which SCTB densifica-tion precedes cartilage degeneradensifica-tion, may explain the higher frequency of knee osteoarthritis in younger, overweight patients.
AUTHORS’ CONTRIBUTIONS
Credit for authorship should be based on: (i) substantial contributions to research design (N. Reina, E. Cavai-gnac, R. Pailh!e, P. Swider), or the acquisition (A. Pailliser, N. Bonnevialle, N. Reina), analysis or interpre-tation of data (J.M. Laffosse, A. Pailliser, R. Pailh!e, N. Reina); (ii) drafting the paper or revising it critically
(J.M. Laffosse, N. Reina); (iii) approval of the submitted and final versions (J.M. Laffosse, A. Pailliser, N. Bonne-vialle, R. Pailh!e, N. Reina, E. Cavaignac, P. Swider).
ACKNOWLEDGMENTS
We would like to thank Joanne Archambault, PhD, for her editorial support during preparation of this manuscript.
REFERENCES
1. Felson D, Zhang Y, Hannan M, et al. 1997. Risk factors for incident radiographic knee osteoarthritis in the elderly: the FraminghamStudy. Arthritis Rheum 40:728–733.
2. Burr D, Gallant M. 2012. Bone remodelling in osteoarthritis. Nat Rev Rheumatol 8:665–673.
3. Gelber A, Hochberg M, Mead L, et al. 1999. Body mass index in young men and the risk of subsequent knee and hip osteoarthritis. Am J Med 107:542–548.
4. Kuczmarski R, Flegal K. 2000. Criteria for definition of overweight in transition: background and recommendations for the United States. Am J Clin Nutr 72:1074–1081. 5. Maquet P. 1976. Biomechanics of the knee. Berlin
Heidel-berg: Springer Verlag; 237.
6. Ding M, Odgaard A, Hvid I. 2003. Changes in the three-dimensional microstructure of human tibial cancellous bone in early osteoarthritis. J Bone Joint Surg Br 85:906–912. 7. Bobinac D, Spanjol J, Zoricic S, et al. 2003. Changes in
articular cartilage and subchondral bone histomorphometry in osteoarthritic knee joints in humans. Bone 32:284–290. 8. Kamibayashi L, Wyss UP, Cooke TD, et al. 1995. Trabecular
microstructure in the medial condyle of the proximal tibia of patients with knee osteoarthritis. Bone 17:27–35.
9. Zamli Z, Robson Brown K, Tarlton, et al. 2014. Subchondral bone plate thickening precedes chondrocyte apoptosis and cartilage degradation in spontaneous animal models of osteoarthritis. Biomed Res Int 2014:606870.
10. Wang T, Wen CY, Yan CH, et al. 2013. Spatial and temporal changes of subchondral bone proceed to microscopic articular cartilage degeneration in guinea pigs with spontaneous osteoarthritis. Osteoarthritis Cartilage 21:574–581.
11. Wen C, Chen Y, Tang H, et al. 2013. Bone loss at subchondral plate in knee osteoarthritis patients with hypertension and Figure 5. Micro-CT slices showing the effect of age on subchondral trabecular bone microarchitecture in the medial tibial plateau: (A) case 1, 49-year-old man with BMI of 23.5 and (B) case 16, 81-year-old man with BMI of 22.8
type 2 diabetes mellitus. Osteoarthritis Cartilage 21:1716– 1723.
12. Ding M, Odgaard A, Linde F, et al. 2002. Age-related variations in the microstructure of human tibial cancellous bone. J Orthop Res 20:615–621.
13. Ding M. 2000. Age variations in the properties of human tibial trabecular bone and cartilage. Acta Orthop Scand Suppl 292:1–45.
14. Ding M, Hvid I. 2000. Quantification of age-related changes in the structure model type and trabecular thickness of human tibialcancellous bone. Bone 26:291–295.
15. Ding M, Dalstra M, Danielsen C, et al. 1997. Age variations in the properties of human tibial trabecular bone. J Bone Joint Surg Br 79:995–1002.
16. Chen H, Washimi Y, Kubo K, et al. 2011. Gender-related changes in three-dimensional microstructure of trabecular bone of the human proximal tibia with aging. Histol Histopathol 26:563–570s.
17. Burr D. 1998. The importance of subchondral bone in osteo-arthrosis. Curr Opin Rheumatol 10:256–262.
18. Patel V, Issever AS, Burghardt A, et al. 2003. MicroCT evaluation of normal and osteoarthritic bone structure in human knee specimens. J Orthop Res 21:6–13.
19. Bonnet N, Laroche N, Vico L, et al. 2009. Assessment of trabecular bone microarchitecture by two different x-ray microcomputedtomographs: a comparative study of the rat distal tibia using Skyscan and Scanco devices. Med Phys 36:1286–1297.
20. Sharma L, Song J, Felson D, et al. 2001. The role of knee alignment in disease progression and functional decline in knee osteoarthritis. JAMA 286:188–195.
21. Benske J, Schunke M, Tillmann B. 1988. Subchondral bone formation in arthrisis. Polychrome labeling studies in mice. Acta Orthop Scand 59:536–541.
22. Wu D, Burr D, Boyd R, et al. 1990. Bone and cartilage changes following experimental varus or valgus tibial angu-lation. J Orthop Res 8:572–585.
23. Day JS, Ding M, van der Linden JC, et al. 2001. A decreased subchondral trabecular bone tissue elastic modulus is associ-ated with pre-arthritic cartilage damage. J Orthop Res 19:914–918.
24. Karsdal MA, Leeming DJ, Henriksen K, et al. 2008. Should subchondral bone turnover be targeted when treating osteo-arthritis?. Osteoarthritis Cartilage 16:638–646.
25. Lories R, Luyten F. 2011. The bone-cartilage unit in osteoar-thritis. Nature reviews. Rheumatology 7:43–49.
26. Suri S, Walsh D. 2012. Osteochondral alterations in osteoar-thritis. Bone 51:204–211.
27. Radin E, Rose R. 1986. Role of subchondral bone in the initiation and progression of cartilage damage. Clin Orthop Relat Res 213:34–40.
SUPPORTING INFORMATION
Additional supporting information may be found in the online version of this article.