Science Arts & Métiers (SAM)
is an open access repository that collects the work of Arts et Métiers Institute of
Technology researchers and makes it freely available over the web where possible.
This is an author-deposited version published in:
https://sam.ensam.eu
Handle ID: .
http://hdl.handle.net/10985/18403
To cite this version :
Sahbi TAMBOURA, H. AYARI, Mohammadali SHIRINBAYAN, M. A. LARIBI, Hachmi BENDALY,
Habib SIDHOM, Abbas TCHARKHTCHI, Joseph FITOUSSI - Experimental and numerical
multi-scale approach for Sheet-Molding-Compound composites fatigue prediction based on fiber-matrix
interface cyclic damage - International Journal of Fatigue - Vol. 135, p.1-10 - 2020
Any correspondence concerning this service should be sent to the repository
Administrator :
[email protected]
Experimental and numerical multi-scale approach for
Sheet-Molding-Compound composites fatigue prediction based on
fiber-matrix interface
cyclic damage
S. Tamboura
a,⁎, H. Ayari
a,b, M. Shirinbayan
b, M.A. Laribi
b,c, H. Bendaly
a, H. Sidhom
d,
A. Tcharkhtchi
b, J. Fitoussi
baUniversity of Sousse, Ecole Nationale d’Ingénieurs de Sousse, LMS, Pôle technologique, 4054 Sousse, Tunisia bArts et Métiers ParisTech, PIMM– UMR CNRS 8006, 151 Boulevard de l’Hôpital, 75013 Paris, France cInstitut Clément Ader, UMR CNRS 5312, University of Toulouse, Toulouse, France
dUniversity of Tunis, ENSIT- Ecole Nationale Supérieure d'Ingénieurs de Tunis, LMMP, Av. Taha Hussein 1008, Tunisia
Keywords: SMC Fatigue
Young’s modulus evolutions Model
Fiber-matrix interface debonding
A B S T R A C T
In this paper, a multi-scale approach is proposed to predict the stiffness reduction of a Sheet-Molding-Compound (SMC) composite submitted to low cycle fatigue (until 2.105cycles). Strain-controlled tensile fatigue tests (R = 0.1) are carried out at various strain ranges. Damage is investigated at both macroscopic and microscopic scales through the evolutions of Young’s modulus and SEM observations, after interrupted fatigue tests at dif-ferent lifetime periods. The results show that the fatigue degradation of the composite is mainly controlled by fiber-matrix interface debonding. A quantitative analysis allows determining the threshold and kinetics of the matrix interface damage during cyclic loading as a function of the orientation of fibers. Moreover, a fiber-matrix interface damage criterion, taking into account the local cyclic normal and shear stresses at the interface, is introduced in the Mori and Tanaka approach in order to predict the loss of stiffness. The parameters of this local criterion are identified by reverse engineering on the basis of the experimental results described above. Finally, the predicted loss of stiffness is very consistent with the experimental results.
1. Introduction
Composite materials are becoming increasingly attractive because of their ease of fabrication, relatively low cost, low density and good mechanical properties compared to their weight[1–6]. To design dis-continuousfiber composite structures, it is imperative to predict their behavior as a function of microstructure and damage. Indeed, as da-mage affects the performance of polymers and the structures of com-posites, the comprehensive description, detection and prediction of local damage mechanismsare scientifically and industrially important and valuable [7]. However, local damage mechanisms occurring in discontinuousfiber reinforced composites at the local scale are multiple and complex and need substantial experimental investigation to be described properly. Different damage modes can be activated simulta-neously, involving complex coupling. Thus, the prediction of the threshold and kinetics of damage becomes a difficult task.
Moreover, the most critical degradation of discontinuousfiber re-inforced composite structures has been observed for fatigue and impact loading [7]. Applying cyclic loading generally results in progressive damage accumulation related to the degradation of macroscopic me-chanical properties such as stiffness reduction[8,9]. Fatigue damage can be described by nucleation, propagation, coalescence or/and stable growth of cracks, which leads to thefinal failure of the material[10]. For continuousfiber reinforced composites such as laminates, fa-tigue damage should be described by the progressive accumulation of transverse fatigue cracks observed at the transverse fiber interfaces
[11]. In that case,final failure occurs when delamination between two adjacent plies takes place together withfiber breakage in different or-ientations [10]. For unidirectional composite fatigue, two dominant stages involving an initially high but decreasing damage rate followed by a slowly increasing rate have been observed[12].
On the other hand, for discontinuousfiber reinforced polymers, a lot
T
of studies have revealed that thefiber-matrix interface failure can be defined as the predominant local damage mechanism [13–22]. The experimental analysis has revealed that local damage generally begins by debonding the most misorientedfibers when the local normal stress reaches a critical value. Then, it progressively propagates to less mis-oriented fibers by coupling normal and shear interface stresses[15]. Under tension, damage initiation is generally observed for 20% to 30% of the failure stress[14–22]. For shortfiber reinforced thermoplastic, the ductility of the matrix around the fibers leads to diffuse micro-cracking. Some researchers talked about a damaged interphase zone
[5,7]. In this study, the fatigue damage of Sheet Molding Compounds (SMCs) is investigated. SMCs present a high strength-to-weight ratio and a high capacity of energy absorption during impact[14–22]. They are composed of glass fibers, unsaturated polyester, phenolic, vinyl, acrylic or modified resins to generally produce a strong molding com-pound[14–22]. We present in this paper microscopic-macroscopic re-lationships, while considering damage, and we propose a predictive approach of fatigue stiffness reduction.
First, an experimental multiscale analysis of damage under tension cyclic loading is presented. A quantitative analysis allows emphasizing the threshold and kinetics of fiber-matrix interface debonding as a function of thefiber orientation. Second, the experimental results are used to identify a fatigue micromechanical model in order to predict the macroscopic stiffness reduction of a discontinuous randomly oriented fiber reinforced polyester, noted hereafter as SMC R42.
Local damage is introduced in a Mori and Tanaka approach through a probabilistic Weibull’s form an interface failure criterion to consider the statistical aspects of local failure. Moreover, the cyclic loading effect is introduced by a progressive modification of the fiber-interface strength related to local cyclic loading. The experimental quantitative local analysis is then used to identify the evolution of the interfacial strength during fatigue by reverse engineering. Therefore, the sug-gested model is an extension of the Jendli[23]model, originally de-veloped for monotonic loading to cyclic damage.
The main objective of this work is to describe the fatigue stiffness reduction of SMC composites. The experimental and numerical work presented here is limited to low cycle fatigue: between 103 to 2.105 cycles to failure. InSection 2, the material characteristics and experi-mental procedures are presented.Section 3is devoted to the description of the damage micromechanical model. The general approach and the main constitutive equations are also described. InSection 4the algo-rithm and numerical implementation of the fatigue local criterion are shown. The identification and main equations are described inSection 5. Finally, a comparison between the experimental results and the nu-merical simulation are presented and discussed.
2. Materials and experimental methods
An SMC composite consists of an unsaturated polyester resin re-inforced with glassfibers and is highly filled with calcium carbonate fillers (CaCO3). The weight content of glassfibers is of 42%. Such fibers are presented in the form of bundles, and each bundle contains about 200 fibers. These fibers have a length of 25 mm with a diameter of about 15 µm.
2.1. Microstructure analysis
SMC plates are provided by the Plastic Omnium company auto ex-terior services from which samples are cut following the dimensions shown inFig. 1.
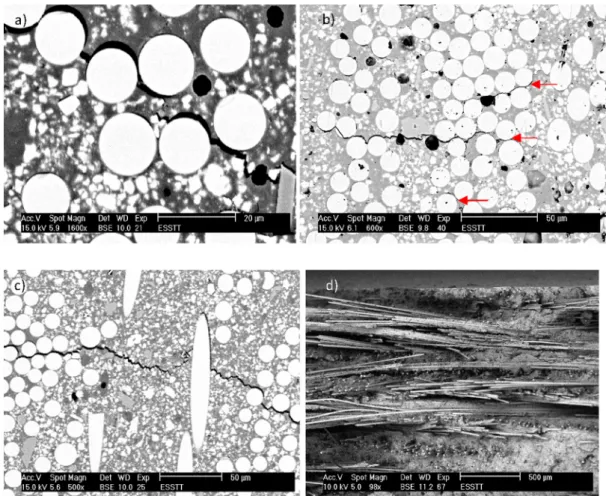
Scanning Electron Microscopy (SEM) is performed to reveal the microstructure of SMCs (Fig. 2). This micrograph highlights a randomly oriented distribution of bundles offibers where the ellipticity of the fibers is directly related to their orientation. The presence of CaCO3 particles and porosity in the matrix is also noticeable.
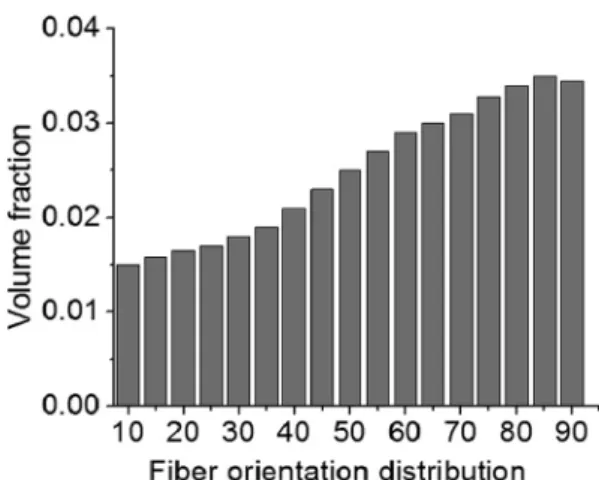
A quantitative study of the fiber orientation distribution is
performed by the SEM image analysis through the determination of the ellipticity of thefibers appearing on the polished surface. The following simple geometric relation allows determining the in-plane orientation of afiber inside a bundle: θ = arc sin (a/b), where “a” and “b” are respectively the short and long axes of the ellipse. Once the orientation of afiber family (θ) is determined, the quantification of the fiber vo-lume fraction of this family, f(θ), is given by Eq.(1) [16]:
= = f θ n n s S n f θ s θ S ( ) θ. B. θ. m( ). ( ) (1) wherenθ is the number of bundles oriented atθ,nB is the number of
fibers in a bundle, s is the surface of an ellipse of θ,Sis the total surface, fm( )θ is the volume fraction offibers in the bundle oriented at θ, and s θ( )is the surface of a bundle (widely described and calculated in[16]).
Fig. 3shows the obtained distribution of the orientation of the SMC in study. The orientation of thefibers is predominant due to material flow during thermocompression.
2.2. Mechanical behavior and damage analysis methodology
Monotonic and cyclic tensile tests are performed on samples de-scribed inFig. 1. Longitudinal and transverse strain gages are placed on the specimen surface. Maximum care was taken during the collage of the gages and false tests were not retained. Tensile tests are performed at a constant displacement rate of 5 mm/min. Tensile fatigue tests are conducted for three imposed maximum strains:
ε = 0.50%; ε = 0.64%; ε = 0.8% with a loading rate of R = 0.1 and
Fig. 1. (a) Specimen dimensions for tensile and fatigue tests, (b) Elliptic form of fiber appearing at surface.
a frequency of 5 Hz. Three specimens are tested for each condition. The Young’s modulus is measured during cyclic loading in order to de-termine the progressive loss of stiffness though the evolution of the relative Young’s modulus: E
E1 whereE is the Young’s modulus during cyclic loading andE1is the original Young’s modulus measured at the
first cycle.
Moreover, interrupted fatigue tests are performed in order to characterize the evolution of the damage mechanisms occurring at the local scale during cyclic loading. A representative observation area was previously marked on the SEM observation surface and analyzed qua-litatively and quantitatively after each interruption. The observation area is chosen to be large enough (5 × 2.4 mm2) to be statistically representative of the average microstructure in terms offiber content and distribution of orientation (shown inFig. 3).
In the next sections, we present a qualitative and quantitative analysis of the local damage due to cyclic loading. Finally, the macro-scopic loss of stiffness is related to the local damage state evolution. 2.3. Qualitative analysis of local damage mechanisms during fatigue loading
The fatigue damage of composite materials generally goes through two stages: initiation and propagation. SEM micrographic investiga-tions are carried out on the marked area, as described above, for all imposed deformations, and crack initiation at the fiber/matrix inter-faces (Fig. 3) appears. Fiber-matrix interfaces present relatively low mechanical strength and are consequently transformed into preferential sites for micro-cracking. Under tension loading, such microcracks are generally perpendicular to the loading direction. Besides, this me-chanism is known as predominant in SMC composites[14–23]. As in
monotonic loading,fiber-matrix interface debonding always begins at the most disorientedfibers versus loading direction (Fig. 4a), and it progressively develops in all directions of reinforcement (Fig. 4b).
After the stage of initiation described above, interfacial microcracks coming from adjacentfibers merge into one larger microcrack (Fig. 5a). At this stage, each bundle may contain several perpendicular crossing microcracks (Fig. 5b). Then, decohesion spreads through the matrix, always in a direction almost perpendicular to the tensile direction, in order to join other microcracks coming from otherfiber-matrix inter-face debonding (Fig. 5c). Coalescence leads to relatively long cracks compared to thefiber diameter. Finally, as observed by Shirinbayan et al.[21]for monotonic loading, the coalescence of these large mi-crocracks leads to thefinal failure by the pseudo-delamination between bundles (Fig. 5d).
2.4. Quantitative analysis of local damage mechanisms during fatigue loading
Quantitatively relating the evolution of the crack densities at the local scale to the residual macroscopic properties of the composite during cyclic loading is of particular interest to build an accurate mi-cromechanical model. This is the aim of this section.
As thefiber-matrix interface appears to be a weak point of the composite, special attention has been paid to fiber-matrix interface debonding. In need of simplification, the number of orientation families represented inFig. 3is reduced to six: 10°, 30°, 45°, 60°, 80°and 90°. Each bundle offibers within the observation area is mapped and as-signed to one of these six orientation families. Since every bundle was originally cut from the same roving, each bundle contains the same number offibers, that isnB=200. After each fatigue test interruption, SEM observations are performed in order to determine the number of debondedfibers inside each bundle. Therefore, it is possible to define a local interface damage indicator for each fiber family of orientation during fatigue as: =
∗ d Nθ( ) n n n dθ B θ
where ndθis the total number offibers presenting a broken interface
contained inside the total number of bundles presenting the considered orientation θ (beingnθ), and N is the number of applied cycles. The
evolutions of this interfacial damage indicator as a function of the number of cycles, for three values of the maximal imposed deforma-tions (ε = 0.50%; ε = 0.64%; ε = 0.8%), are reported inFig. 6.
Independently of the imposed fatigue strain, the obtained results quantitatively confirm that the largest and fastest local damage is as-sociated to the most disorientedfibers versus the loading axis (θ = 90°). Indeed, independently of the imposed maximum strain, nearly 80% of thefibers oriented perpendicularly to the loading axis are submitted to debonding. Slightly disorientedfibers (θ = 10–15°) contribute to da-mage only after an incubation period varying between 104 and 105
Fig. 3. Fiber orientation distribution in matrix of SMC R42 composite.
cycles and depending on the imposed maximum strain (Fig. 6). A great influence of the loading condition on the threshold and kinetics of damage can be noted. Indeed, the increase in fiber-matrix interface damage is more severe when the imposed maximum deformation is greater.
As already noted, to simplify the experimental work, only six fa-milies of the fiber orientation are analyzed. However, for micro-mechanical modeling purposes, it is important to get a precise de-scription of the crack density evolutions for other intermediate orientations. For this, we can describe the evolution of the interfacial crack densities according to the number of cycles by the following form:
= −
dθN A ln Nθ ( ) Bθ (2)
where AθandBθare material parameters identified by fitting the curves
ofFig. 5for each θ orientation, and N indicates the number of cycles. Therefore, threshold values can be derived by:
=
( )
Nthθ exp
B A
θ
θ . InSection 4.2, the identified values of AθandBθfor
= °
θ 90andθ=45°will be used for the identification of the local cyclic
fiber-matrix interface failure criterion. 3. Micromechanical modeling
The selection of a suitable model is mainly linked to the composite architecture. Thus, it is essential to consider the volume fractions of reinforcements, their size and the material symmetries. All the pre-sented models adopt the Eshelby’s equivalent inclusion method, except for the Voigt and Reuss bounds. Therefore, the reinforcement of ellip-soidal geometry is analytically taken into account. This geometry is characterized by the ratio l/d, where l and d are respectively the length and diameter of reinforcement. Accordingly, we can distinguish several
forms: Longfibers if (l/d) tends to infinity.
•
Shortfibers if 10 < (l/d) < 50.•
Particle if 1 < (l/d) < 5.•
Disk if (l/d) tends to 0.To choose the model that will give the best estimate of effective properties, the morphology of the material must be considered. For example, the least descriptive approach is that of Voigt or Reuss. Their simplicity is due to the fact that it takes into account only very few microstructural parameters. Indeed, it is only used when access to mi-crostructural information is restricted. For instance, spatial distribution, orientation of reinforcement and its shapes are not opted for in this type of model. Only the elasticity tensors and volume ratios of each phase are used. Furthermore, the Hashin and Shtrikman model is limited to a few forms of reinforcement (long fibers, small disks, spherical re-inforcement). In addition, bounded models, Voigt and Reuss or those of Hashin and Shtrikman, only provide a framework for the effective characteristics. Homogenization in a dilute solution is restricted to low volume ratios of reinforcement, which does not allow the consideration of different reinforcement interactions[24].
Among the different estimates, the self-consistent and Mori and Tanaka approaches have a larger scope given their ability to estimate the properties of materials with relatively big reinforcement ratios.
The material of our study has a volume fraction lower than 30%. This points us to the Mori and Tanaka model which is more suitable for such a reinforcement rate. Moreover, this model has the advantage of separately seeing a continuous matrix phase in which reinforcement is directly embedded, unlike the self-consistent approach which does not distinguish the phases in-between.
Fig. 5. Microcracks spreading under cyclic loading; (a) from onefiber to its neighbors; (b) multi-cracking of bundles; (b) and (c) from one bundle to its neighbors; (d) final failure by pseudo-delamination between bundles.
Besides, this model has the advantage of analytical resolution, un-like the self-consistent model. In view of these elements, we consider that the Mori and Tanaka model is the most appropriate and will be retained for the rest of this study.
3.1. Basic equations
The micromechanical multi-scale modeling is based on the Mori and Tanaka approach [15]. Several authors, such as Fitoussi et al.
[18,25,26], and Jendli et al.[23], have proposed to introduce damage into this approach through the identification of local damage criteria. Indeed, basic equations allow computing composite stiffness and average stressfields in different phases. Fiber-matrix interface stresses can be easily derived, as detailed hereafter. The matrix and thefibers are considered isotropic.
The composite stiffness tensor is given by the following expression:
Q Q
= + 〈 〉 + 〈 − 〉− −
CComp Cm[I f (I f (S I) ) ]1 1 (3)
where〈 〉Q denotes the average,Cmand S are respectively the stiffness
tensor of the matrix and the Eshelby tensor[17], and Q is a pseudo-localization tensor defined for each family of fiber orientation “θ” as: Q =θ ((Cm−Cθ)(Sθ−I)−Cθ) (−1Cθ−Cm) (4)
whereCθrepresents the stiffness tensors of the reinforcement oriented
atθ°(seeFig. 7). Note that for SMC composites, we can consider that all
thefibers are contained in the plane of the plate. Therefore, each family of reinforcement is characterized only by its orientation in plane θ.
The aforementioned theory leads also to the expression of the local stress tensor in reinforcement as follows
Q Q
= + − + 〈 − 〉
σθ Cm(I (Sθ I) θ)(I f (S I) )εimp (5)
Using the continuity condition of the normal stress at the interface, the average stress in the“θ” fiber family is used to compute the normal and shear interfacial stresses, σnandτ respectively, at each point
lo-cated at thefiber-matrix interface (defined byφ,seeFig. 7).
Note that the interfacial stresses, σnandτ, can be computed on each
interfacial point defined by angleφ, as illustrated inFig. 10. 3.2. Local damage modeling
Therefore, we can define an interfacial failure probability compu-table at each fiber-matrix interface point defined by the fiber
Fig. 6. Evolution of interfacial micro-cracking during fatigue tests for different fiber orientations and applied macroscopic strains; ε = 0.50%, ε = 0.64%, ε = 0.8%.
orientationsθ andφ(seeFig. 7): ⎜⎜ ⎟ ⎜ ⎟⎟ = − ⎛ ⎝ ⎜−⎛ ⎝ ⎛ ⎝ ⎞ ⎠ + ⎛ ⎝ ⎞ ⎠ ⎞ ⎠ ⎞ ⎠ ⎟ P θ φ exp σ σ τ τ ( , ) 1 r m 0 2 0 2 (6) where m is a statistical parameter related to the microstructure scatter. Normal and shear stresses σnandτdepend on the macroscopic applied
stress, aspect ratio, volume fraction and orientation of the considered fibers and the elastic properties of the matrix and the fibers.
A given damaged state can be defined as a microstructure con-taining:
(1) Activefibers (noted fnact) contributing to the composite
reinforce-ment and including two populations: the undamagedfibers (noted
fnnd) and a part of the damaged ones, which partially help in
com-posite reinforcement. Their contribution is defined by a reduction coefficient, “k”, applied to the amount of debonded fibers (2) Micro-cracks to be introduced (noted fnmc).
Hence, at each calculation step, n, the determination of the local interface failure probabilities (Eq. (9)) allows the description of the local damage state by the following equations:
= − ∗ − fnnd (1 Prn) fn nd 1 (7)
∑
= + = − fnact f k P f. n nd i n ri i nd 1 1 (8) = − + − fnmc f h P. .f n mc rn n nd 1 1 (9)Note that the reduction parameter“k” has been evaluated by finite element calculations performed on a representative cell containing a partially debondedfiber and which is equal to 0.5. Actually, “h” is the ratio between the volume of the introduced zero stiffness penny shape (representing an interfacial micro-crack) and the fiber volume eval-uated by geometric considerations.
3.3. Monotonic tensile loading simulation
A tensile test is performed and simulated using this formalism. The orientation distribution determined inSection 2.1issued as input data. At each increment of deformation, the interface failure probability is computed for eachfiber orientation family, and the three heterogeneity populations described above are evaluated in order to determine the corresponding damage state as well as associated macroscopic stiffness and stresses. Finally, stress-strain curves and relative stiffness losses are plotted. Fig. 8presents a comparison between the experimental and simulated results. For more details,[17,23]can be consulted.
Mostly, this simulation allowed the identification, by inverse
engineering, of thefiber-matrix interface strength defined by σ0and τ0.
Indeed, for monotonic loading simulation, contrary to fatigue modeling (next paragraph), interface strength values σ0and τ0 remain constant
during loading. Therefore, these values should be considered as the initial ones in fatigue simulation, as described in the next section. 4. Micromechanicalfiber-matrix interface cyclic damage modeling
4.1. Main idea
The experimental results obtained on SMC composites under fatigue loading show that a repeated applied stress leads to progressive diffuse damage offiber-matrix interfaces. Indeed, at a local scale, the interface (or interphase) zone is submitted to local cyclic loading. Every interface location is submitted to a specific cyclic variation in local normal and shear stresses (σ,τ). The local amplitude can be evaluated by Eqs.
(5)–(8). Thus, the local cyclic interfacial loading depends, among other factors, on the microstructure, the imposed macroscopic loading and the local orientation of the consideredfiber.
As a consequence, we can consider that the local interface-inter-phase stresses (σ,τ) undergone cyclically by the interface zone may modify the limit stresses (σ0, τ0) as a result of two local phenomena:
(a) The local strain hardening of the polymer zone located on and just around thefiber (including sizing)
(b) The redistribution of the local stresses due to the diffused damage on the other interfacial sites
Thefirst phenomenon is well known for glassy polymers, but it may also be observed for thermosets under several conditions such as con-fined cyclic loading and local self-heating[19,20]. It is generally as-sociated to the reinforcement of the mechanical response resulting from large deformation up to the yield stress and macromolecular re-arrangement. It may be influenced by intrinsic factors like the mole-cular structure, the cohesion energy, the molemole-cular weight and the morphology. The morphological aspect is frequently one of the most important factors. On the other hand, strain hardening is also strongly influenced by extrinsic factors such as the temperature, the stress am-plitude and the strain rate[27]. For confined cyclic loading like that
imposed tofiber-matrix interface zones during fatigue loading, strain hardening may highly increase[28]. The result is a local rise in the yield and failure stresses or the strain of the interface-interphase, which leads to an apparent growth of thefiber-matrix strength.
Moreover, the experimental results shown previously emphasize a diffusive nature of the local damage in SMC composites. In other words, when an interface breaks, the local stress is systematically redistributed on other undamaged locations. Consequently, the average interfacial stresses of the undamagedfibers progressively increase during fatigue damage, which goes with an amplification of interface-interphase ma-terial strain hardening.
Therefore, in order to take into account the local effect of cyclic loading on the fiber-matrix interface apparent resistance, we may consider that the associated local failure criterion requires a progressive increase in the interfacial strength parametersσ0andτ0. This evolution should be relative to:
(a) The local interfacial stress amplitudesσ and τ (b) The number of applied cycles N
4.2. Fatigue damage prediction procedure
Since the evolution of the interfacial strength parameters are iden-tified, we may use the micromechanical damage model presented above to predict fatigue damage. To this end, we propose an algorithm shown in Fig. 9: The input data include the elastic characteristics of the
different phases, the fiber orientation distribution (Fig. 3), the initial interfacial strength parametersσ0andτ0(identified inSection 3.3), the imposed macroscopic cyclic strainεimp, and the current number of
im-posed cycles N .
Interfacial stressfields σ θ φ τ θ φN( , ), N( , )may be calculated for each fiber-matrix interface location θ φ( , ). Thus, the maximum value of the interfacial failure probability can be determined for each fiber or-ientation in order to compute the new corresponding volume fractions
of thefibers remaining undamaged. At the same time, the density dis-tributions of activefibers (still contributing to the composite stiffness) and interfacial microcracks are computed. Hence, a first step homo-genization, including activefibers only, is performed. Then, second-step homogenization allows determining the whole damaged composite, including activefibers and fiber-matrix interface micro-cracks for the considered number of cycles and the imposed macroscopic strain. After incrementation, a new value of the applied number of cycles is defined, and this procedure is repeated.
4.3. Fiber-matrix interface cyclic damage criterion identification
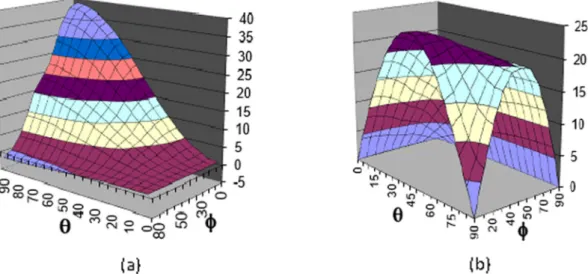
Based on the above algorithm, we propose to identify the evolutions ofσ0andτ0as a function ofσ, τ and N. Accordingly, we analyze the local interfacial stress state under tensile fatigue loading.Fig. 10 il-lustrates the evolution of the normal (Fig. 9a)) and shear (Fig. 9b)) stresses computed using the Mori and Tanaka model for a tensile stress of 1 MPa magnitude applied to the SMC composite in study. It can be easily observed that the maximum values of the normal and shear stresses are observed forθ=90°, φ=0 and° θ=45°,φ=0 , respec-°
tively.
Thus, we suggest a two-step identification procedure using the re-verse engineering method based on the above algorithm and the density evolutions of the interfacial cracks determined experimentally for
= °
θ 90 andθ=45°populations offibers.
Thefirst step is assigned to the identification of the evolution of σ0 on the basis of the density evolution of the interfacial cracks determined experimentally for the most disorientedfibers(θ=90 ). Indeed, in ac-°
cordance with the stressfields ofFig. 10, tensile damage always begins in this location. Moreover, the interface damage of 90° orientedfibers is the most intensive: Near final failure, more than 80° of these fibers show broken interfaces. It is noted that debonding is always observed at the interfacial point defined by =φ 0 (see° Fig. 4a)). At this point, =τ 0.
Therefore, for a givenfiber orientation, the corresponding fiber-matrix interface failure probability is given by:
⎜ ⎟ = − − ⎛ ⎝ ⎞ ⎠ σ σ PrθN 1 exp[ ( )] N 0N 2m (10)
Fig. 10. Distribution of normal (a) and shear (b) stresses for 1 MPa magnitude tensile loading.
Fig. 11. Comparison between experimental and simulated density evolutions of fiber-matrix interface microcracks for several orientations.
Furthermore, each N increment corresponds to a local damage in-crease: = − − ° ° ° Δd d d . 90 N 90 N 90 N 1
Then, the fiber-matrix interface failure probability can be also written as = − − − − ° ° ° ° Pr (N) d d 1 d 90 N 90 N 90 N 1 90 N 1 (11) Moreover, from Eq.(2), the probability can be rewritten as:
= ∗ − ∗ − + − ° ° ° ° Pr (N) A ln( ) 1 A ln(N 1) B 90 N 90 N N 1 90 90 (12)
Finally, the evolution of σ0is derived from Eqs. (13) and (15)as
follows: = − ° σ σ [ Ln(T )] 0N N 90 N (1) 2m (13) = − ∗ − ∗ − + − ° ° ° ° withT 1 A ln( ) 1 A ln(N 1) B 90 N 90 N N 1 90 90 (14)
Once the evolution ofσ0Nis identified, we may consider the
evolu-tion of the shear stress threshold τ0during fatigue loading. To this aim,
the experimental interfacial damage evolution offibers oriented at 45° should be considered in reverse engineering identification. Indeed, it may be observed that for thisfiber orientation, each interfacial location is submitted to both normal and shear stresses. Furthermore, since the
maximum shear is observed on the 45° orientedfiber interfaces, the local cyclic effect discussed inSection 4.1should be maximal for this orientation. Like theσ0Nidentification, theτ0Nevolution can be derived
from Eq.(2), Eq.(9)and Eq.(14)applied to the 45° orientedfibers: = ⎡ ⎣ ⎢ − − ⎛⎝ ⎞⎠ ⎤ ⎦ ⎥ °
( )
[
]
τ τ ln(T ) σ σ 0N N 45 N m1 N 2 0N 1 2 (15) = − ∗ − ∗ − + − ° ° ° ° with T 1 A ln( ) 1 A ln(N 1) B 45 N 45 N N 1 45 45 (16)Finally, identified σ0N andτ0N should be validated by comparing
between the density evolutions of predicted and experimental fiber-matrix microcracks during fatigue for other orientations (namely 10°, 30°, 65° and 80°). The good correlation depicted inFig. 11validates our approach.
4.4. Stiffness reduction prediction 4.4.1. Local criterion analysis
The main idea of our approach is to reflect fiber-matrix interface strain hardening during cyclic loading. Because this phenomenon arises at a local scale, this evolution should be independent of imposed macroscopic loading. Indeed, Eqs. (16)–(19) clearly convey that the interfacial strength evolution is related to local interfacial stresses (σN
and τN) which increase together with the applied number of cycles.
Since the local interfacial stress undergone at thefirst cycle depends on the macroscopic applied strain, it is judicious to plot the evolution of identified σN
0 and τ0N during fatigue as a function of σN−σ1 and
−
τN τ1, where σ1 and τ1are the first cycle fiber-matrix normal and
shear stresses, respectively.
Fig. 12shows these evolutions for three values of the macroscopic applied strain: 0.64%, 0.8% and 0.87% forθ = 0° and θ = 45°.
Therefore, as afirst approximation, one may propose a mathema-tical form to the evolutions of fiber-matrix interface failure criterion parameters during fatigue:
= ∗ − σN a exp((σN σ) )b 0 1 = ∗ − τN c exp((σN σ) )d 0 1
where a, b, c and d are material parameters to be identified. 4.4.2. Stiffness reduction prediction
Fatigue tests performed at several values of the imposed macro-scopic strain allow plotting the evolution of the stiffness reduction during cyclic loading. Fig. 13illustrates the comparison between si-mulated stiffness reduction and experimental stiffness decrease for the three imposed strain levels (0.64%, 0.8% and 0.87%).The predicted Young’s modulus reduction agrees well with the experimental ob-servations.
5. Conclusion
The dominant damage mechanism of SMC materials is interfacial decohesion. Under fatigue loading, it leads to the degradation of the mechanical properties, i.e. progressive reduction in stiffness. A for-mulation of a micromechanical damage constitutive model is presented to predict stiffness reduction as a function of the number of fatigue cycles and the local stress state. This model is based on a quadratic interfacial criterion expressed in terms of normal and shear local stresses at thefiber-matrix interface associated to their corresponding failure values. In order to reflect the effect of repeated loading at a fiber-matrix interface scale, the local normal and shear failure stresses should progressively increase in order to take into account the coupled effect of the local stress redistribution caused by damage and strain hardening of polymers located at the interface zone.
Therefore, this work principally aims to identify the mathematical form of the evolution of the proposed fiber-matrix interface failure criterion parameters during fatigue. To this end, an original inverse engineering methodology is proposed based on an accurate and com-plete experimental description of the interfacial damage, coupled to a micromechanical predictive damage model adapted to cyclic loading. It is shown that the identified local fatigue damage criterion can be simply represented by an exponential increasing shape as a function of the gap between the current local stresses (i.e. for the considered number of cycles) and the local stresses undergone during thefirst applied cycle. This expression should be considered as a representative of the fiber-matrix strain hardening fatigue effect in short fiber reinforced compo-sites. Thus, the identification of the criterion should be based on a simple reverse engineering using only macroscopic stiffness reduction during tensile fatigue. Hence, there is no more need to perform a complete local damage experimental analysis.
Moreover, it should be mentioned that this criterion is independent of the macroscopic tridimensional applied loading, as a consequence of its local nature. Therefore, it may be identified on the basis of simple tensile cyclic loading results and be applied to a real structure design for anisotropic stiffness reduction prediction.
At the end of the paper, the proposed approach is validated through a comparison between experimental and simulated losses of stiffness for several values of a maximal imposed strain.
Declaration of Competing Interest
The authors declare that they have no known competingfinancial
interests or personal relationships that could have appeared to influ-ence the work reported in this paper.
References
[1] Feuillade A, Bergeret V, Quantin A, Crespy J. Characterisation of glassfibres used in automotive industry for SMC body panels. Compos. Part A Appl. Sci. Manuf. 2006;37(10):1536–44.
[2] Shirinbayan M, Fitoussi J, Abbasnezhad N, Meraghni F, Surowiec B, Tcharkhtchi A. Mechanical characterization of a Low Density Sheet Molding Compound (LD-SMC): Multi-scale damage analysis and strain rate effect. Compos B Eng 2017;131:8–20. https://doi.org/10.1016/j.compositesb:2017.08.004.
[3] Oldenbo M, Fernberg SP, Berglund LA. Mechanical behaviour of SMC composites with toughening and low density additives. Compos. Part A Appl. Sci. Manuf. 2003;34(9):875–85.
[4] Palmer J, Savage L, Ghita OR, Evans KE. Sheet moulding compound (SMC) from carbonfibre recyclate. Compos. Part A: Appl. Sci. Manuf. 2010;41(9):1232–7. [5] Fotouh A, Wolodko JD, Lipsett MG. Fatigue of naturalfiber thermoplastic
compo-sites. Compos. PART B 2014;62:175–82.
[6] Chaturvedi SK, Sun CT, Sierakowski RL. Mechanical characterization of sheet molding compound composites. Polym. Compos. 1983;4(3):167–71.
[7] Naebe M, Abolhasani MM, Khayyam H, Amini A, Fox B. Crack damage in polymers and composites: A review. Polym. Rev. 2016;56(1):31–69.
[8] Van Paepegem W. Fatigue damage modelling of composite materials with the phenomenological residual stiffness approach. Fatigue Life Prediction of Composites and Composite Structures. Elsevier; 2010. p. 102–38.
[9] Mughrabi H. Assessment of fatigue damage on the basis of nonlinear compliance effects. Handbook of Materials Behavior Models. Elsevier; 2001. p. 622–32. [10] Socie DF, Marquis GB. Multiaxial fatigue. Compr. Struct. Integr. Cycl. Load. fatigue
2003;4:221–52.
[11] Quaresimin M, Ricotta M. 9 - Fatigue response and damage evolution in 2D textile composites BT - Fatigue of Textile Composites. Woodhead Publishing Series in Composites Science and Engineering. Woodhead Publishing; 2015. p. 193–221. [12] Plumtree A, Cain K. Fatigue damage accumulation in CFRP. High Perform. Struct.
Mater. IV 2008;I:275–83.
[13] Capela C, Costa JD, Ferreira JAM. Test conditions effect on the fracture toughness of hollow glass micro-spherefilled composites. Strain 2008;44(2):141–6.
[14] Jendli Z, Fitoussi J, Meraghni F, Baptiste D. Anisotropic strain rate effects on the fibre-matrix interface decohesion in sheet moulding compound composites. Compos. Sci. Technol. 2005;65(3–4):387–93.
[15] Jendli Z, Meraghni F, Fitoussi J, Baptiste D. Micromechanical analysis of strain rate effect on damage evolution in sheet molding compound composites. Compos. Part A Appl. Sci. Manuf. 2004;35(7–8):779–85.
[16] Tamboura S, Sidhom H, Baptiste D, Fitoussi J. Evaluation de la tenue en fatigue du composite SMC R42. Matér. Tech. 2001;89(3-4):3–11http://www.mattech-journal. org/10.1051/mattech/200189030003https://doi.org/10.1051/mattech/ 200189030003.
[17] Laribi MA, Tamboura S, Fitoussi J, Tié Bi R, Tcharkhtchi A, Ben Dali H. Fast fatigue life prediction of shortfiber reinforced composites using a new hybrid damage approach: application to SMC. Compos B Eng 2018;139:155–62https://linkinghub. elsevier.com/retrieve/pii/S1359836817320346https://doi.org/10.1016/j. compositesb:2017.11.063.
[18] Fitoussi J, Meraghni F, Jendli Z, Hug G, Baptiste D. Experimental methodology for high strain-rates tensile behaviour analysis of polymer matrix composites. Compos Sci Technol 2005;65:2174–88.
[19] Shirinbayan M, Fitoussi J, Meraghni F, Farzaneh S, Surowiec B, Tcharkhtchi A. Effect of a post-fatigue damage on the residual dynamic behavior of advanced-SMC composites. Appl. Compos. Mater. 2019:1–19.
[20] Shirinbayan M, Fitoussi J, Meraghni F, Laribi M, Surowiec B, Tcharkhtchi A. Coupled effect of loading frequency and amplitude on the fatigue behavior of Advanced Sheet Molding Compound (A-SMC). J. Reinf. Plast. Compos. 2017;36(4):271–82.
[21] Shirinbayan M, Fitoussi J, Bocquet M, Meraghni F, Surowiec B, Tcharkhtchi A. Multi-scale experimental investigation of the viscous nature of damage in Advanced Sheet Molding Compound (A-SMC) submitted to high strain rates. Compos. B Eng. 2017;115:3–17.
[22] Shirinbayan M, Fitoussi J, Meraghni F, Surowiec B, Bocquet M, Tcharkhtchi A. High strain rate visco-damageable behavior of Advanced Sheet Molding Compound (A-SMC) under tension. Compos. B Eng. 2015;82:30–41.
[23] Jendli Z, Meraghni F, Fitoussi J, Baptiste D. Multi-scales modeling of dynamic be-haviour for discontinuousfibre SMC composites. Compos. Sci. Technol. 2009;69:97–103.
[24] Baptiste D. Damage micromechanics modelling of discontinuous reinforced com-posites. Continuum Damage Mechanics of Materials and Structures. Elsevier Science Ltd; 2002.
[25] Fitoussi J, Guo G, Baptiste D. A statistical micromechanical model of anisotropic damage for smc composites. Compos. Sci. Technol. 1998;58(5):759–63. [26] Ayari H, Fitoussi J, Imaddahen A, Tamboura S, Shirinbayan M, Ben Dali H, et al.
Two hybrid approaches to fatigue modeling of Advanced-Sheet Molding Compounds (A-SMC) composite. Appl Compos Mater 2020.
[27] Robert SHOY, Robbins Mark O. Strain hardening of polymer glasses: effect of en-tanglement, density, temperature, and rate. J. Polym. Sci. Part B: Polym. Phys. 2006;44:3487–500.
[28] Jain A, Van Paepegem W, Verpoest I, Lomov SVSV. A statistical treatment of the loss of stiffness during cyclic loading for short fiber reinforced injection molded com-posites. Compos. Part B 2016;103:40–50.https://doi.org/10.1016/j.compositesb. 2016.08.002.