Science Arts & Métiers (SAM)
is an open access repository that collects the work of Arts et Métiers Institute of Technology researchers and makes it freely available over the web where possible.
This is an author-deposited version published in: https://sam.ensam.eu Handle ID: .http://hdl.handle.net/10985/15001
To cite this version :
Annie-Claude BAYEUL-LAINE, Patrick DUPONT, Antoine DAZIN, Gérard BOIS - A combined numerical/experimental analysis of the flow in the channel of the vaned diffuser of a radial flow pump - IOP Conference Series: Earth and Environmental Science - Vol. 240, p.072025 - 2019
IOP Conference Series: Earth and Environmental Science
PAPER • OPEN ACCESS
A combined numerical/experimental analysis of the flow in the channel of
the vaned diffuser of a radial flow pump
To cite this article: A C Bayeul-Lainé et al 2019 IOP Conf. Ser.: Earth Environ. Sci. 240 072025
29th IAHR Symposium on Hydraulic Machinery and Systems
IOP Conf. Series: Earth and Environmental Science 240 (2019) 072025
IOP Publishing doi:10.1088/1755-1315/240/7/072025
A combined numerical/experimental analysis of the flow in the
channel of the vaned diffuser of a radial flow pump
A C Bayeul-Lainé1*, P Dupont2, A Dazin1, G Bois1
Univ. Lille, CNRS, ONERA, 2Centrale Lille, 1Arts et Metiers ParisTech, FRE 2017,
Laboratoire de Mécanique des Fluides de Lille – Kampé de Fériet, F-5900, Lille, France
*Annie-claude.bayeul-laine@ensam.eu
Abstract. The realization and the validation of a simulation in fluid mechanics require an
in-depth expertise of the modelling process. However, how could the results be guaranteed if they were not accompanied by experimental measurements? On the other hand experimental measurements show some limitations. For example, PIV measurements are limited to certain viewing planes and rarely near the walls. Moreover, this type of results rarely represents instantaneous results but rather a temporal average of the flows over the measurement time. The use of measurement probes is an intrusive method that can modify the flow and which, as the previous method leads to a mean time result. The purpose of this paper is to analyse the experimental results of the SHF pump which have already been the subject of numerous publications by using the results of the CFD which were made with the computing code star CCM +. This paper includes the comparisons between calculations and measurements inside the diffuser which makes possible to comment on the usefulness and the validity of the stationary measurements despite the unsteady nature of the flow. The analysis highlights the influence of leak rates at the entrance of the diffuser and shows a significant influence of these leak rates on the creation of recirculation swirls that disturb the flow at the entrance of some diffuser channels.
1. Introduction
The purpose of the diffusers of centrifugal pumps is to convert the kinetic energy into static pressure by allowing a more gradual compression and, normally, less turbulent area for the liquid to reduce in velocity. The radial diffuser can be classified into two types: i-vaneless diffusers, ii-vaned diffusers. The present study deals with a vaned diffuser of a centrifugal pump model with a particular arrangement: pump is sucking air from atmospheric pressure and rejects it in open air without any volute.These kinds of diffusers are designed for a given flowrate, and consequently, far away from this design flowrates, the efficiency of the diffuser and of the pump can become critical. The present vaned diffuser has eight diffusing passages wherein the width of the diffusing passage is constant, which let us assume that the static pressure is constant along the axial direction. The cross-sectional area of the diffusing passage increases from the inlet radius to the outlet radius of the diffusing passage (figure 4). Experimental correlations have been widely used in order to design optimum channel diffuser passage geometries assuming steady and uniform inlet flow conditions as proposed by Runstadler [1] and Japikse [2]. For real pump configurations, overall diffuser performances must be analysed taking into account real inlet flow conditions including inlet angle distribution, blockage effects and leakages,
29th IAHR Symposium on Hydraulic Machinery and Systems
IOP Conf. Series: Earth and Environmental Science 240 (2019) 072025
IOP Publishing doi:10.1088/1755-1315/240/7/072025
more generally unsteadiness. This work is an extended study starting since a long time in our laboratory concerning the SHF pump tested in air [3-15].
Flow behaviour in a radial machine is quite complex and is strongly depending on rotor stator interactions, operating conditions and leakage flow rates [16-18]. In the presence of a gap, a leakage flow appears due to the difference of static pressure at the clearance between the shroud and the outer casing and between the hub and the outer casing. Previous experimental results (Wuibaut [4, 5]) and numerical ones (Cavazzini [6-8]) concerning the pump model used in the present study, have shown that the jet-wake structure was an unsteady one as expected. Because of the leading edge shape of the vaned diffuser combined with the rather small value of the vaneless radius ratio (R3/R2=1.068) of the
pump model, non-uniform flow structures are present and rather strong as shown by Si et al. [9]. A deeper analysis from Bayeul-Lainé et al [10-13] and from Dupont et al [14] has also shown that unusual leakage effects occur in the present experimental model. These leakages have a non-negligible effect on the diffuser performances.
In the present paper, only velocity fields at the inlet and inside the diffuser are compared between experimental and numerical results for five flowrates. It has been shown in [13] that the global results (non-dimensional total impeller head, non-dimensional total pump head and efficiencies) are in a very good agreement between experimental and numerical results if the leakages are taken into account. It has also been demonstrated that for the pressure recovery, the numerical results obtained with leakages have given results in good agreement with experimental results considering that the three holes probe’s method is an intrusive method. It is confirmed that, for low flowrates, leakage effects cannot be neglected. To do so, in the present paper, more detailed comparisons are performed between experimental and numerical results. It is confirmed that, for low flowrates, leakage effects cannot be neglected. The present paper is devoted to additional detailed comparisons between experimental and numerical results on unsteady flow velocity fields inside the diffuser passage from inlet throat to outlet section.
2. Experimentation 2.1. Test and apparatus
Figure 1. Test rig (Morel [3]). Figure 2. Apparatus: three-hole probe. Inlet pressure measurement
Shroud Hub Impeller Probe station Diffuser Inlet tank Diaphragm Filter Inlet nozzle Inlet pipe Casing Impeller, diffuser Belt Motor Axis
29th IAHR Symposium on Hydraulic Machinery and Systems
IOP Conf. Series: Earth and Environmental Science 240 (2019) 072025
IOP Publishing doi:10.1088/1755-1315/240/7/072025
Table 1. Pump characteristics.
Impeller Diffuser
Inlet radius R1 = 0.14113 m Inlet shroud radius R3’ = 0.258 m
Outlet blade radius Outlet shroud radius
R2 = 0.2566 m
R2’ = 0.257 m
Blade leading edge radius Blade trailing edge radius
R3 = 0.2736 m
R4 = 0.3978 m
Number of blades Zi= 7 Number of vanes Zd= 8
Outlet height B2 = 0.0384 m Height B = 0.04 m
Impeller design flowrate Qi = 0.337m3/s Diffuser design flowrate Qd= 0.8Qi
Rotational speed N = 1710 rpm
The test model corresponds to the SHF pump, working with air, in similarity conditions (in term of Reynolds number) compared to water, for which several studies have been made (Cavazzini et al [6-7]) involving numerical and PIV comparisons. This diffuser was designed for a lower flow rate compared with the impeller one, for a specific aerospace application. A sketch and an picture of the test rig are available in figure 1 and 2.The existing database has been completed by pressure probe measurements for a complete performance analysis in the vaned diffuser part of the pump model. The test ring used for the three-hole probe measurements (figure 2) was the same as the one already used for the PIV measurement already described in the previous papers, especially in reference [6]. Test pump model and PIV measurements conditions have been already described in several papers [4-8] and main pump characteristics are given in Table 1.
2.2. PIV measurements
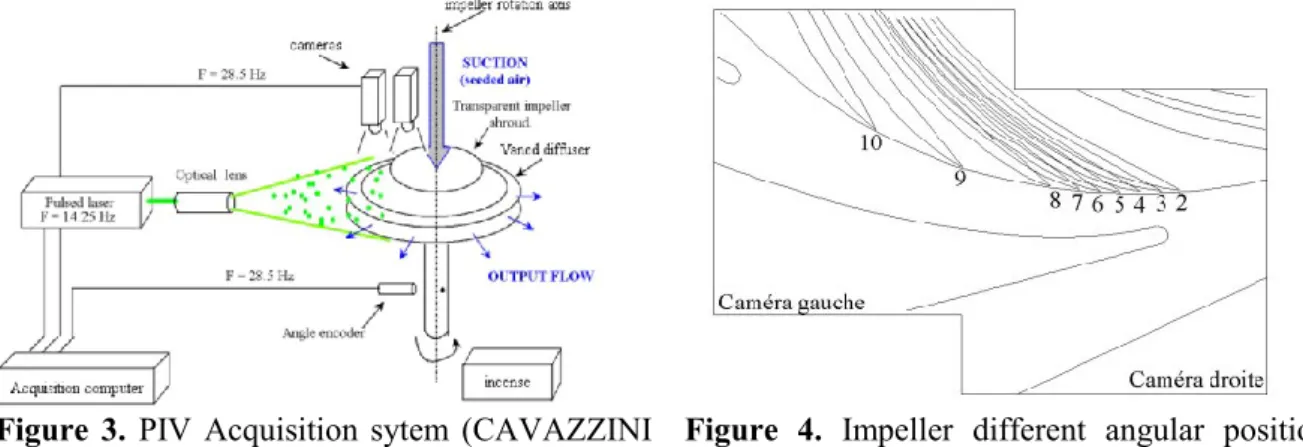
PIV measurements have been performed at different hub to shroud planes inside one diffuser channel passage for a given speed of rotation of 1710 rpm and various flowrates. PIV snapshots were simultaneously taken by two cameras positioned side by side and two single exposure frames were taken by each camera every two complete revolutions of the impeller (figure 3). For each operating condition, the PIV measurements have been trigged with different angular impeller positions (figure 4). For each angular position, four hundred instantaneous velocities charts have been obtained, covering the space between inlet and outlet diffuser throats. This makes a rather good evaluation of phase averaged velocity charts possible. The PIV results are extracted from Cavazzini [6]. In order to do comparisons with the other methods, for each probe position (see paragraph 2.3 and figure 5), mean values of the radial and axial velocities inside the diffuser were calculated over the four hundred instantaneous maps available for each of the seven angular positions.
Figure 3. PIV Acquisition sytem (CAVAZZINI
[6]).
Figure 4. Impeller different angular positions
relative to the diffuser vanes.
2.3. Three-holes probe
A directional three holes probe (figure 6) has been used to make hub to shroud traverses [15]. Using a specific calibration one can get total pressure, static pressure, absolute velocity and its two components in radial and tangential direction.
29th IAHR Symposium on Hydraulic Machinery and Systems
IOP Conf. Series: Earth and Environmental Science 240 (2019) 072025
IOP Publishing doi:10.1088/1755-1315/240/7/072025
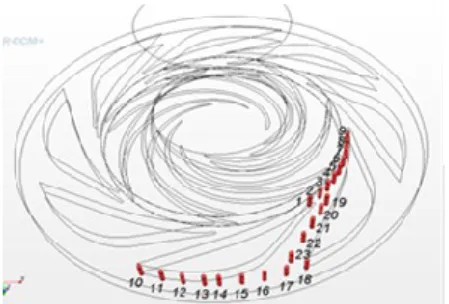
Figure 5. Probe’s locations. Figure 6. Sketch of the three-holes pressure
probe.
Twenty-three probe locations are defined as it can be seen in figure 5. For each location, ten axial positions are registered (b*=0.125, 0.2, 0.25, 0.375, 0.5, 0.625, 0.75, 0.875, 0.925, 0.975 from hub to shroud). The probe (figure 6) is entering inside the diffuser on the shroud side. So it is possible to make measurement close to the wall on the shroud side (b*=0.975), but not on the hub side because of the probe geometry (b*=0.125). The present analysis focuses on locations 1 to 9 at the inlet of the diffuser and on locations 19 to 23 along the blade to blade diffuser channel. The probe results are extracted from Cherdieu [15].
3. Calculations
Figure 7. Cut planes of regions modelled: details of fluid leakages’ positions.
The numerical simulations were realized with Star CCM+ 11.06 code (RANS frozen rotor and URANS unsteady calculations). Due to the specific model set-up, the effects of fluid leakage in the gap between the rotating and fixed part of the pump model are unusual and have been analysed and discussed (Bayeul-Lainé et al [11]). Two sources of fluid leakage occur: i-the first one at the impeller inlet (leakage 1, figure 7, axial clearance = 1mm), ii-the second one between the impeller outlet and the diffuser inlet both for the hub and the shroud sides (leakages 2 and 3, figure 7, radial clearance = 1mm). To simulate the fluid leakage flows, a complete meshing has been set up including the real geometry of the gaps and external domain far upstream the labyrinth. In this respect, boundary conditions include the rotating and the fixed parts of the model casings (figure 7).
The calculation domain is divided into four domains as can be seen in figure 7: inlet domain (blue), impeller domain (grey), diffuser domain (braun), outside domain (green).
As thickness gaps are small (1 mm), a thin meshing model has been chosen. A thin meshing model allows thin regions in the geometry to have a prismatic type volume mesh. Using this kind of mesh
Leakage 1 Leakage 2 Impeller domain Diffuser domain Hub shroud Leakage 3 Outside domain Inlet domain Q*<1 Q*>1
29th IAHR Symposium on Hydraulic Machinery and Systems
IOP Conf. Series: Earth and Environmental Science 240 (2019) 072025
IOP Publishing doi:10.1088/1755-1315/240/7/072025
improves the overall cell quality and reduces the cell amount when compared to an equivalent polyhedral type core mesh. The number of layers in the thin mesh has been set to 10. In the other parts of the domain, a polyhedral mesh with prism layers is used for all calculations (5 prism layers for a total prism layer thickness of 1 mm). The target size is 3 mm and the minimum size 0.5 mm. The size of the grid is about 20 millions ofcells for all the four domains (figure 8). Concerning the model “without leakages”, only Inlet, Impeller and diffuser domains are taken into account. The final grid is about 10 millions of cells with the same parameters (base size, surface size, number and size of prism layers). The calculations were done on a tower workstation with Intel-Xeon processor, 12 cores and 64 Go RAM. The CPU time is about 3.107 s for the mesh of 10 million of cells and 7 impeller
revolutions. Three-dimensional incompressible Reynolds averaged Navier–Stokes equations are solved in steady (frozen rotor) and unsteady states. The SST k- turbulence model is used ([Bayeul-Lainé et al. [11], Menter [19]).
The boundary condition at the inlet consisted in a mass flowrate (Q1*=0.386; 0.584; 0.766; 0.973;
1.134). The boundary condition at the outlet was the atmospheric pressure (relative pressure=0 Pa). The boundaries of the outer casing of the impeller are considered as rotating walls. The fluid (air) was considered incompressible at a constant temperature of 20ºC.
For the unsteady calculations, the positions of the numerical probe are plotted in the blade to blade channel of the diffuser as can be seen in figure 4. On the contrary to the measurements, the domain of calculations isn’t limited by the size of the probe, so two addition axial locations are taken into account (b*=0.025 and b*=0.075, near the hub side).
The convergence criteria are less than 1.e-4. The values of y+ are below 15 in the whole computational domain. The influence of the size of mesh was already tested [12].
Figure 8. Cut planes of mesh with details in fluid leakages’ positions. 4. Results
All results are presented in several separated sets “x”, figures 9-1 to 13-5 for the five flowrates, for four different angular impeller positions and for different axial positions:
- Figures x-1 Non dimensional numerical radial velocities with leakages (3 axial positions) - Figures x-2 Non dimensional numerical radial velocities without leakages (2 axial positions) - Figures x-3 Non dimensional radial velocities for PIV measurements (3 axial positions) - Figures x-4 non dimensional axial velocities in the plane of numerical probes 20 to 23 from
29th IAHR Symposium on Hydraulic Machinery and Systems
IOP Conf. Series: Earth and Environmental Science 240 (2019) 072025
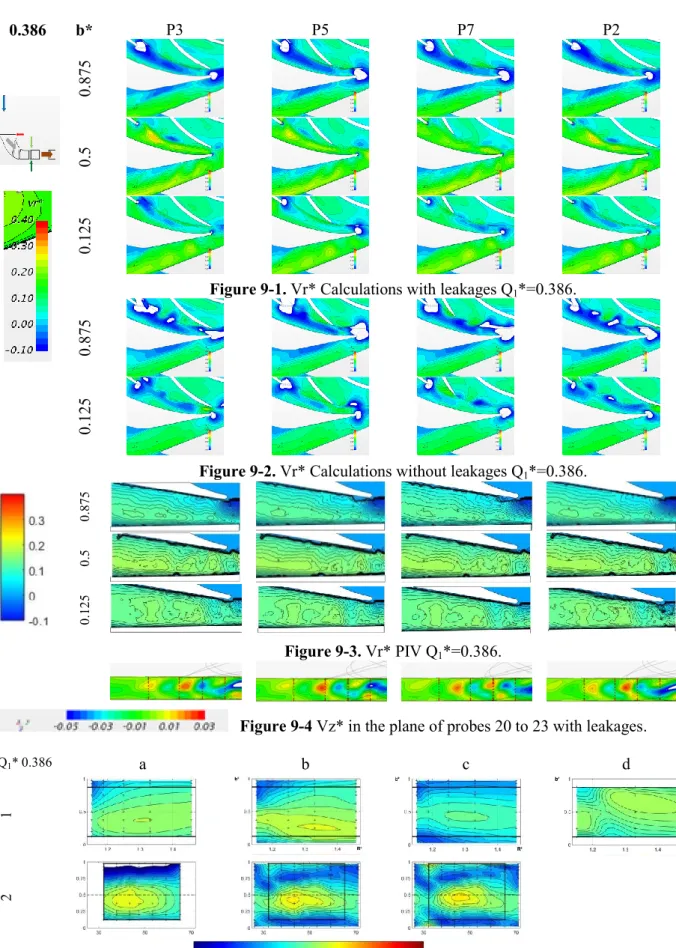
IOP Publishing doi:10.1088/1755-1315/240/7/072025 0.386 b* P3 P5 P7 P2 0.875 0.5 0.125
Figure 9-1. Vr* Calculations with leakages Q1*=0.386.
0.875
0.125
Figure 9-2. Vr* Calculations without leakages Q1*=0.386.
0. 87 5 0. 5 0. 12 5 Figure 9-3. Vr* PIV Q1*=0.386.
Figure 9-4 Vz* in the plane of probes 20 to 23 with leakages.
Q1* 0.386 a b c d
1
2
29th IAHR Symposium on Hydraulic Machinery and Systems
IOP Conf. Series: Earth and Environmental Science 240 (2019) 072025
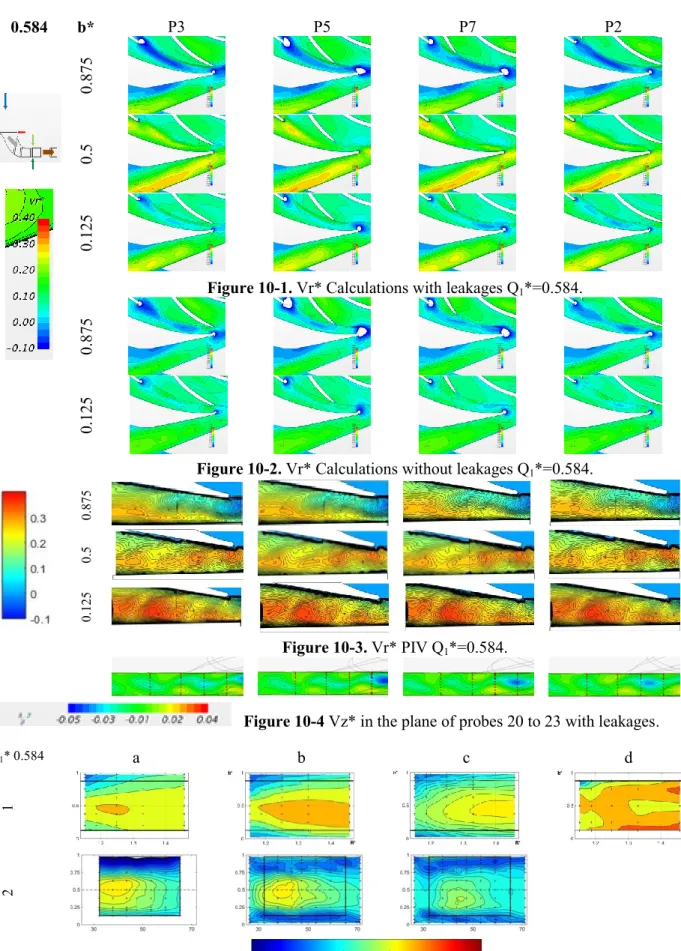
IOP Publishing doi:10.1088/1755-1315/240/7/072025 0.584 b* P3 P5 P7 P2 0.875 0.5 0.125
Figure 10-1. Vr* Calculations with leakages Q1*=0.584.
0.875
0.125
Figure 10-2. Vr* Calculations without leakages Q1*=0.584.
0. 87 5 0. 5 0. 12 5 Figure 10-3. Vr* PIV Q1*=0.584.
Figure 10-4 Vz* in the plane of probes 20 to 23 with leakages.
Q1* 0.584 a b c d
1
2
29th IAHR Symposium on Hydraulic Machinery and Systems
IOP Conf. Series: Earth and Environmental Science 240 (2019) 072025
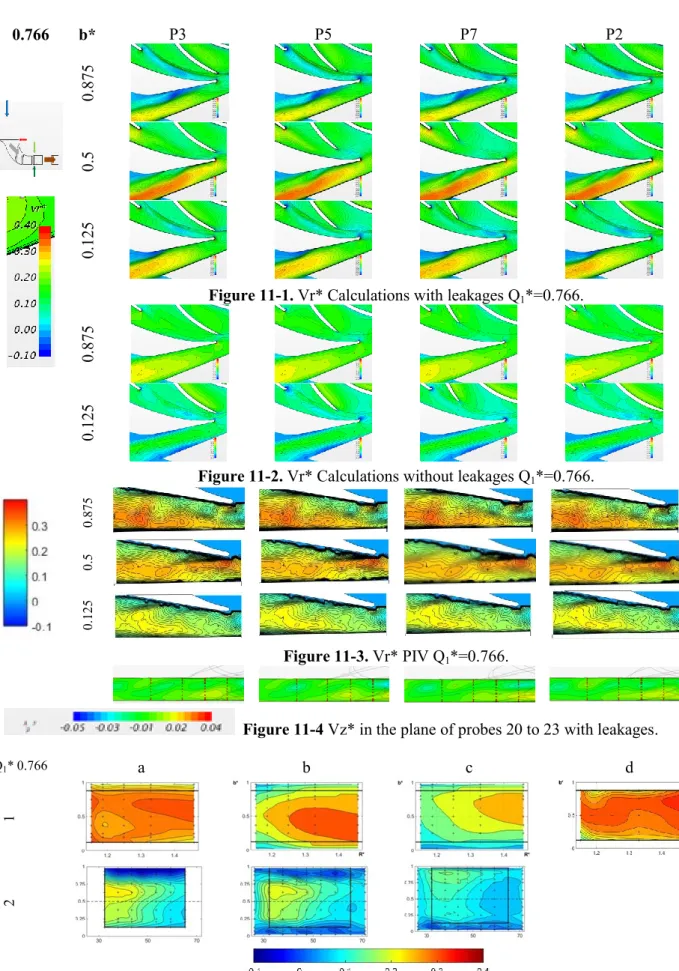
IOP Publishing doi:10.1088/1755-1315/240/7/072025 0.766 b* P3 P5 P7 P2 0.875 0.5 0.125
Figure 11-1. Vr* Calculations with leakages Q1*=0.766.
0.875
0.125
Figure 11-2. Vr* Calculations without leakages Q1*=0.766.
0. 87 5 0. 5 0. 12 5 Figure 11-3. Vr* PIV Q1*=0.766.
Figure 11-4 Vz* in the plane of probes 20 to 23 with leakages.
Q1* 0.766 a b c d
1
2
29th IAHR Symposium on Hydraulic Machinery and Systems
IOP Conf. Series: Earth and Environmental Science 240 (2019) 072025
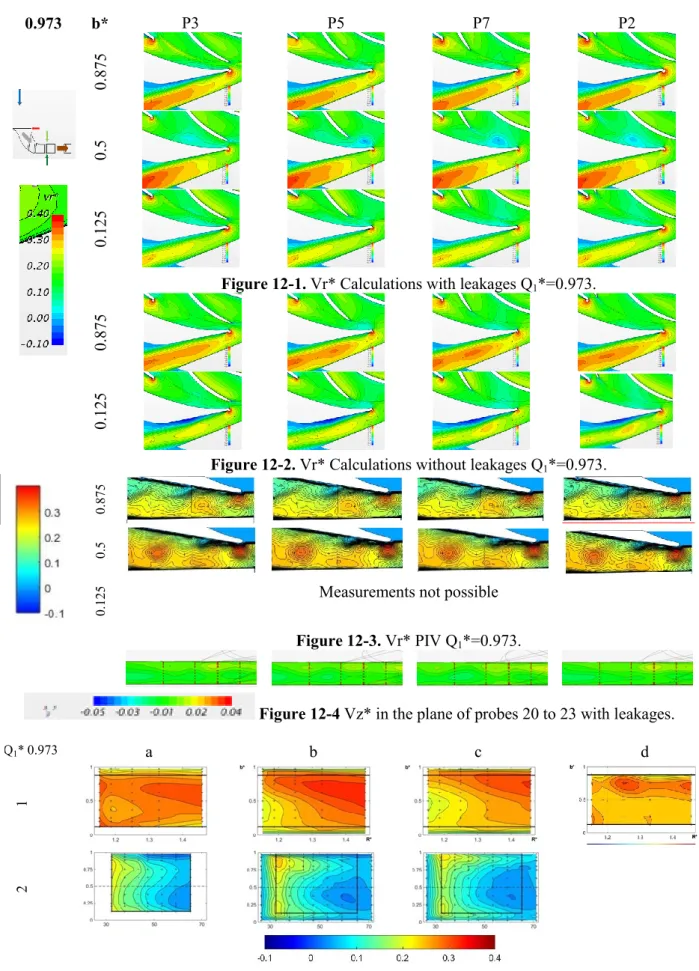
IOP Publishing doi:10.1088/1755-1315/240/7/072025 0.973 b* P3 P5 P7 P2 0.875 0.5 0.125
Figure 12-1. Vr* Calculations with leakages Q1*=0.973.
0.875
0.125
Figure 12-2. Vr* Calculations without leakages Q1*=0.973.
0. 87 5 0. 5 0. 12
5 Measurements not possible
Figure 12-3. Vr* PIV Q1*=0.973.
Figure 12-4 Vz* in the plane of probes 20 to 23 with leakages.
Q1* 0.973 a b c d
1
2
29th IAHR Symposium on Hydraulic Machinery and Systems
IOP Conf. Series: Earth and Environmental Science 240 (2019) 072025
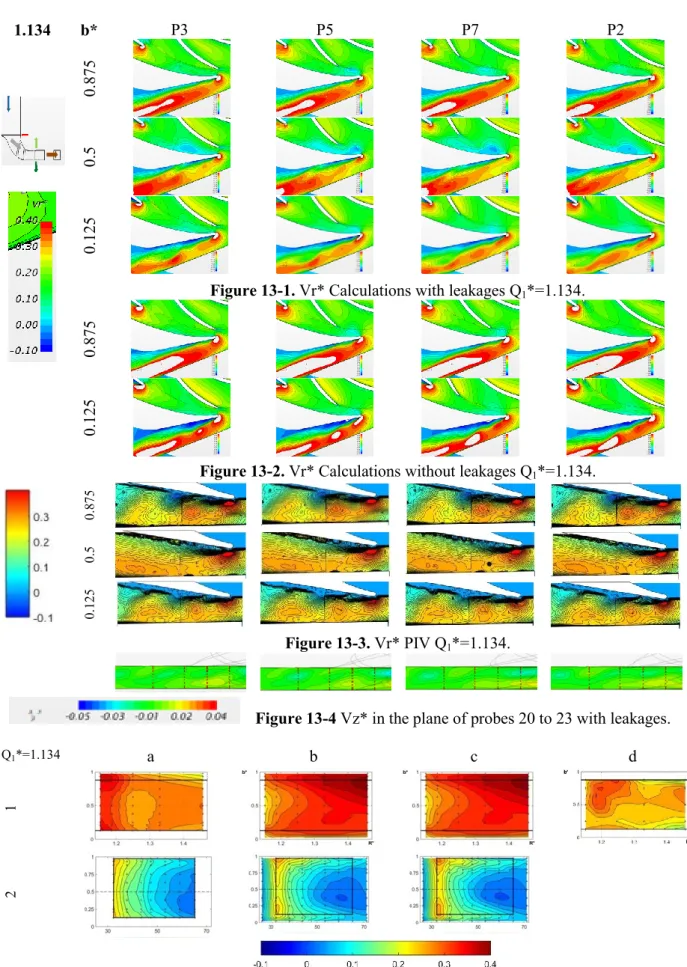
IOP Publishing doi:10.1088/1755-1315/240/7/072025 1.134 b* P3 P5 P7 P2 0.875 0.5 0.125
Figure 13-1. Vr* Calculations with leakages Q1*=1.134.
0.875
0.125
Figure 13-2. Vr* Calculations without leakages Q1*=1.134.
0. 87 5 0. 5 0. 12 5 Figure 13-3. Vr* PIV Q1*=1.134.
Figure 13-4 Vz* in the plane of probes 20 to 23 with leakages.
Q1*=1.134 a b c d
1
2
29th IAHR Symposium on Hydraulic Machinery and Systems
IOP Conf. Series: Earth and Environmental Science 240 (2019) 072025
IOP Publishing doi:10.1088/1755-1315/240/7/072025
- Figures x-5 Non dimensional mean radial velocities in the surface of probes 19 to 23 (1) and 1 to 9 (2), for which pressure directional probe (a), calculations with leakages (b), calculations without leakages (c) and PIV (d) results are presented. For these figures, all values has been interpolated with values for the positions of probe’s measurements (10 planes), including for PIV measurements (5 planes).
All results for a given value of flowrate can be observed simultaneously in a single page. All figures present results from hub to shroud starting from the bottom to the top of figures. All figure maps x-1 to x-4 present results from outer to inner radius (main flow direction is directed from right to left). On contrary, in figures x-5, results are presented from inner to outer radius. The diagram of direction of the leaks, already given in figure 7, is taken again to the top left of each set of figure. The visualisation of numerical results is given by star CCM+ at the same scale (-0.1<Vr*<0.4) for all figures, unless figures series x-3 (scale given in figures). The same scale has been chosen for experimental results. But even if the same color palette has been adopted in the exploitation of numerical results and experimental results, it appears that the color range is more intense in the case of experimental PIV results. This can be observed in figures x-1, x-3 and x-5, line 1, columns a and b. This remark should be taken into account when looking at some comparisons.
For all four non-dimensional flowrates lower than 1, fluid leakages are entering inside the gaps between the impeller and the diffuser both hub-side and shroud-side.
Concerning the results of radial velocity components at the entrance of the diffuser (probes 1 to 9), the results of PIV are not exploitable, so the comparison is made only between the two types of calculations and the directional probe (figures x-5). The results located in the black rectangular contours are therefore compared and show good consistency between measurements and calculations with leakage at all flow rates with respect to the disturbance and blockage caused by the presence of the directional probe.
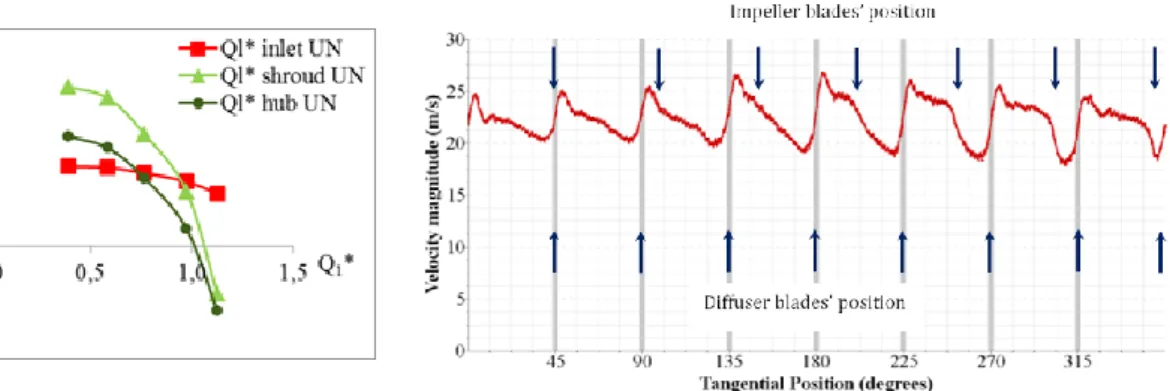
Figure 14. Flowrates. Figure 15. Velocity magnitude of fluid leakages at shroud
side in the middle radius of leakages (position P2, radius 257.5 mm, Q1*=0.386).
Concerning the results of radial velocity components inside the inter-blade channel, for the 3 viewing planes, compare the figures x-1 to x-3 and the figures x-4 and x-5 for planes of probe, for each flow rate:
- Q1*=0.386: there is good consistency between the PIV results and the leak calculations. Radial velocity contours show fluid structures that are moving from the inlet to the outlet of the diffuser as impeller rotates. Some recirculation zones are also detected from leading edge of the diffuser’s blade on shroud side, which are highlighted in the PIV measurements. This is also captured by calculations results without leakages. The observation of the axial velocity components shows a strong mixing along the axis in the plane of the probes, inside the diffuser. The maximum intensity of negative axial velocity is of the order of 20% of the maximum intensity of the radial velocities (figure 9.4). It is at this lower flow that leakage rates entering are observed in the gap between impeller and diffuser on the shroud side and on
29th IAHR Symposium on Hydraulic Machinery and Systems
IOP Conf. Series: Earth and Environmental Science 240 (2019) 072025
IOP Publishing doi:10.1088/1755-1315/240/7/072025
the hub side (figure 14.). The present calculations show that the leakages are dependant of angular position and impeller’s rotating blade to diffuser’s blade interaction as can be seen in figure 15. This leads to a leak rate around 22 m/s. This flow acts as a jet at the entrance of the diffuser. It can therefore be assumed that these leakage flow rates cause a significant mixing at the entrance of the diffuser and can explain the recirculation zones observed at the shroud side for which the leak rate is the greater. It can be observed that, the calculations with leakages show that there are flashes of velocity, which can be compared to a certain amount of “respiration” that seems to be related to leakage velocities (figure 15). But the leakage velocities are kinked to blade to blade interactions. So the blade to blade interactions act the movement of “breathing” and also on leakages flow. At this low value of Ql*, the influence of blade to blade interaction is so multiplied.
- Q1*=0.584: A good agreement can be observed between measurements with probe and calculations with leakage, especially on the shroud side. This concordance is more difficult to highlight with PIV measurements. The examination of the different visualizations in the planes b * clearly shows the unsteady flow linked to the impeller blade passage in front of the vanes of the diffuser, both for PIV and calculations with leakages. Concerning the axial velocity (figure 10.4), the same analysis can be done: leakages depend on relative angular position between impeller and diffuser due to the rates of leakage (figure 14) and disturb the flow inside the diffuser.
- Q1*=0.766: a good correlation is observed between the two types of measurements and the calculations with leaks. This set of results corresponds to the nominal flow rate for which the calculated leakages decrease significantly but are still entering. The general appearance is in agreement with probe’s measurements and calculations with leakage on the shroud side but not on the hub side. It can be observed that the calculation without leakages are in best agreement with a theoretical result at design flowrate (figure 11.2), the velocity is quite constant at each radius and aligned with the blades. On the contrary, for the real case with leakages, it can be observed that leakages still have a real influence on flow stream. The mean leak rate is about 10 m/s on shroud side and the leakages still disturb the flow inside the diffuser. This disturbance is observed in all the section planes, both by the PIV measurements and by the calculations with leakages. For this last two values of Ql*, the phenomena of “breathing” still exists.
- Q1*= 0.973: as PIV measurements were not possible near hub side (b*=0.125), in order to do figure 12-5.1-d, a zero value has been assumed on the hub side to draw figure 12.5. At these flowrate, the influence of leakages decrease significantly but are still incoming. The influence of the blade to blade interaction is still observed concerning the “breathing”.
- Q1*=1.134: high instability can be observed in both PIV and calculations with or without leakages (for this flow rate, low leakage value has been obtained and come out of the diffuser). As it has been also observed at low flowrate for high positive incidence angle, recirculation zones are observed as well for negative values of the incidence, both corresponding to negative radial velocities. It also can be seen that at the outlet of the diffuser on hub side a large angular zone in which the radial velocity is very small in PIV measurements and leak calculations.
The calculations without leakage give bad results. So, calculation taking into account leakages effects is mandatory in order to get good comparisons with experiments.
In previous analysis (6-8), leakage effects were taken into account using simple 1D evaluation of the local flow rates based on loss coefficients. The resulting flow rate was obtained without taking into account instantaneous pressure due to rotor stator interactions. The way the calculation is now performed is more realistic and takes in consideration these interactions so that the leakage values are unsteady as well.
Now, let us compare figure 10.5 to 12.5. The first set corresponds to a cut plane between probes 19 to 13. Concerning the case of PIV measurements, interpolation has been done between 5 planes, also,
29th IAHR Symposium on Hydraulic Machinery and Systems
IOP Conf. Series: Earth and Environmental Science 240 (2019) 072025
IOP Publishing doi:10.1088/1755-1315/240/7/072025
should we take the results with much hindsight. Concerning the pressure probe measurement, the three-hole probe can give information of velocities and pressure but this method disturbs the flow fluid. The presence of the probe inside the channel represents more than 5% of the width of the diffuser throat of the channel (2mm compared to 38,9 mm) and from 3,5 % to 100 % of the locally depth of the channel [13]. These remarks have to be taken into account for the comparisons of results. At low flowrate (<0.766), there is a good agreement between calculations with leakages and probe’s measurements. For flowrate>0.766, the agreement is not so bad.
The second set of results corresponds to a cut circular section between probes 1 to 9. Probe’s measurements as well calculations with leakages show negative values of radial velocities on hub and on shroud side at low flowrates (<0.766). This phenomenon is also observed in the case of calculations without leakage, but in a less intense way. These negative values correlate with a negative relative pressure at the impeller outlet and with the generation of incoming leak flow rates. These negative values disappear for higher flows, even if they remain a little on the shroud side for the flow rate of 0.974. This is obviously related to the leakage rate
5-Conclusion
Unsteady flow structures inside a vaned diffuser of a centrifugal pump model have been compared using two different experimental techniques and unsteady calculations.
Numerical results with leakages show good agreements both with PIV and directional probe results (when possible). Numerical results with leakages well capture the unsteady flow characteristics with flow separation zones, depending on the flow rate.
Leakage effects must be taken into account in the calculation for comparisons with experimental results. Strong local mixing zones are captured before the inlet diffuser throat inside the vaneless space. This is the reason why diffuser performances strongly depend on the combined effect of these leakages and the flow rates.
At low and at high flowrates, recirculation zones are observed, especially on the hub side.
These results add new contributions on diffuser performance pressure recovery that have been observed and not always well explained in previous papers.
These results add new contributions on diffuser performance pressure recovery that have been observed and not always completely explained in previous papers on the same particular configuration. Nomenclature b b* B C Q1* Qd Qi Ql* R R* Vr Vr*
Distance from hub [m]
Non-dimensional distance from hub (=b/B) Diffuser Blade height [m]
Impeller torque [mN]
Non-dimensional volume flowrate at impeller’s inlet(=Q/Qi)
Diffuser design flowrate [m3/s] Impeller design flowrate [m3/s]
non-dimensional flowrates of fluid leakage (=Ql/Qi) Radius [m]
Non-dimensional radius (=R/R2) Radial velocity [m/s]
Non-dimensional radial velocity (=Vr/U2)
Vz Vz* U2 d Index d i p Axial velocity [m/s]
Non-dimensional axial velocity (=Vu/U2) Frame velocity at blade’s impeller outlet [m/s] (=R2)
Number of diffuser blades Number of impeller blades Angular Velocity [rad/s] (=πN/30)
Diffuser Impeller Pump
References
[1] Runstadler PW, Dolan FX, Dean RC 1975 Diffuser Data Book: Diffuser Data and
Interpretation Creare Inc
[2] Japikse D 1996 Centrifugal compressor design and performance Wilder VT: Concepts ETI Inc [3] Morel P 1993 Ecoulements décollés dans une pompe de roue centriguge (Lille, France) PhD
29th IAHR Symposium on Hydraulic Machinery and Systems
IOP Conf. Series: Earth and Environmental Science 240 (2019) 072025
IOP Publishing doi:10.1088/1755-1315/240/7/072025
[4] Wuibaut G, Dupont P, Caignaert G, Stanislas M 2000 Experimental analysis of velocities in the outlet part of a radial flow pump impeller and the vaneless diffuser using particle image velocimetry Proc. of the XX IAHR Symp. (Charlotte, USA)
[5] Wuibaut G 2001 Etude par vélocimétrie par images de particules des interactions
roue-diffuseur dans une pompe centrifuge (Lille, France) PhD thesis
[6] Cavazzini G 2006 Experimental and numerical investigation of the rotor-stator interaction in
radial turbomachines (Padova, Italy) Ph.D. thesis
[7] Cavazzini G, Pavesi G, Ardizzon G, Dupont P, Coudert S, Caignaert G, Bois G 2009 Analysis of the rotor-stator interaction in a radial flow pump La Houille Blanche 5 141-151
[8] Cavazzini G, Dupont P, Pavesi G, Dazin A, Bois G, Atif A, Cherdieu P 2011 Analysis of unsteady flow velocity fields inside the impeller of a radial flow pump : PIV measurements and numerical calculation comparisons Proc. of ASME-JSME-HSME Joint Fluids Eng. Conf. (Hamamatsu, Japan)
[9] Si Q, Dupont P, Bayeul-Lainé AC, Dazin A, Roussette O, Yuan S 2015 An experimental study of the flow field inside the diffuser passage of a laboratory centrifugal pump ASME J. Fluids
Eng. 137 1-12
[10] Bayeul-Lainé AC, Dupont P, Cavazzini G, Cherdieu P, Dazin A, Bois G, Roussette O 2013 Numerical and experimental investigations in a vaned diffuser of SHF impeller : fluid leakage effect 21 ème Congrès Français de Mécanique (Bordeaux)
[11] Bayeul-Lainé AC, Dupont P , Miccoli L, Cavazzini G, Dazin A, Pavesi G, Bois G 2014 Fluid leakage effect on analysis of a vaned diffuser of SHF pump ISROMAC-15 (Honolulu, USA) [12] Bayeul-Lainé AC, Dupont P, Cavazzini G, Pavesi G, Dazin A, Cherdieu P, Bois G Roussette O
2015 Comparisons RANS and URANS numerical results with experiments in a vaned diffuser of a centrifugal pump La Houille Blanche 2 108-116
[13] Bayeul-Lainé AC, Dupont P , Dazin A, Bois G 2016 Investigations inside a vaned diffuser of a centrifugal pump at low flowrates IOP Conf. Series: Earth and Environmental Science 49, Issue 3
[14] Dupont P, Bayeul-Lainé AC, Dazin A, Bois G, Roussette O, Si Q 2015 Leakage Flow Influence on SHF pump model performances Int. J. of Fluid Machinery and Systems 8 (4) 274-282
[15] Cherdieu P 2014 Contrôle du décollement dans un diffuseur aubé de turbomachine centrifuge (Lille, France) PhD thesis
[16] Adamczyk J. J., Celestina M. L., Chen J. P. 1994 Wake induced unsteady flows :their impact on rotor performance and wake rectification ASME International Gas Turbine and Aeroengine
Congress and Exposition (The Hague, Netherlands)
[17] Arndt N., Acosta A.J., Brennen C.E., Caughey T.K 1990 - Experimental Investigation of Rotor – Stator Interaction in a Centrifugal Pump With Several Vaned Diffusers ASME J.
Turbomachinery 112 98-108.
[18] Eisele K., Zhang Z., Casey M. V., Gülich J., Schachenmann A. 1997 Flow analysis in a Pump Diffuser Part 1 : LDA and PTV Measurements of the Unsteady Flow Transactions of ASME J.
Fluids Eng. 119 968-977
[19] Menter FR, Kuntz M 2002 Adaptation of Eddy Viscosity Turbulence Models to Unsteady
Separated Flows Behind Vehicles The Aerodynamics of Heavy Vehicles: Trucks, Buses and Trains Springer (Berlin) 339-352
![Figure 1. Test rig (Morel [3]). Figure 2. Apparatus: three-hole probe.](https://thumb-eu.123doks.com/thumbv2/123doknet/7381665.215593/4.892.489.766.714.1097/figure-test-rig-morel-figure-apparatus-hole-probe.webp)