Université de Montréal
Rapport de recherche
Understanding economic cycle effects on top executive compensation:
An analysis applied to American NYSE listed companies
Rédigé par : Alameh Lily Isabelle
Dirigé par : Bellou Andriana
Département de sciences économiques Faculté des arts et des sciences
Abstract:
Top executive compensation has always been a subject of debate. In this paper, we try to comprehend effects of economic cycles on top executives’ compensation in relation with implicit contracts. We use in our model various variables used in both studies in order to assess the impacts of each on compensation components for NYSE listed companies. We also include three macroeconomic variables related to unemployment rate in order to explore if there are any macroeconomic effects on a top executive’s compensation. Beaudry and DiNardo (BD) use unemployment levels to interpret economic variations impacts on compensation, their framework refers to salary workers receiving a fixed annual wage only. We try to apply an adjusted model using their variables since a top executive compensation includes a fixed component similar to salary workers. By testing the model in a disaggregated way; on each component separately; we will attempt to find a link between economic cycles and their compensation. Economic cycles are determinants of wage determination but results are different when evaluating each component separately.
1 1. Introduction
Top executive compensation has always been a subject of debate. In the business community for example, CEO’s compensation has been criticized to be over-rewarding. While in the academic community, determinants of top executive compensation have always been debated between researchers. On the other hand, understanding and measuring effects of business cycles on wages has been treated in many recent studies: In fact, implicit contracts theory explores the existing dynamic between contracts and remuneration. As for Beaudry and DiNardo (BD), they capture the role of current and anterior economic conditions in determining real wages. Nevertheless, these studies treat one type of compensation that is based on an annual wage excluding other types of compensation such as top executives’.
In this paper, we try to comprehend effects of economic cycles on top executives’ compensation in relation with implicit contracts. We would like to analyse economic effects since their date of entry at the company and examine effects of current and anterior economic conditions vis-à-vis their remuneration. It is important to ask such a question because it focuses on a different type of compensation that hasn’t been taken into account in implicit contract theory. In reality, top executives are compensated a fixed salary on an annual basis but their contracts include also options such as in-the-money, stock holdings, bonuses and pension plans. These forms of compensation are directly linked to the performance of the executive himself but also to the company’s. Therefore, it becomes interesting to analyse contemporaneous and anterior economic cycle impacts on this alternative type of compensation. Our main contribution
2 is then our attempt to explore the relationship between macroeconomic determinants and microeconomic determinants present in top management’s level of remuneration.
The remainder of this paper is structured into five sections: In the second section, we start by reviewing prior empirical literature on determinants of top executive compensation, CEO’s and firm performance. In Section 3, we define our econometric model and variables used. Furthermore in this section we present and describe our data. Then, in Section 4, we elaborate on the methodology used to treat our model. We document the association between level of compensation and our predictors. We interpret our conducted empirical results. And in our final section, we present a conclusion summarizing our findings.
2. Literature review
The literature on top executive compensation examines the main drivers of CEO’s compensation: equity holdings, option holding, ownership and corporate governance. Various studies show that corporate governance plays an important role in motivating executives to increase firm’s performance. Other authors such as Crystal (1991) and Jensen (1993) demonstrate that board of directors are ineffective since most of the time CEO and the board chair are the same person, and outside directors who usually determine CEO compensation levels are hired by CEO himself. In this situation, a board of directors becomes ineffective towards setting an optimal pay-for-performance contract. The relation between compensation and options holdings has been examined in many articles. Conyon, Peck, Read and Sadler (2000) examine options and stock holding contracts of CEOs. They also evaluate the variation of a stock portfolio according to the company’s performance and the variation of performance depending on the structure of options contract. Nohel and Todd (2003) study how compensation of career
3 oriented CEOs affects their investment strategies. Chalmers, Koh and Stapledon (2006) focus on identifying determinants of compensation as they study the relationship between excess of remuneration and the subsequent company’s performance. They find that economic attributes are significant drivers of CEO’s compensation in Australia, that a positive pay-for-performance link is present for all components of compensation except for shares in a cross-sectional setting. They also observe that after controlling economic attributes; ownership and governance attributes play a significant role in the determination of CEO compensation. Hayes and Schaeffer (2000) analyse information that is present in top executives’ salaries according to current and past economic conditions. Beaudry and DiNardo (1991), show that past labor conditions have persistent effects on wages. And finally, Bellou and Kaymak (2010) examine impacts of economic cycle on wages in Europe and the effects of the nature of negotiation on determining salaries. They find that anterior labor conditions play a significant role in predicting current wages. They also find that contemporaneous unemployment rate has a significant impact on wages which doesn’t allow them to rule out spot market model entirely. And based on the structure of labor market in the presence of unions and bargaining practices, their findings show that wage behavior is thus different in this situation. It is important to note that these studies do not treat CEO compensation but instead regular salaried employees.
These articles are important for us to understand different relationships between compensation and business cycles in general, econometric models used by researchers, top executives’ remuneration and performance in particular. We rely on previous results regarding main drivers of compensation and apropos implicit contract theory to finally combine them in order to examine the dynamics in top executive compensation.
4 3. Econometric Model:
Based on Core et al, Chalmers, Koh and Stapledon and Bellou and Kaymak articles briefly described in our introduction, we study this econometric model:
Ln SALTOTi(s, s+t): α1 + β1AGEi+ β2AGEi2+ β3AGEi3+ β4TENi+ β5TENi2+ β6TENi3 + β7ROEs+t + β8ROAs+t + β9RiskRETs+t+ β10RiskCORP+ β11OWN +β12Uct+ β13U0,s+t + β14Uminct; s+t + f+∑i,s λ i,s IND +Ѵ i,s TREND+ Ѵ i,s TRENDsq ԑi s+t
(s: date of entry; s+t: tenure)
a) Dependent variable:
Our dependent variable here is SALTOT, composed of a fixed component, stocks awards, option awards and bonuses. We suppose each component is affected differently by company’s returns, its risks and economic cycles. Therefore, we try to run this model on each component and on the totality of this variable (SALTOT) to observe the relationship between the dependent variable and predictors. We disaggregate this variable into different categories: fixed salary, cash salary and other compensation. Fixed salary will be defined as SALFIX and is only determined by noncontingent wage that is fixed at the beginning of the year. Cash salary will be labeled as SALCASH and is the sum of salary and annual bonus. Other compensation is in fact valuation of options (OPTA) and stocks awarded (STOCKA) as reported in order to have a standard valuation across our model. All compensation forms have been deflated to express them all in terms of 2010 American dollars.
b) Predictors:
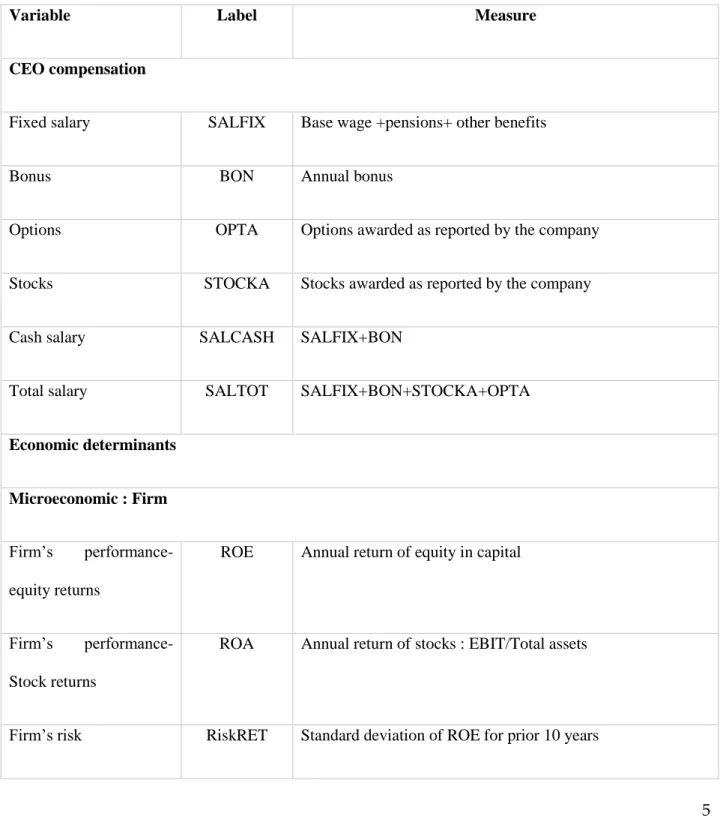
5 We present below a table that defines our variables used in this study and outlines the measure methodology of each of our used predictors.
Table 1: Variable description and measurement
Variable Label Measure
CEO compensation
Fixed salary SALFIX Base wage +pensions+ other benefits
Bonus BON Annual bonus
Options OPTA Options awarded as reported by the company
Stocks STOCKA Stocks awarded as reported by the company
Cash salary SALCASH SALFIX+BON
Total salary SALTOT SALFIX+BON+STOCKA+OPTA
Economic determinants
Microeconomic : Firm
Firm’s performance- equity returns
ROE Annual return of equity in capital
Firm’s performance- Stock returns
ROA Annual return of stocks : EBIT/Total assets
6 Firm’s risk RiskCORP Standard deviation of ROA for prior 10 years
Ownership OWN Percentage of shares owned by a top executive
Macroeconomic : Country
Contemporaneous unemployment rate
Uct Level of contemporaneous unemployment rate
Unemployment rate on the date of entry
U0 Level of unemployment rate on the date of entry
Minimal unemployment rate
Umin
ict Value of minimal rate over the studied period
Control
age AGE Polynomial : age of CEO (AGE, AGE2)
tenure TEN Polynomial :years of tenure (TEN, TEN2, TEN3)
Industry COYEAR Indication variable: companies names
Year TREND,
TRENDSQ
Indication variable : 2002-2012
Individual fixed effects f Fixed individual effects in the equation that captures all unobserved time-constant factors that affect our dependent variable
7
c) Sample
The sample consists of 14 783 compensation related observations; performance related observations, contemporaneous unemployment observations and past unemployment related observations. We obtained our data using three databases. Microeconomic data has been retrieved from Compustat; a data base specialized in finance and top executive compensation. It is accessible via Wharton Research data services by University of Wharton in Pennsylvania and it provides detailed information on top executives’ annual salaries, bonuses and other forms of granted compensation throughout the year. As for the market performance variables (ROE, ROA, risk), we used CorporateFocus (infinancials) a database specialised in financial information and reporting. And at last, we used the Bureau of Labor Statistics base of United States government for yearly unemployment data. We evaluate in our sample remuneration of a group of 1041 firms between 2002 and 2012. Selected firms are NYSE index listed companies such as IBM, Apple, and AT&T. Performance variables are associated to each company and merged with unemployment rates year by year.
a. Preliminary results and analysis
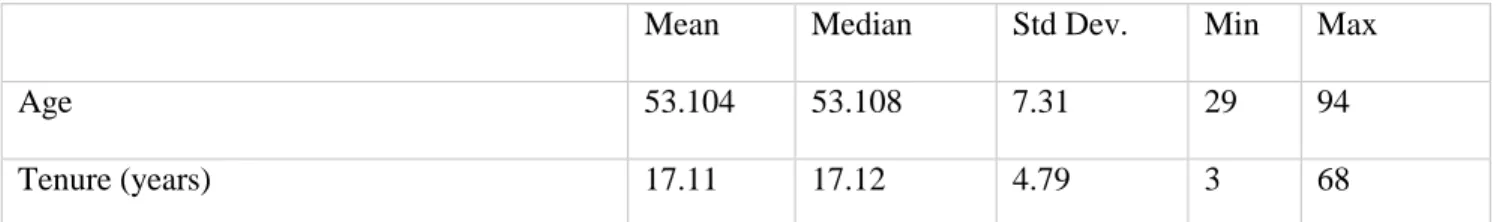
Table 2 provides detailed descriptive statistics for top executive compensation components and correlation between attributes. Top executives are 53 years old, and spend up to 17 years in the same firm on average. The mean (median) total executive compensation in our sample is $3 676 173 ($6 109 874). The mean (median) of compensation contract is composed of a fixed component of $3 360 207 ($6 109 874) a bonus of $156 379, and $288 779.6 in options awarded.
8 Average performance measures are positive with an ROA of 4.03% on average and ROE of 4.54% with standard deviation on assets of 21.9% and an average standard deviation on equity of 4.4%. Contemporaneous unemployment is 6.7% on average, minimum unemployment is 4.26% and unemployment at year of hire is 4.5% on average.
Table 2. Descriptive statistics for top executive compensation and suggested attributes
Panel A: Executive specific attributes
Mean Median Std Dev. Min Max
Age 53.104 53.108 7.31 29 94
Tenure (years) 17.11 17.12 4.79 3 68
We also examine the distribution of executives by gender, we find that only 5.17% are identified as female and 94.83% of top executives are male.
Panel B: Top executive compensation
Mean Median Std Dev. Min Max
Salary ($00) 33602.07 61098.74 33690.3 0 550962
Bonus ($00) 156.379 941.404 -479.27.0 2836805
Stock granted value as reported ($00) 1000.596 402.541 2006.48 -2175.89 73496.34 Options granted value as reported ($00) 288779.6 1220.492 4657155 0 2.42e+08
Shares granted 71.17 10.48 1040.36 0 61144
Cash Compensation ($00) 53011.17 37136.3 95051 0 3197852
Shares-Ownership (%) 1.02 0.78 4.09 0 100
Total compensation ($00) 367617.3 7035.79 -164250 19
10000.07 All compensation components have been deflated using 2010 CPI.
9 Panel C: Microeconomic determinants
Mean Median Std Dev. Min Max
Return on assets (%) 0.040 0.040 0.399 -47.3 1.34
Return on equity (%) 0.045 0.045 3.19 -371.3 43.145
Standard deviation of ROA 0.044 0.019 0.393 0 19.34
Standard deviation of ROE 0.21 0.050 3.15 - 151.24
Standard deviation of ROA and ROE represents respectively the standard deviations of annual percentage corporate and stock market return for the prior ten years.
Panel D: Macroeconomic determinants
Results in Mean Median Std Dev. Min Max
Unemployment at year of hire (%) 0.055 0.056 0.005 0.035 0.097 Contemporaneous unemployment %) 0.067 0.058 0.0187 0.046 0.0963 Minimum unemployment since year of hire (%) 0.04 0.042 0.002 0.029 0.0808
On the other hand, we examine existing links between our predictors using a correlation matrix. It allows us to understand the dynamic relationship between attributes themselves and evaluate if in case of very strong correlation, the usefulness of an interactive variable. We present in attached annex two matrices, a classic correlation matrix and a combined matrix of two correlation coefficients: Pearson and Spearman’s. We examine correlations while using Pearson correlation coefficient. We find that firm’s risk is positively correlated with contemporaneous unemployment. In other words, the higher is the unemployment rate during a studied year, the riskier is to invest in firm stocks. We find a positive relationship between ownership and unemployment level at year of hire, which rules out the possibility that economic conditions at
10 year of hire play a role on the shares that a top executive will accumulate throughout the years. On the contrary, we find a negative relationship between contemporaneous unemployment level and ownership as high as -0.185, which can indicate that the spot conditions would possibly have a certain impact on the level of ownership a top executive will be granted. Furthermore, we observe that there is a very negative correlation between tenure and minimum unemployment with a coefficient of -0.65, due to the fact that minimum unemployment is computed based on tenure itself. Using Spearman’s matrix, we find that only minimum unemployment is negatively correlated with both ROA (ρ= -0.015) and positively correlated with a company’s risk (ρ= 0.082, ρ=0.079). Contemporaneous unemployment is negatively correlated will all variable except for risk, the higher is the rate of current unemployment the higher is the risk of a firm, which indicates that the current state of an economy could have an impact on the stability of a company’s returns. Unemployment rate at the start of the job is negatively correlated with age, ownership (ρ=-0.012) and firm’s risk (ρ= -0.012). But correlation is not very strong as we observe each rho. In general, spearman’s coefficients are observed to be higher than Pearson’s in our case.
4. Empirical results
a) Econometric specification
According to Core et al. (1999) positive pay performance link is found in the US using market performance. The level of total CEO compensation is “cross-sectionally” related to firm size, investment opportunities, prior performance, and firm risk. The coefficient on the stock return variable (RET) exhibits a positive and significant association with compensation”. Based on Chalmers, Koh and Stapledon (2006) in an Australian study; firm performance (ROA) is
11 positively significant and is associated with all compensation components except shares. CEO compensation and market performance are associated through the bonus component, meaning that bonuses are positively associated with market and accounting returns. The risk attribute is statistically significant for total compensation due to the positive association with the option component. Riskier firms are more inclined to reward top executives with options, while in contrast this association is significantly negative with shares. Stock compensation is found to be used to mitigate monitoring difficulties associated with managers’ use of private information related to investment decisions. They also find that CEO’s option holdings are positively significant to the fixed component of the salary and to stock holding. Which means for riskier firms talented CEOs’ are offered a larger fixed salary and options awards than a less talented executive.
We use in our model various variables used in both studies in order to assess the impacts of each on compensation components for NYSE listed companies. We also include three macroeconomic variables related to unemployment rate in order to explore if there are any macroeconomic effects on a top executive’s compensation. Beaudry and DiNardo (BD) use unemployment levels to interpret economic variations impacts on compensation, their framework refers to salary workers receiving a fixed annual wage only. We try to apply an adjusted model using their variables since a top executive compensation includes a fixed component similar to salary workers. By testing the model in a disaggregated way; on each component separately; we will attempt to find a link between economic cycles and their compensation. And supposing that usually economic cycles tend to affect companies’ market performance, we expect to find an association between our macroeconomic predictors and the market based components of a CEO’s compensation. We estimate our model using BD approach. We run our model following
12 the three steps: spot market model (Uct), full-commitment risk-sharing model (U0) and one-sided lack of commitment with worker mobility model (Umin). In respect to the spot market model β12 <0 β13= β14=0; which shows that compensation relies on contemporaneous conditions. In a full-commitment risk sharing model we can test β13 <0 β12= β14=0. And in the case that wages sends information about the best economic conditions that the worker experienced we test β14 <0 β13= β12=0. We extend our analysis by testing in Stage 1 only microeconomic determinants as applied by Core et al (1999) on disaggregated compensation. In stage 2, we test our model following BD method to capture effects of macroeconomic determinants on top executive compensation.
We also include other control variables in our model: age, tenure, industry classification for the company, year (linear time trend) and fixed effects. As cited in Bellou and Kaymak’s article, tenure is associated with the accumulation of firm-specific human capital and including a cubic polynomial in tenure is necessary in order to account for possible non-linearities in the effects of tenure on wages that could be inaccurately absorbed by minimum unemployment rate. Therefore we treat tenure as a cubic polynomial in our model. Age is also determined as a cubic polynomial to adequately estimate effects of age on remuneration. Company indicators are integrated in the model to have a classification by company, which each represent an executive in our sample. Individual fixed effects are incorporated for time-invariant productivity characteristics.
b) Results and analysis
We start our Stage 1 regression where we only regress our microeconomic predictors on our disaggregated dependent variable in order to examine direct association between each attribute and compensation.
13 We multiply by 100 to simplify the interpretation of our coefficients. We find that ownership and return on equity (ROE) have significant impacts on fixed salary (SALFIX) with a negative coefficient of -0.029 and -0.06 respectively. Testing for the cash component of compensation (SALCASH) we find that ROE and firm’s risk (riskCORP) have significant impacts on SALCASH. Return on equity has a negative impact while a firm’s risk has a positive impact. Subsequently, testing for our variable part of compensation: options (OPTA) and stocks (STOCKA) awarded. We find that only firm’s risk has a significant positive impact on this form of remuneration. In fact, our results concords with previous studies where riskier firms tend to compensate top executives through options. In our case, we find that an increase in risk firms, increases OPTA by 2.6%. Furthermore, running our model using STOCKA as our independent variable, we find that return on equity (ROE) has a significant negative impact on STOCKA, firm’s risk and ownership have a significant positive impact on STOCKA. Finally, testing our model on the totality of compensation (SALTOT), we find that only ROE and firms risk have significant impacts on top executive compensation. Comparing our results with findings of Chalmers et al. (2006) and Core et al. (1999), we find that our results are most similar to the ones reported by Chalmers et al.
In our Stage 2 regression, we include macroeconomic determinants in order to evaluate impacts of economic cycles on compensation. As cited previously, we use BD method to understand how and which attribute plays a significant role in the determination of top executive compensation. We then observe how all predictors affect our independent compensation components:
Tenure is the only significant economic determinant for all top executive compensation components. ROE is statistically significant with all components except for options. It is
14 negatively associated with these components, which indicates that when a company relies on its capital only to generate profit, compensation is reduced. Firm performance measured by ROA isn’t significant in our model, which doesn’t support a pay-for-performance link in compensation components such as the one found by Chalmers et al. We find that firm’s risk is statistically significant on all components except SALFIX. A positive association between firm’s risk and options awarded is consistent with previous international studies stating that riskier firms compensate their top executives using various options. Firm’s risk is also positively associated with SALCASH where we take into account bonuses that a top executive receives. Explaining that riskier firms tend to increase bonuses granted with their risk, a tool used probably to motivate executives to increase a company’s performance or to retain them. The risk attribute is also statistically significant for total compensation which can be explained by the association found with the options form of compensation. Ownership is another variable that is only significant for the STOCK component. This implies that the higher number of shares an executive owns, the higher is the number of awarded stocks by the end of the year too. As in previous studies, results suggest that determinants of top executive compensation are not restricted to micro-economic attribute only, as we observe that ownership and tenure have a significant impact on compensation.
On the other hand, using our macroeconomic variables only and our control variables; we find that one percent change in the contemporaneous unemployment rate leads to a decrease of 1.12% of real fixed wage rate. In fact, compared to Bellou and Kaymak, when evaluating real wage changes vis-à-vis contemporaneous unemployment, our result is close to their 1.7% observed decrease in real wage rate. When introducing the minimum unemployment rate to the model, we find that current economic conditions impact is reduced. The change of real fixed wage rate is of
15 -1.04% while minimum unemployment rate becomes much more significant with a coefficient of -15.6%. When we introduce the unemployment rate at year of hire separately, we find that a one percent change in this rate leads to an increase of 4% in real fixed wage rate. When running the model with our three variables we observe a one percent higher current unemployment rate is associated with a 1.01% lower wages. A one percent increase in the minimum unemployment rate lead to a reduction of -29% in the current wage. We also find that a one percent increase in unemployment rate when the top executive was hired is associated with an increase of 4% of real fixed wage. We note that history dependence in this case play a very important role in fixed salary determination alone for NYSE listed companies and the effect on minimum unemployment rate is significantly very large based on our data.
Turning to the model using both our microeconomic variables and all macroeconomic variables, our results suggest that economic cycles are statistically significant on top executive compensation. We find that contemporaneous unemployment has a significant impact on the fixed component of compensation with a negative association. A one percent change in the national unemployment rate leads to a 2.6% fall in the real wage rate. Subsequently, a one percent increase in the minimum unemployment rate has a significant impact on real fixed wage rate, with a reported coefficient of -40%. We find that the unemployment rate at year of hire is positively associated with change of current wage.
When running our model on SALCASH, we find that unemployment variables behave the same way as for SALFIX but with reduced coefficient, of -2.29, 6.81, -38% for contemporaneous unemployment rate, unemployment rate at year of hire and minimum unemployment rate respectively. Economic conditions play a very important role on market related components of
16 compensation (OPTA, STOCKA). We observe that unemployment has the same association with option compensation and stock compensation as with fixed salary and bonuses. But current economic conditions have a very high impact on the rate of options and stocks awarded with coefficients of -24% and -12.73%. It is natural to think that economic conditions have a high impact on a company’s performance and risk, which leads to this negative correlation between current unemployment rates and these components of a top executive compensation. We find that the minimum unemployment rate has a negative impact on both options and stocks awarded while the unemployment rate when the job started has a positive impact on these types of compensation.
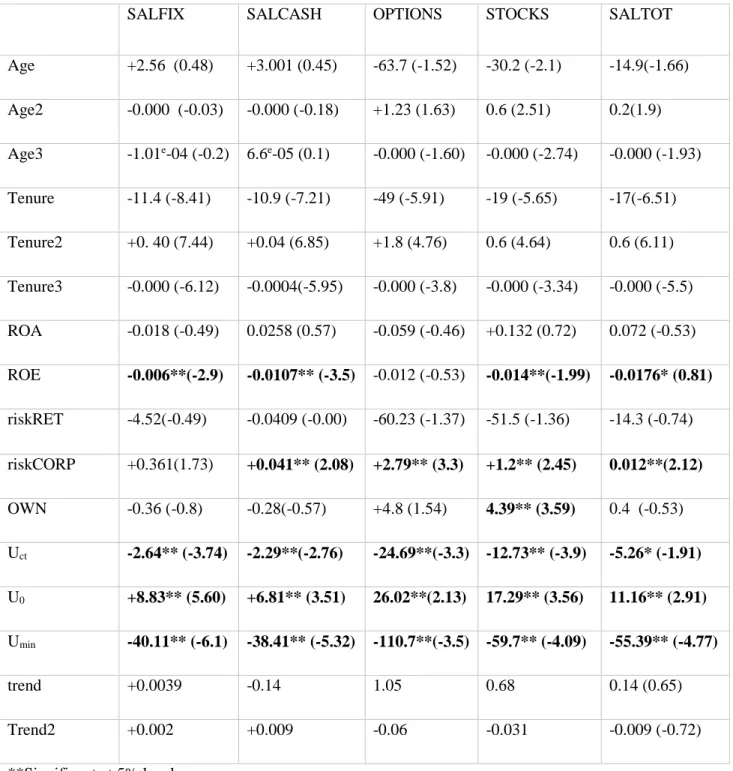
Finally, when evaluating our model on the totality of compensation we find that only the minimum unemployment rate and unemployment rate at year of hire have a significant impact at a five percent significance level. Umin is negatively associated with total compensation and U0 is positively associated. At a ten percent significance level, we find that all unemployment variables are significant, and that Uct is negatively associated with real total wage rate. We can say that current and past labor conditions play a role in determining compensation. However, when comparing to previous studies we notice that the unemployment rate at the year of hire plays an opposite but significant role in the determination of each and all components of top executive compensation. When examining our dependent variable, we observe that U0 is positively correlated with tenure, firm’s performance (ROA) and ownership. We try to examine the impacts when introducing quadratic tenure and quintuple tenure; we do not find a difference in the type of association between our unemployment variables and real compensation components rate. We present in table 4 in Annex B a summary of our results on each component. The table reports the coefficient from running the model using Beaudry and DiNardo
17 unemployment variables, with t statistics in parenthesis. Standard errors are clustered by company representing each one top executive.
c) Discussion
We suspect that; top executive compensation while it displays history dependence; the direction of the association between wages and unemployment indicators is not entirely consistent with what implicit contract theory would predict. We argue below that other economic and non-economic determinants play an important role in determining a top executive’s compensation. We first explore economic attributes that haven’t been captured in our model: G.L Nagel et al (2010) argue that a third of CEO rise in pay is also a factor of labor market demand in the US. And other two thirds can be explained by increased job risk, agency issues and social pressure (Hamermesh, 1975).
Regarding non-economic attributes, studies highlight the importance of these drivers in the process of determining top executive compensation. Appelbaum at al. (2008) discuss the importance of negotiation in setting CEO’s pay level. They set a process of compensation that is affected by only contextual factors (CEO power, the going rate, and institutional environment), process variables (CEO aspiration, principal reservation). These factors play a very important role in setting CEO compensation despite economic factors and that a CEO compensation is a product of negotiation that helps meet the chief executive officer’s aspiration and principal reservation. O’Reilly (1988) examines CEO compensation process and finds that there are many elements that play an important role in determining how much an executive is paid such as peer-group comparison, he finds also that the fact that feelings of reciprocity by compensation
18 committee plays a role in setting his pay. Although members of this committee are independent they are most of the time appointed by the CEO. In fact, O’Reilly found that members who haven’t been appointed by the chief executive earn a lower salary (12% less). Finally, he argues that social status plays also an important role in determining compensation levels. When comparing social statuses between top executives, he found that CEO’s who were of higher status than the chairman tend to be better paid and vice-versa. And as cited in our literature review section, Crystal (1991) and Jensen (1993) demonstrate that board of directors are ineffective since most of the time CEO and the board chair are the same person, and outside directors who usually determine CEO compensation levels are hired by CEO himself which leads to a certain bias in setting CEO’s pay.
Other studies suggest that market for a top executive talent has also an impact on how compensation is set and what factors affect the process of determining levels of top executive’s pay. Cremers and Grinstein examine internal and external market for CEO talent. They observe that depending on the type of market, factors having an impact on compensation are different. They find that internal market are much less sensitive to industry chocks and industry performance while external markets respond to industry chocks and companies’ performance. And that forces that determine executive compensation are driven by external markets but also inside bargaining. Their results support findings of O’Reilly in terms of political dynamics present inside a firm in setting top executives’ pay.
In addition, Falato and Li (2009) find robust evidence that talented CEO show higher turnover rates, earn higher compensation and companies anticipate a higher firm performance. Their
19 results are robust when controlling above mentioned governance mechanisms, CEO characteristics and firm specificities.
5. Conclusion
Using cross-sectional data on 1041 NYSE listed companies; we study the responsiveness of different components of executive compensation to current and past economic conditions. We show that the contemporaneous unemployment rate has a significant effect on top executive compensation; therefore we cannot exclude the important role that spot market models play in determining current top executive compensation. On the other hand, past labor market conditions are significant predictors of current top executive remuneration levels. Associations between the minimum unemployment rates are consistent with implicit theory but are much larger in our case. On the contrary, the unemployment rate at the start date of the job is inversely associated with compensation. This is opposite to what standard implicit contract theory would predict.
We discuss other factors that can be explanatory of this difference in the dynamic of economic conditions and compensation determination between fixed salaries and top executive compensation. We rely on previous studies that add non-economic attributes to top executive compensation. We note that various factors play a role in the process of determining a top executive compensation such as the type of market for talent, negotiation and turnover. These factors are most of the time less sensitive to economic environment and could explain in part why top executive compensation does not strictly accord with implicit contract theory. In fact, it would be interesting to generate a model that takes into account all these variables and understand how these variables compete together in determining top executive compensation.
20 The challenge would be to proxy these variables since they consist of confidential information, otherwise information that is rarely publicly released.
21 References
Beaudry P. and DiNardo J., 1991. The Effect of Implicit Contracts on the Movement of Wages
over the Business Cycle: Evidence from Micro Data.
Bellou A. and Kaymak B., 2010. Wages, Implicit Contracts, and the business cycle: Evidence
from a European Panel. University of Montreal, Canada
Chalmers K., Koh P. and Stapledon G., 2006.The determinants of CEO compensation: Rent
extraction or labour demand? Hong Kong University of Science and Technology
Core J., Holthausen R., Larcker D., 1998. Corporate governance, chief executive officer
compensation, and firm performance. The Wharton School, University of Pennsylvania
Conyon M., Peck S., Read L. and Sadler G., 2000. The structure of executive compensation
contracts: UK Evidence. The Wharton School, University of Pennsylvania and City business
school in London.
Cremers M. and Grinstein Y. The Market for CEO Talent: Implication for CEO compensation. Yale School of Management and Cornell University.
Devreux P. and Hart R., 2005. The spot market matters : evidence on implicit contratcs from
Britain.
Falato A. and Li D., 2009. Inside the CEO market: the role of CEO talent pay and turnover
decisions. Washington University in St Louis.
Gaver J., Gaver K. and Austin J., 1993. Additional evidence on bonus plans and income
management. University of Georgia, Athens.
Hanlon M., Rajgopal S. and Shevlin T., 2002. Are executive stock options associated with future
earnings? University of Michigan business school and University of Washington business
school
Hayes R., Schaeffer S., 2000. Implicit contracts and the explanatory power of top executive
22 Nohel T. and Todd S., 2003. Compensation for managers with career concerns: the role of stock
options in optimal contracts. Loyola University of Chicago
Nahel G., 2010. The effect of Labor Market Demand on U.S CEO pay since 1980. Mississippi State University.
Yao Y. and Appelbaum S., 2008. CEO compensation as a process and product of negotiation. John Molson School of Business, Canada.
Wade J., O’Reilly, C. Chandratat I. 1990. Golden parachutes: CEO’s and the exercise of social
23 ANNEX A
Correlation matrix for economic and ownership attributes using classic correlation coefficients
umin -0.1764 -0.1860 -0.1917 -0.6617 -0.5170 -0.4197 -0.0112 -0.0070 0.0043 0.0417 -0.1640 0.1676 -0.0328 1.0000 u0 0.0068 0.0012 -0.0041 0.3423 0.2259 0.1088 -0.0010 0.0052 0.0003 -0.0150 0.0604 -0.0605 1.0000 uct -0.1503 -0.1589 -0.1649 -0.1947 -0.1910 -0.1751 0.0237 0.0141 0.0233 0.0081 -0.2500 1.0000 OWN 0.2571 0.2869 0.3134 0.2519 0.2664 0.2536 -0.0142 -0.0088 -0.0105 -0.0039 1.0000 riskcorp 0.0079 0.0068 0.0056 -0.0261 -0.0157 -0.0102 -0.0851 -0.0278 0.0158 1.0000 riskret -0.0062 -0.0067 -0.0070 -0.0041 -0.0069 -0.0078 -0.0142 -0.0482 1.0000 roa 0.0107 0.0084 0.0060 0.0071 0.0060 0.0046 0.2665 1.0000 roe -0.0087 -0.0089 -0.0088 -0.0011 -0.0023 -0.0028 1.0000 tenure3 0.2884 0.3133 0.3333 0.8492 0.9720 1.0000 tenuresq 0.2859 0.3071 0.3231 0.9439 1.0000 tenure 0.2576 0.2738 0.2850 1.0000 age3 0.9675 0.9916 1.0000 agesq 0.9920 1.0000 AGE 1.0000 AGE agesq age3 tenure tenuresq tenure3 roe roa riskret riskcorp OWN uct u0 umin
Correlation matrix for economic and ownership attributes using spearman correlation coefficients . umin -0.1693 -0.1693 -0.1693 -0.6544 -0.6544 -0.6544 0.0545 -0.0150 0.0822 0.0794 -0.2432 0.1570 -0.0837 1.0000 u0 -0.0114 -0.0114 -0.0114 0.4709 0.4709 0.4709 0.0088 0.0309 -0.0129 -0.0136 -0.0120 -0.0107 1.0000 uct -0.1090 -0.1090 -0.1090 -0.1243 -0.1243 -0.1243 0.1231 0.0029 0.1650 0.1637 -0.2977 1.0000 OWN 0.2561 0.2561 0.2561 0.1622 0.1622 0.1622 -0.1602 -0.0638 -0.0885 -0.1072 1.0000 riskcorp -0.0311 -0.0311 -0.0311 -0.0604 -0.0604 -0.0604 0.2061 0.1111 0.8848 1.0000 riskret -0.0243 -0.0243 -0.0243 -0.0648 -0.0648 -0.0648 0.1205 0.0816 1.0000 roa 0.0027 0.0027 0.0027 0.0313 0.0313 0.0313 0.6161 1.0000 roe -0.0154 -0.0154 -0.0154 -0.0391 -0.0391 -0.0391 1.0000 tenure3 0.1268 0.1268 0.1268 1.0000 1.0000 1.0000 tenuresq 0.1268 0.1268 0.1268 1.0000 1.0000 tenure 0.1268 0.1268 0.1268 1.0000 age3 1.0000 1.0000 1.0000 agesq 1.0000 1.0000 AGE 1.0000 AGE agesq age3 tenure tenuresq tenure3 roe roa riskret riskcorp OWN uct u0 umin (obs=4879)
24 ANNEX B
Table 4. Regressions of top executive compensation on firm’s economic and ownership attributes
SALFIX SALCASH OPTIONS STOCKS SALTOT
Age +2.56 (0.48) +3.001 (0.45) -63.7 (-1.52) -30.2 (-2.1) -14.9(-1.66) Age2 -0.000 (-0.03) -0.000 (-0.18) +1.23 (1.63) 0.6 (2.51) 0.2(1.9) Age3 -1.01e-04 (-0.2) 6.6e-05 (0.1) -0.000 (-1.60) -0.000 (-2.74) -0.000 (-1.93) Tenure -11.4 (-8.41) -10.9 (-7.21) -49 (-5.91) -19 (-5.65) -17(-6.51) Tenure2 +0. 40 (7.44) +0.04 (6.85) +1.8 (4.76) 0.6 (4.64) 0.6 (6.11) Tenure3 -0.000 (-6.12) -0.0004(-5.95) -0.000 (-3.8) -0.000 (-3.34) -0.000 (-5.5) ROA -0.018 (-0.49) 0.0258 (0.57) -0.059 (-0.46) +0.132 (0.72) 0.072 (-0.53) ROE -0.006**(-2.9) -0.0107** (-3.5) -0.012 (-0.53) -0.014**(-1.99) -0.0176* (0.81) riskRET -4.52(-0.49) -0.0409 (-0.00) -60.23 (-1.37) -51.5 (-1.36) -14.3 (-0.74) riskCORP +0.361(1.73) +0.041** (2.08) +2.79** (3.3) +1.2** (2.45) 0.012**(2.12) OWN -0.36 (-0.8) -0.28(-0.57) +4.8 (1.54) 4.39** (3.59) 0.4 (-0.53) Uct -2.64** (-3.74) -2.29**(-2.76) -24.69**(-3.3) -12.73** (-3.9) -5.26* (-1.91) U0 +8.83** (5.60) +6.81** (3.51) 26.02**(2.13) 17.29** (3.56) 11.16** (2.91) Umin -40.11** (-6.1) -38.41** (-5.32) -110.7**(-3.5) -59.7** (-4.09) -55.39** (-4.77) trend +0.0039 -0.14 1.05 0.68 0.14 (0.65) Trend2 +0.002 +0.009 -0.06 -0.031 -0.009 (-0.72) **Significant at 5% level *Significant at 10% level
25 Graph 1. Distribution of logarithm (lnsalfix) of fixed salary over studied period
26 Graph 2. Distribution of cash salary (lnsalcash) over studied period
27 Graph 4. Distribution of total compensation (lnsaltot) component over studied period