HAL Id: hal-00863037
https://hal.archives-ouvertes.fr/hal-00863037
Submitted on 18 Sep 2013
HAL is a multi-disciplinary open access
archive for the deposit and dissemination of sci-entific research documents, whether they are pub-lished or not. The documents may come from teaching and research institutions in France or abroad, or from public or private research centers.
L’archive ouverte pluridisciplinaire HAL, est destinée au dépôt et à la diffusion de documents scientifiques de niveau recherche, publiés ou non, émanant des établissements d’enseignement et de recherche français ou étrangers, des laboratoires publics ou privés.
Runtime function instrumentation with EZTrace
Charles Aulagnon, Damien Martin-Guillerez, François Rue, François Trahay
To cite this version:
Charles Aulagnon, Damien MartGuillerez, François Rue, François Trahay. Runtime function in-strumentation with EZTrace. PROPER - 5th Workshop on Productivity and Performance, Aug 2012, Rhodes Island, Greece. pp.395-403, �10.1007/978-3-642-36949-0_45�. �hal-00863037�
Runtime function instrumentation with EZTrace
Charles Aulagnon1, Damien Martin-Guillerez2, Fran¸cois Ru´e2, and Fran¸cois Trahay3
1 ENSEIRB / INRIA Bordeaux Sud-Ouest [email protected] 2
INRIA Bordeaux Sud-Ouest [email protected]
3 Institut Mines-T´el´ecom - T´el´ecom SudParis [email protected]
Abstract. High-performance computing relies more and more on com-plex hardware: multiple computers, multi-processor computer, multi-core processing unit, multiple general purpose graphical processing units... To efficiently exploit the power of current computing architectures, modern applications rely on a high level of parallelism. To analyze and optimize these applications, tracking the software behavior with minimum impact on the software is necessary to extract time consumption of code sections as well as resource usage (e.g., network messages).
In this paper, we present a method for instrumenting functions in a binary application. This method permits to collect data at the entry and the exit of a function, allowing to analyze the execution of an application. We implemented this mechanism in EZTrace4and the evaluation shows
a significant improvement compared to other tools for instrumentation.
1 Introduction
The complexity of modern supercomputer hardware, due to the use of NUMA architecture, hierarchical caches or accelerators, as well as the use of hybrid programming models that mix MPI with OpenMP or PThread make it difficult to exploit efficiently a supercomputer. Optimizing a par-allel application requires to understand precisely its behavior, which can be tedious because of the hardware and software stacks.
Generating and analyzing execution traces of an application is a great help for developers who want to optimize their programs. The generation of such traces requires to intercept the calls to a set of key functions – MPI communication primitives, synchronization functions, etc. – and to record events in a file. The instrumentation of a program must not modify its behavior and thus should have an overhead as low as possible.
In this paper, we present a mechanism for intercepting the calls to a set of functions in an application. This mechanism can be used in a perfor-mance analysis tool for generating execution trace. We implemented this
4
We would like to thanks Julien Pedron for his work on the packaging of this method in EZTrace – http://eztrace.gforge.inria.fr
technique in the EZTrace framework for performance analysis. The re-mainder of this paper is organized as follows: Section 2 briefly presents the framework in which our contribution takes place as well as the problems of the instrumentation mechanism that was previously implemented. In Section 3, we present various research related to function instrumentation. The mechanism that we propose and its implementation in EZTrace are described in Sections 4 and 5. Finally, the results of the evaluation of our implementation are reported in Section 6.
2 The EZTrace software
EZTrace [12] is a general framework for generating traces of a program without recompilation. It is able to instrument functions in dynamic li-braries and record events in trace files. Several modules are provided that contains function instrumentations for standard libraries like MPI or pthread. For instance, it can save each call (and the timespamp at which the call happened) to MPI Send into a trace using the mpi module. Moreover, EZTrace provides a simple mean to generate user-defined modules.
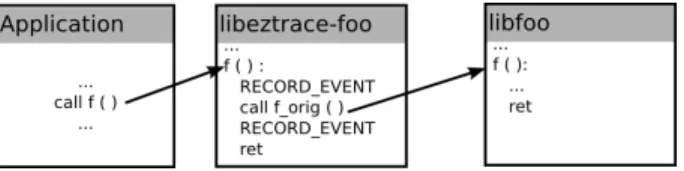
To generate a trace, events have to be recorded before and after each call to specified functions. Recording these events permits to keep track of entry and exit of each function of interest. To do so, EZTrace uses the LD PRELOAD mechanism that preloads shared libraries before any other shared libraries. As depicted in Figure 1, the symbols provided by a preloaded library take priority over other symbols when the symbol res-olution is done. Since EZTrace defines a function f in a library called libeztrace-foo that is preloaded, when the application calls f, the func-tion defined by EZTrace is called. This funcfunc-tion records an event, then calls the original function f that is defined by the libfoo library. When the original f ends, EZTrace records another event and returns to the application.
The LD PRELOAD mechanism used in EZTrace is very simple and very efficient. It has enabled the development of a fast and efficient framework for trace generation. However, it can only instrument functions in shared libraries. Thus, EZTrace cannot intercept calls to functions that are defined in a statically-linked library or within the program.
3 Related work
During the optimization of an application, running the program, collect-ing an execution trace and analyzcollect-ing it is a great help for identifycollect-ing the application bottlenecks. Several tools are dedicated to a particular library or programming model like MPI [13], pthread [3] or OpenMP [4]. In order to analyze applications that use several libraries or programming models as well as user-defined functions, generic tools like Pablo [10], Tau [11] or VampirTrace [8] were developed. These tools provide a set of pre-defined modules for the main programming models used in HPC (MPI, OpenMP, ...) These tools use instrumentation in order to insert probes that record events when a specific function (MPI Send for instance) is called.
The instrumentation can be based on the application source-code: the application is recompiled and functions of interest are instrumented. The main drawback of this technique is that it requires a recompilation of the program.
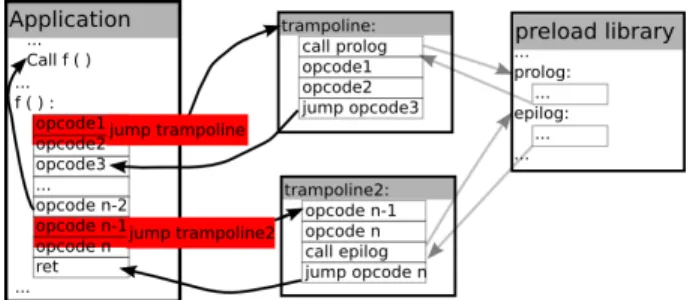
An alternative solution for instrumentation consists in modifying the binary code for inserting probes. To do so, Valgrind [9] relies on par-tial emulation of the machine to enable dynamic rewriting and inserting specific hooks in the system. The list of hooks that Valgrind provides is limited and cannot be easily extended. Moreover, the emulation obviously makes this solution slow in testing high performance programs. PIN [7], DynamoRIO [1], DynInst [2] or MAQAO [6] rely on instruction decod-ing to instrument the code. These tools reverse engineer programs and directly insert opcodes anywhere in the binary. This fine-grain instrumen-tation allows to modify precisely a binary by, for instance, inserting a set of instructions between two opcodes or removing some of the opcodes. Figure 2 depicts how these tools can be used for instrumenting functions such as f: the first opcodes of the function are replaced by a trampoline that calls a prolog function (which is in charge of recording an event in the output trace) before executing the function opcodes. The same oper-ation is performed for inserting a call to the epilog function before the end of the function.
Fig. 2. Instrumentation of the function f with DynInst
These fine-grain instrumentation tools permit to modify precisely an application, but using this kind of mechanism in EZTrace for coarse-grain tracing (recording an event at the entry and the exit of a function) may cause an overhead. It requires to install several trampolines: one should be installed at the entry of the function, and each exit point should be instrumented. Defining a variable in the prolog function and using it in the epilog is also complex to implement. Moreover, there is a major issue if the function exit is located at the beginning of a branch: in that case, complex mechanisms have to be used.
4 Coarse-grain instrumentation in EZTrace
In order to generate an execution trace of an application, EZTrace needs to record events at the entry and the exit of a set of functions (MPI primitives for instance). Using LD PRELOAD for that is very convenient as it permits to write a C function that describes how the function should be instrumented. Moreover, it allows to declare local variables that can be used from the entry to the exit of the function. Figure 3 shows an example of function instrumentation in EZTrace. This code is compiled into a shared library that is preloaded before the application. The f orig variable contains the address of the original function f obtained at the initialization of the instrumentation library.
Since this mechanism can only intercept calls to functions located in a shared library, EZTrace needs an alternative method for statically-linked functions. We propose to design a mechanism similar to LD PRELOAD that is able to instrument these functions. In order to do this, EZTrace needs to replace the original function f with its own version that would be similar to the function depicted in Figure 3. EZTrace function can record events and use the f orig callback to call the original function
double (*f_orig)(int n, double* a); double f(int n, double* a) {
record_event(F_ENTRY, n); double ret = f_orig(n, a); record_event(F_EXIT, ret); return ret;
}
Fig. 3. Instrumenting the function f in EZTrace
f. This requires EZTrace to retrieve the address of the function f and assign it to the f orig callback. When using LD PRELOAD with shared libraries, these steps are achieved thanks to the dynamic linker that as-sociates function names to addresses in the memory space. When the function to instrument is not in a shared library, the address of the func-tion is hardcoded in the binary and EZTrace has to modify the binary program to perform the function interception.
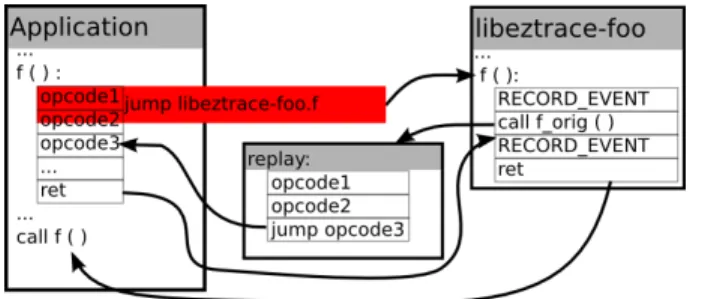
Fig. 4. Instrumentation of the statically-linked function f in EZTrace
The replacement of the function f is depicted in Figure 4: a trampoline to EZTrace’s f is inserted at the entry of the original function f. The overwritten opcodes are relocated in a replay section. At the end of the relocated opcodes, a jump to the remainder of the function is added. The address of the replay code is assigned to the f orig callback. Thus, when the application calls f, the execution flow is redirected to the EZTrace version of the function. EZTrace can collect information and record events before using the f orig callback to call the original function. Once the original function f returns, the remaining instructions of EZTrace’s f are processed.
This mechanism allows to instrument functions located in a statically-linked program. In case the function to intercept is defined in a shared library, the LD PRELOAD mechanism can be used since the instrumentation code remains similar to the one described in Figure 3. Unlike the methods presented in Section 3, this coarse-grain instrumentation only requires to install a trampoline at the entry of the function to instrument. Thus, it is not necessary to solve the complex problems of multiple exit points in the function or exit points located in a branch. Moreover, the intercep-tion funcintercep-tion can declare local variables before the entry of the original function to instrument and use them after its exit.
5 Implementation
We have designed and implemented this mechanism in EZTrace. For instrumenting an application, the following steps are processed:
1. Get the symbols of the function to instrument (f), the replacement function (eztrace f), and the callback to the original function (f orig) by reading the binaries.
2. Run the target program tracing with the ptrace() system call. 3. Fetch the base address of the library containing eztrace f and f orig. 4. Instrument the function f: construct the base trampoline (the jump to eztrace f), the replay code and write the base trampoline and the f orig value in the target process memory.
5. Detach the process and let the target process run.
These steps happen at the application startup, when the process is being launched. In case of an MPI application, these actions are per-formed by each MPI process. Thus, an overhead due to the instrumenta-tion during the startup phase is to be expected. However, we measured that instrumenting 100 functions with EZTrace only delays the startup by 280 ms.
5.1 Collecting the necessary information
In order to get the relative address of a symbol – such as the function to instrument – EZTrace uses the Binary File Descriptor library (BFD). The collected address is relative to the beginning of the ELF section that contains the function. If the symbol is defined in the program or in a statically-linked library, the base address of the ELF section is known and the absolute address of the symbol can thus be found.
If the symbol is defined in a shared library, the base address of the section is known only once the library is loaded. EZTrace thus uses the tracing mechanism and wait for the dlopen() corresponding to the library (an open() on the library followed by a mmap()) in order to determine the base address of the library – and thus the address of the symbol – in the address space.
5.2 Function instrumentation
Once EZTrace knows the addresses of the required symbols (f, eztrace f and f orig), it constructs a base trampoline that jumps from the orig-inal function to the instrumentation function when the former is called as depicted in Figure 4. Since installation of the base trampoline over-writes the first instructions of f, it is required to relocate them before the installation as shown in Figure 4. In order to determine the size of the overwritten instructions, EZTrace can rely on the libopcodes. If it is not available, EZTrace implements an alternative method that con-sists in single-stepping the instructions and observing how the instruction pointer is modified. A memory space is allocated in the target process to install the relocated code (using mmap()). Once the base trampoline and the replay code are installed, the address of the replay code is assigned to f orig in the target process (using ptrace()).
5.3 Discussion
The model we propose has been implemented in EZTrace and will be integrated in the 0.8 release as open-source. This model is not specific to EZTrace and it could be integrated in other performance analysis tools. Our implementation currently only supports Linux, but it is appli-cable to other systems like Mac OS X or FreeBSD. Porting this method to these systems is part of our future work. Also, in order to construct the trampoline, machine-dependent code is needed. Since we restrict the architecture-specific code to the minimum, this part of the code is very limited (less than 300 lines of code) compared to the architecture-specific code in other tools like DynInst or PIN. Therefore, porting our code to other architectures requires little effort.
6 Evaluation
Since instrumenting an application and collecting information during its execution increases the number of instructions to execute, it is expected
that our implementation implies an overhead compared to running the application without instrumentation. In this Section, we evaluate this overhead and we compare EZTrace to other tools that can be used for instrumentation : DynInst 7.1 and PIN 2.11. The results presented here were obtained on an Intel Xeon X5550 at 2.67 GHz.
6.1 Raw overhead
In order to evaluate the raw overhead of our implementation, we use a program that calls repeatedly an empty function (compute) located in a library. The program is linked either statically or dynamically against the library depending on the interception method to analyze. We instru-ment this program by counting the number of times the program enters the function and the number of times it leaves the function. The instru-mentation with PIN and DynInst thus consists in inserting a call to the counting function (count calls) at the entry and the exit of the function. With EZTrace, the entry of compute is replaced with a call to ezt count calls that increments a variable, calls compute and incre-ments another variable.
Table 1 shows the average duration of an iteration in this program. In the case of the shared library, DynInst failed to instrument the pro-gram. The results show that the instrumentation with PIN, DynInst and EZTrace cause a light overhead comprise between 5 and 25 ns.
Interception method no instrumentation PIN DynInst EZTrace
Statically linked library 4.7 ns 20.2 ns 28.8 ns 12.3 ns
Shared library 5.2 ns 24.0 ns - 11.3 ns
Table 1. Function duration when counting the number of calls to a function
Since the goal of our instrumentation tool is to generate execution traces, we run the same experiment, but instead of modifying a variable at the entry and exit of compute, we record two events in a trace file using the FxT library [5]. The results of this experiment are reported in Table 2. Recording an event being more time consuming than modifying a variable, the measured overheads are higher. The results show that the overhead of EZTrace is lower than for DynInst and PIN. However, because of FxT internals, we observed large variations in this overhead gain depending on the computer used.
Interception method no instrumentation PIN DynInst EZTrace
Statically linked library 4.7 ns 1287 ns 1294 ns 245.2 ns
Shared library 5.3 ns 1293 ns - 227.4 ns
Table 2. Function duration when recording events during a function call
6.2 Overhead on an application
In order to evaluate the overhead of the instrumentation on a real life application, we instrumented an OpenMP application that computes a MD simulation. By recording events at the entry and exit of each function of this application, the resulting trace consists in 7,941,671 events.
Interception method no instrumentation PIN DynInst EZTrace
Execution time (s) 0.45 3.16 3.28 2.26
Overhead (ns / iteration) +0 +341 +413 +227
Table 3. Execution time of a molecular dynamics simulation using 4 OpenMP threads
The execution times of the application are reported in Table 3. While PIN and DynInst cause an overhead of approximately 350 ns per event, instrumenting this application with EZTrace only degrades the perfor-mance by 227 ns per event. This is due to the way EZTrace instruments the functions: instead of inserting several trampolines, EZTrace only disrupts the processing flow once.
7 Conclusion
Nowadays, high performance computing (HPC) relies on a high level of hybrid parallelism. To analyze HPC programs, tracing tools with low overhead are needed. Performance analysis tools such as EZTrace can install function hijacks and trace calls to shared library functions us-ing a LD PRELOAD mechanism. However, this method cannot apply for statically-linked functions.
In this paper, we described a method that permits to instrument a statically-linked function using a mechanism similar to LD PRELOAD. Our mechanism improvements to other techniques are: 1/ all the instrumen-tation is done in the process initialization and have minor impact on the process performance, 2/ a clever design of the instrumentation makes our system easy to use by leveraging C calling mechanism and 3/ the use of
ptrace() to detect library loading and to allocate memory in the target process makes the amount of machine-depend code really low.
Therefore, our method is much less complex than other methods such as the ones implemented in DynInst and PIN and has better perfor-mance. It is also to be noted that DynInst is particularly difficult to install and relies on non-standard libraries that may be missing in many systems. Also, PIN is for Intel-based CPU only. Our method is fully inte-grated into the EZTrace software and we plan to port this mechanism to other systems (Mac OS X and BSD) as well as other CPUs (ARM). References
1. Bruening, D., Garnett, T., Amarasinghe, S.: An Infrastructure for Adpative Dy-namic Optimization. In: International Symposium on Code Generation and Opti-mization (CGO-03) (2003)
2. Buck, B., Hollingsworth, J.: An API for runtime code patching. International Jour-nal of High Performance Computing Applications 14(4), 317–329 (2000)
3. Bull, S.: NPTL Stabilization Project. In: Linux Symposium. p. 111 (2011) 4. Caubet, J., Gimenez, J., Labarta, J., DeRose, L., Vetter, J.: A dynamic tracing
mechanism for performance analysis of OpenMP applications. OpenMP Shared Memory Parallel Programming pp. 53–67 (2001)
5. Danjean, V., Namyst, R., Wacrenier, P.: An efficient multi-level trace toolkit for multi-threaded applications. Euro-Par 2005 Parallel Processing pp. 622–622 (2005) 6. Djoudi, L., Barthou, D., Carribault, P., Lemuet, C., Acquaviva, J., Jalby, W., et al.: Maqao: Modular assembler quality analyzer and optimizer for itanium 2. In: The 4th Workshop on EPIC architectures and compiler technology, San Jose (2005)
7. Luk, C.K., Cohn, R., Muth, R., Patil, H., Klauser, A., Lowney, G., Wallace, S., Reddi, V.J., Hazelwood, K.: Pin: Building Customized Program Analysis Tools with Dynamic Instrumentation. In: PLDI 2005 (2005)
8. Muller, M., Knupfer, A., Jurenz, M., Lieber, M., Brunst, H., Mix, H., Nagel, W.: Developing scalable applications with Vampir, VampirServer and VampirTrace. Proceedings of the Minisymposium on Scalability and Usability of HPC Program-ming Tools at PARCO (2007)
9. Nethercote, N., Seward, J.: Valgrind: A Framework for Heavyweight Dynamic Bi-nary Instrumentation. In: ACM SIGPLAN 2007 Conference on Programming Lan-guage Design and Implementation (PLDI 2007) (2007)
10. Reed, D., Roth, P., Aydt, R., Shields, K., Tavera, L., Noe, R., Schwartz, B.: able performance analysis: The Pablo performance analysis environment. In: Scal-able Parallel Libraries Conference, 1993., Proceedings of the. pp. 104–113. IEEE (2002)
11. Shende, S., Malony, A.: The TAU parallel performance system. International Jour-nal of High Performance Computing Applications 20(2), 287 (2006)
12. Trahay, F., Rue, F., Namyst, R., Faverge, M.: EZTrace: a generic framework for performance analysis. In: CCGrid’2011 (2011)
13. Vetter, J., de Supinski, B.: Dynamic software testing of MPI applications with Umpire. In: Supercomputing, ACM/IEEE 2000 Conference. p. 51. IEEE (2006)