HAL Id: hal-01753250
https://hal.archives-ouvertes.fr/hal-01753250
Submitted on 6 Oct 2020
HAL is a multi-disciplinary open access archive for the deposit and dissemination of sci-entific research documents, whether they are pub-lished or not. The documents may come from teaching and research institutions in France or abroad, or from public or private research centers.
L’archive ouverte pluridisciplinaire HAL, est destinée au dépôt et à la diffusion de documents scientifiques de niveau recherche, publiés ou non, émanant des établissements d’enseignement et de recherche français ou étrangers, des laboratoires publics ou privés.
Supercritical water conversion of glycerol : comparative
parametric study between batch and continuous process
Qian Wu, Silviu Bulza, C. Corcoveanu, Elsa Weiss-Hortala, Radu Barna,
Anne Loppinet Serani, Cyril Aymonier
To cite this version:
Qian Wu, Silviu Bulza, C. Corcoveanu, Elsa Weiss-Hortala, Radu Barna, et al.. Supercritical water conversion of glycerol : comparative parametric study between batch and continuous process. 13th European meeting on supercritical fluids, Oct 2011, The Hague, Netherlands. 12 p. �hal-01753250�
1
Supercritical Water Conversion Of Glycerol:
Comparative Parametric Study Between Batch And
Continuous Process
Q. Wu*1, S Bulza2, C. Corcoveanu2, E. Weiss-Hortala1, R. Barna1, A. Loppinet-Serani3, C. Aymonier3 1 Université de Toulouse ; Mines Albi ; CNRS ; Centre RAPSODEE, Campus Jarlard, F-81013 Albi cedex
09, France
2 Universitatea Politehnica, Facultatea de Chimie Industriala, 300006 Timisoara, Romania 3 CNRS, Université de Bordeaux, ICMCB, IPB-ENSCBP, 87 avenue du Dr. A. Schweitzer, 33608 Pessac
Cedex, France
*Corresponding author: [email protected], tel: +33 (0)5 63 49 32 40, fax +33 (0)5 63 49 32 43
• Glycerol, a main by-product of the biodiesel production, has a high valorization potential. This paper proposes a comparison of hydrogen production from glycerol using batch (5 mL and 500 mL) and continuous (100 mL) processes. The influence of different operating parameters has been studied: temperature (450°C-600°C), pressure (20-28MPa), glycerol concentration (5-20wt%), catalyst concentration (K2CO3 or NaOH, 0-5
wt%), reaction time (5-120 min, batch), residence time (12 min, continuous process), stirring rate (500-1500 rpm, batch of 500ml), and heating rate (50% and 100% of heating power).
• Quantitative glycerol conversion has been observed: until 99% of TOC removal by SCWG. While the amount of solid formed is insignificant, the produced gas volume reached 43 L gas/L solution (5 wt% glycerol) with a molar composition up to 60% H2
and 30% CO2 (atmospheric pressure). Various proportions of CH4, C2H6 and C2H4 have
been observed. Catalyst contribution to the gasification yield of glycerol is relevant.
• SCW conversion of glycerol, quantitative by-product in biodiesel industry, into hydrogen is a sustainable process. The yield obtained in the continuous laboratory reactor (3 mol H2/L of reactor/h) under homogeneous catalysis (K salts, low
concentrations) recommends the process for further research and pilot development.
• Key-words: Glycerol, K2CO3, NaOH, Hydrogen, Supercritical water, Batch,
Continuous reactor 1. INTRODUCTION
• Biodiesel is a clean renewable fuel that is becoming increasingly attractive to replace fossil fuels. The transesterification process of biomass which produces biodiesel, by-product such as glycerol should be enhanced. One of the investigated issues was its supercritical water gasification (SCWG) into hydrogen.
• Super Critical Water Gasification (SCWG: P>22.1 MPa, T>374°C) is a novel way where water is both solvent and reactant [1] [2]. Under these conditions, water dissolves gases and organic compounds in a homogeneous phase. Biomass can be rapidly decomposed into small high-energy-rich substances (hydrogen and light hydrocarbons) with a neutral CO2 balance under these conditions. The process is considered
advantageous for biomass or organic residues with high water content (>30%). It allows the separation of H2 at high pressure from the solution containing dissolved CO2,
favoring sustainable solutions for its use/storage. Large-scale industrial processes have not been implanted [3]. The global reaction expected for glycerol conversion in supercritical water is as follows: (1)
• However, the process is more complex. Different concurrent/parallel reactions can occur to produce carbon monoxide and/or light hydrocarbons (methane, ethane …). Carbon monoxide can react with water at high temperature, in the presence of a catalyst,
2 to produce hydrogen and carbon dioxide (water gas shift reaction
(WGSR): (2)).
• The particular properties of water in the region of its critical point (including salt precipitation) lead to the quantitative hydrolysis and the decomposition of biomass or organic residues into simpler molecules, that react to form different products distributed between gas, liquid and solid phases [2]. Owning to its complexity and various composition (mixture of organic compounds and salts), crude glycerol is often replaced by pure glycerol which acts as a model molecule [4].
• Watanabe et al. [5] showed that the addition of H2SO4 enhanced the conversion of
glycerol into acrolein near the supercritical point. A more comprehensive study of reaction mechanisms showed that a long reaction time favored the gasification rather than the acrolein production [6]. Antal et al.[7] showed a quasi-total conversion of glycerol into gas with carbon-based catalyst, but they noticed an important catalytic effect of the reactor surface. Other studies were carried out with various catalysts: Ru/Al2O3 [8], Na2CO3 [9] or Ru/ZrO2 [10]; Ru-based catalysts are efficient in converting
glycerol into hydrogen during a short reaction time, but solids are recovered. In the present study, alkali salts were used to promote the water gas shift reaction [11] [12] [13] and to model inorganic compounds of a real biomass. Our paper proposes an innovative recovery issue for this residue via a multiscale batch/continuous approach.
2. MATERIALS AND METHODS 2.1 Reactor and reagents
• All the mini-autoclaves (5 mL) were in stainless steel 316. They were designed to resist to a maximum pressure of 30MPa and temperature of 600°C. The reaction was conducted with 5 mini-autoclaves simultaneously in the muffle oven (Nabertherm L5/11/P320) that was preheated to target temperature. A heating time of 10 min was required to reach the desired temperature in the reactors. After a certain reaction time (5-120 min), autoclaves were cooled down to room temperature (25 ± 2°C) for about 26 minutes and the phases were separated. The total amount of gas recovered was calculated using the sampling system volume (16.7 mL) and the overpressure obtained. One stirring autoclave (500 mL) consisted of an outer shell in Inconel 718, in which a reaction shell in stainless steel 316 was installed. The operating conditions can reach up to 500°C and 30MPa. Electric resistance insured the heating and the cooling was achieved by injecting cold air around the autoclave. The heating rate can reach 20°C min-1. The installation was controlled by a control system allowing regulating the stirring rate, the temperature and the pressure during the experiment. For those both batch processes, the operating pressure varied as function of the mass of the solution and reaction temperature.
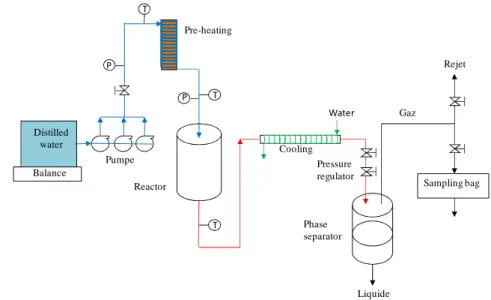
• Figure 1 shows the continuous process developed by I.C.M.C.B.. The reactor of 100 mL in Inconel 625 was designed to accept maximum values of 30 MPa and 500°C. The residence time was about 10 minutes with an input of 600g/L. The reactor was heated by electric resistances coiled around the outer surface of reactor and was isolated by the asbestos. A back-pressure regulator at the downstream of reactor allows controlling the operation pressure. At the beginning of a run, water was pressurized and pumped in to the reactor throughout of pre-heating. The reactor was heated to the desired temperature and was held to the operating pressure. When the system was stabilized, water was replaced by biomass solution injected into the reactor. The outer effluent of reactor was depressurized in a phase separator.
3 • Distilled water Balance P T T P T Pumpe Pre-heating Reactor Cooling Water Pressure regulator Phase separator Liquide Gaz Rejet Sampling bag
Figure : Schema of continuous process of ICMCB
• Glycerol (C3H8O3, 99.5-100%, Fisher Scientific) and ultra-pure water were used as
raw materials. Glycerol concentration varied from 5 to 32wt%. K2CO3 (99.0-100.0%,
Prolabo) and NaOH (99.0-100.0%, Prolabo) were used as the catalyst in a range of 0-1.5 wt%.
2.2 Chemical analysis
• For the discontinuous process, the gas product was analyzed by a gas chromatograph (Agilent GC-3000 with 4 columns (module A: molecular sieve; module B: Plot U; module C: Aluminum; module D: OV-1) and 4 TCD detectors. For the continuous process, the gas analyses were achieved by a Micro GC-TCD (CP 4900-Colonne: Molsieve SA plot) and a GC-FIT (GC Star 3600 CX-Colonne : Carbowax et DB1). H2,
N2, CO, CH4, O2 were analyzed by micro GC, some light hydrocarbures and CO2 were
analyzed by GC 3600. The gas is composed of H2, CO2, CO, CH4, C2H6, C2H4 and C3H8.
The results presented are the average value of gas analysis. A TOC analyzer (Shimadzu TOC-5050) measured the total amount of carbon (organic and inorganic) in the liquid phase after the reaction. The metals were detected by a ICP (ULTIMA 2).
2.3 Terms and definitions
Yield of each gas (Yi): (3)
Gasification efficiency in weight (GE): (4)
Efficiency of carbon gasification (CGE): (5)
Specific production of H2 (PH2): batch (6)
Continuous reactor (7)
Specific overall gas production (Y): (8)
• The residence time was the passage time for the continuous reactor and the reaction time at a given reaction temperature for the batch processes.
• Efficiency of conversion of carbon to methane in molar (CE CH4)
4
TOC removal (XTOC): (10)
• With: : Initial total organic carbon, [TOC]: Residual total organic carbon
Ratio of residual TOC (TOC residual): (11)
3. RESULTS
• At first, the results concerning the batch reactors are presented. The influence of operating conditions such as temperature, reaction time, glycerol concentration and catalyst were studied. However, the comparison of batch and continuous process implies technical differences especially about the heating time (or rate) and stirring rate in batch reactor. Then the comparison of the two processes is detailed.
3.1 Influence of reaction temperature
• Figure 2 (a) shows the yield of main gas obtained at different gasification temperature (450-600°C). The main components were H2, CO2, CH4 and C2H6. As seen in Figure 2
(a), the yield of hydrogen increased with the temperature until 525°C and then decreased to a stable value. On contrary, the yield of CO2, CH4 and C2H6 increased with the
temperature. The maximum yield of hydrogen was obtained at 525°C (1.45 mol/mol glycerol) and the value was higher than that of CO2 (1.2 mol/mol glycerol). The ratio
between YH2 and YCO2 was 1.2, lower than the theoretical value (YH2/Y CO2=2.3). The
theoretical value was achieved while the temperature reached 800°C [8]. CO appeared only at 450 and 500°C (not shown). The disappearance of CO and the increase of CO2
could be explained by the contribution of WGSR, where the excess of water promoted the generation of H2, CO2 and the consumption of CO. In addition, the K2CO3 catalyst
improved the WGSR following the mechanism proposed by A. Kruse [14] where CO reacted rapidly with KOH (product of K2CO3 decomposition in water) to produce
intermediates then H2 and CO2. The increase of CH4 yield while the yield of H2
decreases above 525°C could be explained by the competition between the WGSR and the reaction of methanation ( (12)).
Figure 2: Influence of temperature on the yield of product gas (a) and GE, CGE, PH2 (b) (450, 500, 525, 550 and
600°C, 25MPa. [Glycerol]=5wt%, [K2CO3] =0.5wt%, reaction time 60min).
• Figure 2 (b) shows gasification efficiency (GE), carbon gasification efficiency (CGE)
and specific production of hydrogen (PH2) as function of temperature. GE and CGE
increased with the temperature then decreased slightly above 550°C. The maximum of GE (84%) and the CGE (80%) were obtained at 550°C. The variation of PH2 had the same
trend as GE, but the maximum of PH2 (37%) was achieved at 525°C. TOC removal in the
5 liquid phase (not shown) increased from 64% to 99% with the temperature (450-600°C) indicating that the mineralization was achieved at 600°C while a few amount of solid was formed.
• According to the previous results, we could consider that a high temperature enhanced the efficiency of gasification and the production of hydrogen. In the presence of the catalyst (K2CO3), a temperature of 550°C was suitable to obtain a maximum amount of
H2 in 60 min.
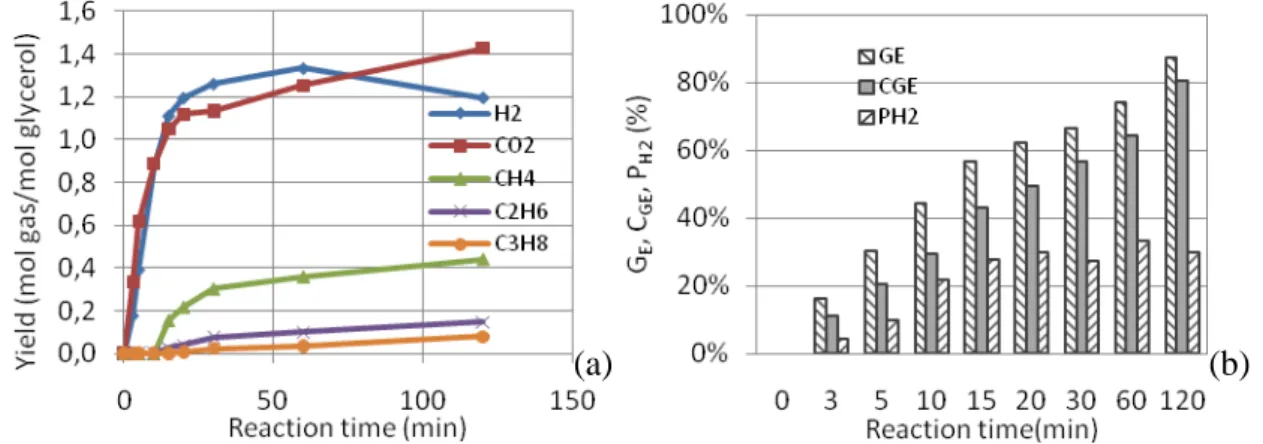
3.2 Influence of reaction time
• Figure 3 (a) shows the yield of main gas obtained as function of time reaction (0-120 min). During the first 20 min, the yields of H2 and CO2 increased linearly and then
increased moderately until 60 min. On the other hand between 60 and 120 min the yield of H2 decreased while the yield of CO2 increased to reach 1.25 and 1.41 mol/mol
glycerol respectively. CH4 was detected after 10 min and then its yield slowly increased
from 10 to 30 min and stabilized at about 0.4 mol/mol glycerol. The results clearly showed that reaction kinetics influenced strongly the production of hydrogen during the first period of the reaction. Figure 3 (b) also indicates that GE, CGE, PH2 increased
significantly while the reaction time increased. During the first 20 minutes, these three indexes were increasing dramatically; especially the PH2 reached 30% after 20 min and
then stabilized over 60 min. At 120 min, PG, CGE, PH2 reached their maximum values
(85%, 76%, and 32%).
Figure 3: Influence of reaction time on the yield of product gas (a) and GE, CGE, PH2 (b) (525°C, 25MPa.
[Glycerol] = 5wt%, [K2CO3] = 1.5wt%, 3-120min)
• The results showed that 30 minutes was appropriate to have a better hydrogen production while 60 min favored higher gasification efficiency of solutions containing 5wt% of glycerol.
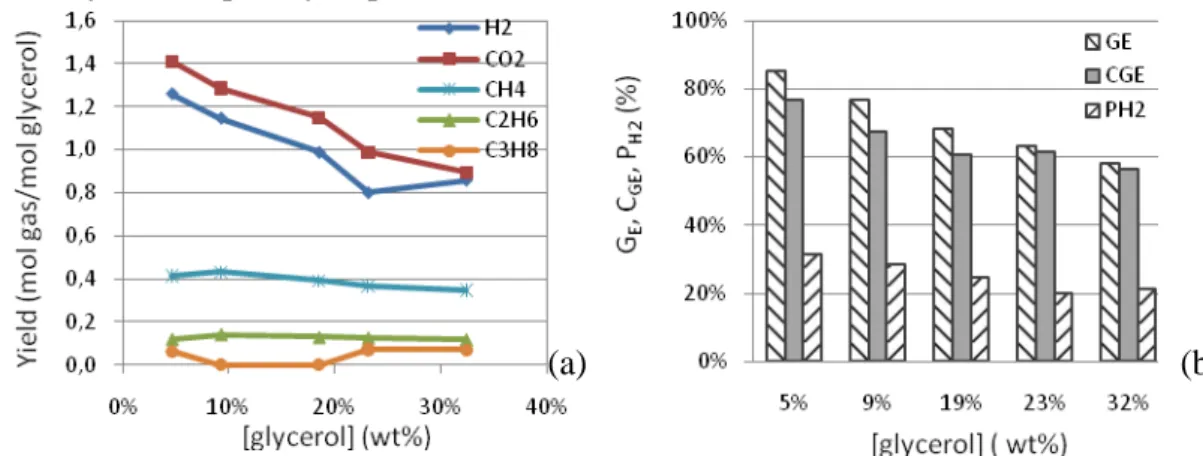
3.3. Influence of glycerol concentration
• The experiments were carried out in batch mini-autoclaves using various glycerol concentrations (5-32 wt %). As shown in Figure 4 (a), the production of H2 and CO2
decreased by increasing the glycerol concentration while that of CH4, C2H6 and C3H8
varied slightly. Figure 4 (b) shows that GE, CGE, PH2 decreased significantly while the
glycerol concentration increased from 5 to 32wt%. The trend is in accordance with [8]. The residual TOC in liquid phase and the amount of solid rose with the increase of glycerol concentration. The residual TOC and the solid issued from an initial concentration of 32wt% were respectively 4.8 and 6.3 times higher than those of a 5wt% initial concentration. This phenomenon might be explained by radical reactions [6].
Organic substances, issued from the degradation of glycerol, appeared as radicals in the supercritical phase. A high glycerol concentration increased the chain propagation and
6 the chain termination of the radical reaction. Accordingly, the polymerization occurred more easily and frequently to produce more solids.
Figure 4: Influence of glycerol concentration on the yield of product gas (a) and GE, CGE, PH2 (b) (525°C, 25MPa.
[Glycerol]=5-32wt%, [K2CO3] =1.5wt%, reaction time 60min).
• As conclusion, the glycerol concentration was a major limitation for the process. A low concentration was suitable to gasify the glycerol in SCW and hinder the formation of solids even using a catalyst.
3.4 Influence of catalyst concentration
• The influence of catalyst (K2CO3) was investigated at different temperatures and at a
given temperature but using various concentrations. Table 1 presents the yield of each gas as function of temperature for experiments carried out with or without catalyst.
T (°C) 450 500 600
Yield (mol gas/mol glycerol)
without cat. with cat. without cat. with cat. without cat. with cat.
H2 0.36 0.90 0.56 1.36 0.93 1.13 CO2 0.39 0.81 0.72 1.06 1.24 1.38 C2H6 0.01 0.01 0.07 0.06 0.29 0.21 C2H4 0.01 0.01 0.02 0.02 0.01 0.00 CH4 0.00 0.04 0.17 0.18 0.52 0.51 C3H8 0.00 0.00 0.05 0.07 0.00 0.00 CO 0.03 0.00 0.12 0.00 0.00 0.00 GE, CGE, PH2 (%)
without cat. with cat. without cat. with cat. without cat. with cat.
GE 21 42 47 63 80 84
CGE 15 30 45 53 79 77
PH2 9 22 14 34 23 28
Table 1: Influence of catalyst at different temperature on the yield of product gas and GE, CGE, PH2
(450, 500, 600°C, 25MPa. [Glycerol]=5wt%, [K2CO3] =0.5wt%, reaction time 60min)
• As shown in the Table 1, the catalyst had a remarkable influence on the hydrogen production at whole temperature range. The gas produced contained mainly H2, CO2,
CH4 and a few amount of C2H6, C2H4. Some traces of C3H8 and CO appeared at 500°C
and then disappeared when the temperature increased. The yields of H2 and CO2
increased substantially by using K2CO3, however, YH2 decreased in the presence of the
catalyst while the temperature increased from 500 to 600°C. This behavior could be due to a different thermodynamic equilibrium (favoring methanation) or to a different efficiency of the catalyst as function of temperature.
• GE, CGE, PH2 increased linearly with the temperature with or without catalyst. In the
presence of the catalyst, the three values were always higher than those without catalyst
7 except CGE at 600°C where a slight decreased occurred. The previous phenomenon was
emphasized at the relatively low temperature (450-500°C), for example, at 450°C, GE
with catalyst was two times greater than that without catalyst.
• The previous results showed that the catalyst improved the gasification efficiency and the hydrogen production in the whole temperature range. The catalyst (K2CO3) allowed
reducing the temperature of gasification. The increase of PH2 and the disappearance of
CO indicated that K2CO3 also helped to change the composition of the gas. Experiments
were also carried out to investigate the influence of catalyst concentration during the gasification at 525°C. The catalyst concentration had a few influence on the composition of the gas phase (not shown). However the nature of the catalyst conducts to various gasification efficiencies as mentioned in the literature [6] [7] [8] [10]. According to the results K2CO3 allowed to reduce the reaction temperature, improved the efficiency of
gasification, increased the hydrogen production and inhibited the CO production. However, to compare the batch and the continuous process, stirring and heating rate in the batch reactor should be studied.
3.5 Influence of stirring rate and heating rate
• The experiments about the influence of stirring rate and heating rate were conducted in the batch reactor of 500 mL (EMAC). At first, the stirring rate was varying from 500 to 1500 rpm. The composition and the volume of the gas obtained were not influenced by the stirring rate (not shown).
• In the batch process, the temperature profiles as function of time using two different heating rates are shown in Figure 5 (a). The heating rate was controlled by the percentage of heating power (50 and 100% were investigated). Once the target temperature was reached, the heating was stopped immediately and the temperature dropped down quickly.
Figure 5: Profile of temperature with time(a),-Influence of heating rate on the yield of product gas (b) and GE,
CGE, PH2 (C) (450°C, 25MPa.[Glycerol]=5wt%, [K2CO3]=1.5wt%, reaction time: 0min, 50%, 100% of heating
power)
• As seen in Figure 5 (b) and (c), the yields of gas and the efficiency parameters (GE,
CGE, PH2) decreased slightly with the heating rate. While the time to reach a temperature
of 450°C was 4 times shorter at 100% power the gasification efficiency is just slightly lower. This result indicated that the heating time has an influence on the volume and composition of the gas but the reactions should be playing a role only close to the target temperature minimizing the effect of heating time. However a long heating time was not profitable because the gas production is limited and the energy consumption is higher. The influence of numerous parameters was studied in the batch reactor and the conclusion was to select the operating conditions to compare to the continuous process.
3.6 Comparison of continuous and discontinuous processes
8
• A performance comparison between continuous and discontinuous processes is described in this part. The goal is to study the influence of catalyst at both processes. K2CO3 and NaOH were chosen as the alkaline catalyst. NaOH was widely used in the
transesterification reaction where the glycerol was a by-product, as consequence the crude glycerol contained NaOH. NaOH is an alkaline salt that could also catalyze the gasification of glycerol. The continuous reactor of 100 ml (ICMCB) and the batch reactor of 500 ml (EMAC) were used. The comparison of the two processes was based on the following indexes: the specific overall gas production, gasification efficiency, rate of residual TOC …
• For both processes, the temperature and the pressure were maintained at 450°C and 25 MPa, the concentration of glycerol and K2CO3 were respectively 5wt% and 1.5wt%.
For the continuous process NaOH concentration was 1.5wt%. The gas was sampled after 45 minutes of stable state. The residence time was about 11 minutes with a throughput of 550 g h-1. In batch process, NaOH concentration was reduced to 400ppm since the solubility of NaOH in supercritical water was low [15]. The residence time at 450°C was 60 min.
3.7.1 Specific overall gas production
• As shown in Figure 6, the alkaline catalysts improved significantly the gas production during the gasification of glycerol in continuous process, especially with K2CO3. The
specific overall gas production (Y) was 11 times better than that without catalyst and was 1.3 times better than that with NaOH. In the batch reactor, the influence of the catalyst was almost identical with continuous process, but their values were close. The Y obtained with K2CO3 was slightly higher than that of NaOH and 1.7 times better than
that without catalyst.
Figure 6: Comparison of the influence of catalyst on the specific overall gas production of the gasification of glycerol in continuous and discontinuous process (450°C, 25MPa, 550g/h (continuous), [glycerol] =5wt%, [K2CO3] =1.5
wt%, [NaOH] =1.5wt% (continuous), [NaOH] =0.04 wt% (batch), passage time: 11min in the continuous process, 60min in batch at 450 °C).
• Whatever the continuous or the discontinuous process, K2CO3 and NaOH improved
the specific overall gas production. For the continuous process, the gasification behavior was different while the reaction was conducted with or without catalyst. In batch process, this difference is substantially reduced. This discrepancy between two processes was due to the residence time in reactor. In fact, the residence time was 11 min in the continuous reactor and 60 min in the batch reactor indicating the thermodynamic equilibrium was not certainly achieved in continuous process.
• The results of Figure 6 indicate that the gasification in the continuous process with alkaline catalyst produced a higher quantity of gas than in batch reactor. However, the
9 mass flow of continuous reactor was 550 g h-1 while the batch treated 69 g solution in one hour. The continuous process could probably not reach chemical equilibrium in a shorter reaction time, but alkaline catalyst greatly increased the efficiency of gasification.
• In the presence of K2CO3, for a running time of 60 min, the ratio between the volume
of gas produced and the volume of liquid treated were 24 for the continuous process (gas: 13.3 L, liquid: 0.55 L) and 55 for the batch (gas: 3.9 L, liquid 0.07 L). This fact shows that the net profitability of the batch running for 60 minutes was better, but the quantity treated was very limited. In the contrary, for a running time of 13 min; this ratio of batch reduced to 14, it indicates that the net efficiency of gasification was much lower than that of continuous process in a short reaction time.
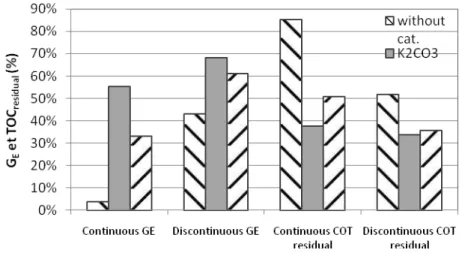
3.7.2 Gasification efficiency and residual TOC
• Figure 7 presents that the gasification efficiency (GE) of continuous process was very
low for the experiments without the catalyst and was associated with a high percentage of TOC residual (TOCresidual). In these operating conditions, only 15% of initial TOC
were converted to gas or inorganic carbon in the liquid. The alkaline catalyst improved significantly the GE and K2CO3 was more effective than NaOH. For the batch process, the
catalyst improved slightly the performance of gasification and its influence was less visible than that of continuous process.
Figure 7: Comparison of the influence of catalyst on gasification efficiency (GE) and the rate of residual TOC (TOC residual) of the gasification of glycerol in batch and discontinuous process (operating condition: identified
with figure 7)
• In case of continuous process, the TOCresidual was very high in the absence of catalyst
(85%). In the presence of alkaline catalysts (K2CO3 and NaOH), the TOCresidual was
between 30% and 55%. This shows that the catalyst could convert at least 50% of organic carbon present in the initial liquid phase to others phase (solid or gas). In batch reactor, the TOCresidual varied from 30% to 70% with or without the catalyst. The
experiment with the catalyst had more advantages for the conversion of TOC.
• Theoretically, the alkaline salts catalyze the water gas shift reaction, but it has no influence on the amount of organic compounds in the liquid phase. However, the behavior of gasification shows that the catalysts and / or the reaction time influence the process of gasification reaction of organic molecules.
• The GE for the discontinuous process was better than that of continuous process in all
cases, especially for the experiment without the catalyst, where it was 10 times higher. The different reaction times could explain this fact, because the gasification was more achieved with a longer reaction time in batch reactor. In the presence of catalyst, the
10 effect of reaction time was less remarkable than that without catalyst. However the gain in gasification efficiency was more important using NaOH (33% to 61%) than using K2CO3 (55% to 68%). During a relatively short residence time in a continuous process,
K2CO3 was more efficient.
• In conclusion, the alkaline catalyst improved the efficiency of the gasification; K2CO3
had a better influence than NaOH in both processes. The reaction time was a key factor in the experiments without catalyst.
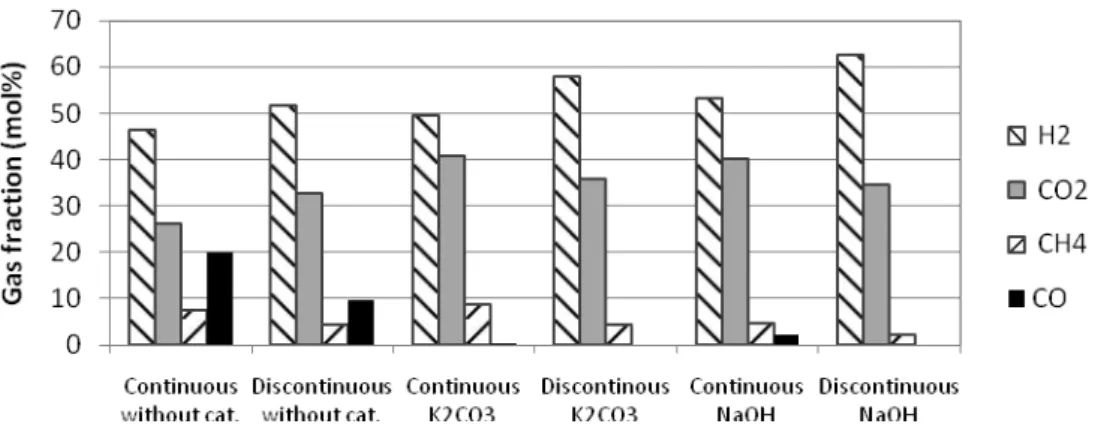
3.7.3 Composition of gas phase
• Figure 8 shows the composition of the gas phase (H2, CO2, CH4 and CO) obtained
during the previous experiments. Few amounts of C2H4, C2H6 and C3H8 were detected
with the batch.
Figure 8: Comparison of the influence of catalyst on gas composition in the gasification of glycerol solutions in continuous and discontinuous process (operating condition: identified with figure 7)
• For the continuous process, the catalyst reduced efficiently the amount of CO (from 20% to 0.4 and 2.1%). According to literature, CO was detected with continuous processes [16]. This fact was in accordance with the role of alkaline catalyst in the water gas shift reaction (help to consume the CO)[17]. The molar fractions of H2 were in the
same range regardless of experience. However, it increased slightly with K2CO3 and a
little more with NaOH. Hydrogen was not only obtained by the transformation of glycerol, but also the product of WGSR and it could be consumed by the methanation reaction. The final yield was the result of a balance between several reactions. The proportion of CO2 was lower for the experiment without the catalyst, but the presence of
CO and the low yield of gasification were not benefiting these operating conditions. With the catalyst, this proportion remained stable. The molar fraction of CH4 was low in
all cases, but its value was different. With NaOH, the CH4 fraction was the lowest and it
was almost stable using K2CO3 or without catalyst. The use of NaOH in comparison to
K2CO3 increased the amount of H2 and CO but reduced that of CH4. This fact indicated
that the methanation reaction is less favored under these conditions.
• In the case of the batch experiments, the CO was not detected in the gas phase using the catalyst while 10% of CO was found without catalyst. This phenomenon could be explained by two reasons: 1. The alkaline catalyst promoted the WGSR to consume the CO and to generate the H2, 2. a long reaction time in batch reactor let to reach the
equilibrium of reaction, where the concentration of CO was low. The molar fractions of H2 were beyond 50% and reached 62.5% in the presence of NaOH. The molar fraction of
CO2 was less than 36% for all experiments. The amount of CH4 decreased significantly
11
• The gas composition in both processes was almost identical. The molar fraction of H2
in batch (52%-62%) was always higher than that of continuous process (46%-53%) regardless of whether the catalyst was used or not. This fact could be explained by the reaction time. With the catalyst, the CO2 fraction varied slightly in batch reactor and was
less than that of continuous process. The amount of CO2 was slightly lower using NaOH
than that using K2CO3. K2CO3 favored the generation of CO2 comparing to NaOH. It
could be explained by the decomposition of K2CO3 into carbonic acid that might be
dissolved in the liquid or evaporate to gas phase as CO2.
• Also the alkaline catalyst increased the H2 fraction and reduced efficiently the CO
amount in both processes. The reaction time influenced significantly the composition of the gas phase.
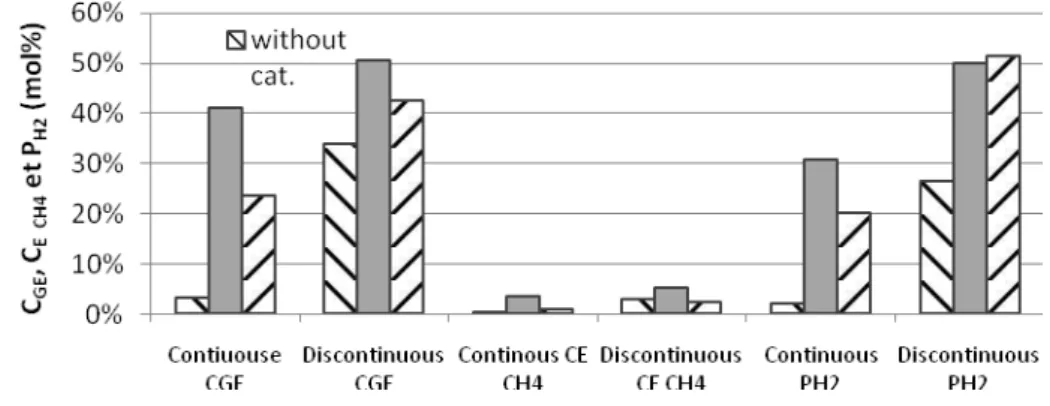
3.7.4 Efficiency parameters
• As shown in Figure 9, the efficiency of carbon gasification (CGE) in batch reactor was
better than that of continuous process, particularly without catalyst. CGE in batch reactor
(34%) was 11 times higher than that of continuous process (3%). By using catalyst, CGE
was better than without (1.3 times for K2CO3 and of 1.8 times for NaOH). K2CO3 had
more effect than NaOH on the carbon gasification.
Figure 9: Comparison of the influence of catalyst on CGE, CE CH4 and PH2 in the gasification of glycerol solutions in
continuous and discontinuous process (operating condition: identified with figure 7)
• Figure 9 shows that efficiency of carbon conversion into methane (CE CH4) was low (5
mol %) regardless of the operating conditions. This value was lower than another model compounds of biomass (glucose> 11%, not shown). In continuous process, the CE CH4
was almost zero for the experiment without catalyst and K2CO3 promoted more
efficiently the conversion of carbon into methane than NaOH. CE CH4 of batch results was
higher than that of continuous process and could be explained through the reaction time. K2CO3 converted a large number of carbon atoms into methane. On contrary, the yield of
methane in the experiment without catalyst was better than that of NaOH. In conclusion, K2CO3 promoted the formation of methane, but the quantities were low that could not be
consider as a strategic development.
• In continuous process, the P H2 (2%) was low in the absence of catalyst and the
alkaline catalyst increased it significantly. The value with K2CO3 is 15 times higher than
that without catalyst and was 1.5 times higher than that with NaOH. For a longer reaction time (batch), the P H2 of the experiment without catalyst reached 30%, that of
K2CO3 and NaOH were higher and very similar (50% and 52%). While the performance
of glycerol gasification was better than that of glucose (<35%), the glycerol is a good candidate for the hydrogen production. Comparing the results of continuous and batch, the importance of reaction time was emphasized. The K2CO3 improved the hydrogen
12 production, especially in continuous process. In the batch reactor, NaOH and K2CO3 had
the same efficiencies to convert glycerol into H2.
4. CONCLUSIONS
• The objectives of this research were to investigate the operating conditions for SCWG of glycerol and to compare continuous and discontinuous processes, thus to explore the feasibility of the treatment. Glycerol is a main by-product of biodiesel production. The gasification in supercritical water was carried out in a continuous reactor of 100 ml (ICMCB, Bordeaux) and in an autoclave of 500 ml (EMAC, Albi) at 450°C and 25MPa. The influence of alkaline catalyst was also studied. The main conclusions are:
• Gasification efficiency and hydrogen production were enhanced at high temperature. The maximum of H2 was obtained at 525°C with catalyst (K2CO3).
• Glycerol concentration was a major limitative factor: low concentrations were suitable to gasify the glycerol and inhibit the formation of solids.
• Alkaline catalyst allowed reducing the reaction temperature, to inhibit CO production and to improve gasification efficiency and hydrogen production. K2CO3 promotes more
remarkably the hydrogen production and the gasification than NaOH in continuous process, while same results were obtained in the batch process.
• Reaction time is a key factor in batch reactor, especially without catalyst: best hydrogen production using 30 min but higher gasification efficiency with 60 min.
• Stirring rate and the heating rate had few influence on the gasification of glycerol. The gasification already occurred during the heating
• Continuous process is more suitable to be industrialized the gasification of glycerol in supercritical water according to the specific overall gas production.
• Identification of intermediates in the liquid phase is in progress. 5. REFERENCE
[1] CLIFFORD A.A., Chim. Oggi, Vol. 11, 1993, p. 36-37
[2] KRUSE A. DINJUS E., J. Supercrit. Fluids, Vol. 39, 2007, p. 362-380. and J. Supercrit. Fluids, Vol. 41, 2007, p. 361-379
[3] KRUSE A., J. Supercrit. Fluids, Vol. 47, 2009, p. 391-399.
[4]POMPEO F. SANTORI G. NICHIO N. International journal of hydrogen energy vol. 35, 2010, p.8912-8920 [5]WATANABE M., IIDA Y., AIDA T.M., INOMATA H., Biores. Technology, Vol. 98, 2007, p. 1285-1290. [6]BÜHLER W., DINJUS E., EDERER H.J., KRUSE A., MAS C., J. Supercrit. Fluids, Vol. 22, 2002, p. 37-53. [7]ANTAL M.J., ALLEN S., LICHWA J., SCHULMAN D., XU X., Proceedings for U.S. DOE Hydrogen
Program Review, 1999, p.1-24.
[8]BYRD A.J., PANT K.K., GUPTA R.B., Fuel, Vol. 87, 2008, p. 2956-2960.
[9]XU D., WANG S., HU X., CHEN C., ZHANG Q., GONG Y., J. Hydrogen Energy, Vol. 34, 2009, p. 5357-5364.
[10]MAY A., SALVADÓ J., TORRAS C., MONTANÉ D., Chem. Eng. J., Vol. 160, 2010, p.751-759. [11]SUTTON D., KEZLLEHER B., ROSS J.R.H., Fuel Processing Technology, Vol. 73, 2001, p.155-173. [12]MATSUMURA Y., MINOWA T., POTIC B., KERSTEN S. R., PRINS W., VAN SWAAIJ W.P., VAN DE BELD
B., ELLIOTT D.C., NEUENSCHWANDER G.G., KRUSE A., ANTAL M.J., Biomass and Bioenergy, Vol. 29, 2005, p. 269-292.
[13]YANIK J., EBALE S., KRUSE A., SAGLAM M., YÜKSEL M. Int. J. Hydrogen Energy, Vol. 33, 2008, p.4520-4526.
[14]SINA A., KRUSE A., SCHWARZKOPF V., Industrial & Engineering Chemistry Research, vol. 42, 2003, p. 3516-3521.
[15] KAWASKIS., OE T., ITOH S., SUZUKI A., SUE K., ARAI K., J. of Supercritical Fluids, Vol. 42, 2007, p. 241–254
[16]PEI A.X.,ZHANG R., JIN H., GUO L.J., Journal of Xi’an Jiaotong University, vol. 42, 2008, P.913-918 [17]KRUSE A., MEIER D., RIMBRECHT P., SCHACHT M. , Industrial & Engineering Chemistry Research, vol.
![Figure 5: Profile of temperature with time(a),-Influence of heating rate on the yield of product gas (b) and G E , C GE , P H2 (C) (450°C, 25MPa.[Glycerol]=5wt%, [K 2 CO 3 ]=1.5wt%, reaction time: 0min, 50%, 100% of heating power)](https://thumb-eu.123doks.com/thumbv2/123doknet/12506735.340767/8.892.140.757.650.832/figure-profile-temperature-influence-heating-product-glycerol-reaction.webp)
![Figure 6: Comparison of the influence of catalyst on the specific overall gas production of the gasification of glycerol in continuous and discontinuous process (450°C, 25MPa, 550g/h (continuous), [glycerol] =5wt%, [K 2 CO 3 ] =1.5 wt%, [NaOH] =1.5wt% (c](https://thumb-eu.123doks.com/thumbv2/123doknet/12506735.340767/9.892.254.632.624.857/comparison-influence-catalyst-production-gasification-continuous-discontinuous-continuous.webp)