DESIGN OF CONCRETE COLUMNS BASED ON EC2
TABULATED DATA - A CRITICAL REVIEW
Jean-Marc FRANSSEN
Univ. of Liege, 1, Chemin des Chevreuils, 4000, Liège 1, Belgium jm.franssen@ulg.ac.be
ABSTRACT
ENV 1992-1-2, the fire part of the concrete Eurocode, proposes different tables for the design of simple concrete elements submitted to the ISO fire. Table 4.1 is the table valid for
concrete columns. For six fire resistance times Rf = 30, 60, 90, 120, 180 and 240 minutes,
and for three load ratio µfi = 0.2, 0.5 and 0.7, an acceptable solution is given in term of the
minimum dimension of the section bmin and axis distance a from the re-bar to the edge of the
section.
The application of this table is not as easy as one could believe at first glance especially when it comes to assessing the fire resistance time of existing elements which are different from the recommended solutions. This is because a double interpolation has to be done, on
Rf and on µfi, because the criteria is based on 2 different variables, bmin and a, and because
the load ratio is not available from the room temperature design (not to mention the complication created by clause 4.2.3 (6)). In this paper, a graphic is presented that allows an easier application of this table 4.1.
This table has been compared with experimental test results from the University of Braunschweig, the University of Gent, the University of Liege and the National Research Council of Ottawa. It appears that virtually no correlation exists between the results predicted by the table and the results of the tests. Even more alarming is the fact that there is a systematic tendency of the table to yield unsafe results.
An alternative table is presented here, accompanied by a simple calculation equation that allows to easily derive the fire resistance for situations that are different from the ones proposed in the table.
INTRODUCTION
Three different levels are proposed in the Eurocodes for structural fire design: the tabulated data, the simplified calculation method and the general calculation method. Tabulated data provide detailing according to recognised design solutions that are valid for member analysis and for the standard fire exposure. According to the Eurocodes,
"The tables have been developed on an empirical basis confirmed by experience and theoretical evaluation of tests. Therefore, this data is derived from approximate conservative assumptions…".
Unfortunately, there are several sections in several of the fire Eurocodes for which such a thing as a fully documented and generally accepted background presented in a publication submitted to a peer review is simply non existent.
This is the situation for Table 4.1 of Eurocode 2 Part 1-2 [1] presented as a tabulated data for reinforced concrete columns. It is therefore difficult to judge on the validity and on the conservative character of this table. In fact, on the base of a limited number of comparisons with test results, some doubts were raised about the fact that the results provided by this table are conservative.
This paper presents the results of an extensive analysis in which the results provided by Table 4.1 have been compared to the results of experimental tests.
WHAT IS TABLE 4.1 FOR REINFORCED CONCRETE COLUMNS?
The table gives minimum section dimensions bmin and axis distance of the re-bars a for
different load levels µfi and different fire resistance times Rf . As far as columns exposed on
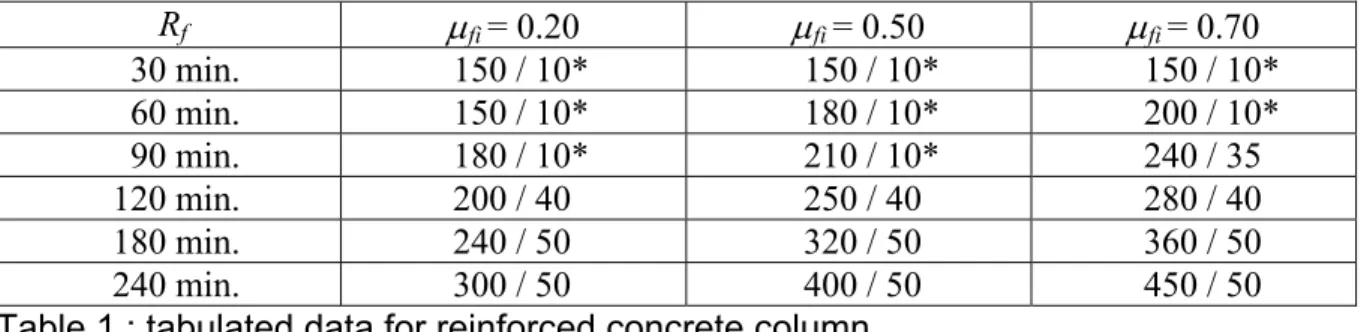
more than one side are concerned, Table 4.1 of Eurocode 2 is summarised in Table 1 of this paper. Rf µfi = 0.20 µfi = 0.50 µfi = 0.70 30 min. 150 / 10* 150 / 10* 150 / 10* 60 min. 150 / 10* 180 / 10* 200 / 10* 90 min. 180 / 10* 210 / 10* 240 / 35 120 min. 200 / 40 250 / 40 280 / 40 180 min. 240 / 50 320 / 50 360 / 50 240 min. 300 / 50 400 / 50 450 / 50
Table 1 : tabulated data for reinforced concrete column
The symbol * in this table means that "Normally the cover required by ENV 1992-1-1 will control". It is desirable here to chose a value of the axis distance areq which represents what
would normally be required by ENV 1992-1-1. According to Table 4.2 of ENV 1992-1-1, the concrete cover cannot be less than 15 mm in a normally dry building, i.e. class 1a according to Table 4.1.
• For 12 mm longitudinal re-bars and 6 mm stirrups, this yields areq = 15+6+12/2 = 27
mm. This is the smallest possible value of areq.
• For 25 mm longitudinal re-bars, the cover must not be smaller than 25 mm. With a
tolerance of construction of 5 to 10 mm, the value of areq recommended by ENV
1992-1-1 could be as high as 40 mm.
In this paper, a fixed value of areq = 35 mm will be considered as the value required by ENV
1992-1-1. Table 2 can therefore be used instead of Table 1.
Rf µfi = 0.20 µfi = 0.50 µfi = 0.70 30 min. 150 / 35 150 / 35 150 / 35 60 min. 150 / 35 180 / 35 200 / 35 90 min. 180 / 35 210 / 35 240 / 35 120 min. 200 / 40 250 / 40 280 / 40 180 min. 240 / 50 320 / 50 360 / 50 240 min. 300 / 50 400 / 50 450 / 50
Table 2 : tabulated data for reinforced concrete column, areq taken into account
The value of areq is important not only in the cases where the symbol * was present in Table
1, but also because of clause 4.2.3 (6) of ENV 19929-1-2. This clause says:
"Where the actual width … b of column is at least 1.2 times the minimum value bmin given in Table 4.1 the axis distance a may be reduced to a value not less than areq. Linear interpolation of a may be used for values b/bmin between 1 and 1.2".
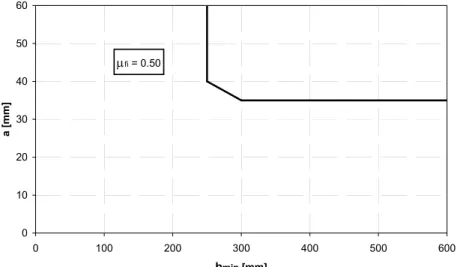
Figure 1 is a graphical expression of the admissible solution for a fire resistance Rf of 120
minutes and a load ratio µfi of 0.50. The solution is based on 250 / 40 and on clause 4.2.3 (6)
in which areq = 35 mm has been taken into account. This clause says that a can be as low as
areq = 35 mm, provided that b is greater than 1.2 bmin = 1.2 x 250 = 300 mm. The linear
interpolation is clearly seen as cutting the corner of the curve. Every solution in the upper right part of the figure can be considered as yielding a fire resistance of 120 minutes or more.
µfi = 0.50 0 10 20 30 40 50 60 0 100 200 300 400 500 600 bmin [mm] a [mm]
FIGURE 1 : Solution for Rf = 120 min.
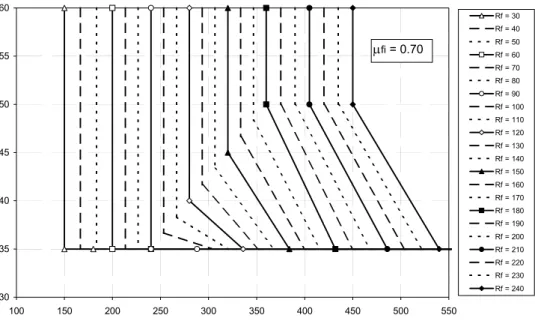
Figure 2, 3 and 4 give, for load ratio µfi = 0.2, 0.5 and 0.7, the different zones leading to
different fire resistance times. Other graphs can be made for other load ratio, for example 0.3, 0.4, and 0.6, assuming also a linear variation of the parameters as a function of the load ratio. 30 35 40 45 50 55 60 100 150 200 250 300 350 400 Rf = 60 Rf = 70 Rf = 80 Rf = 90 Rf = 100 Rf = 110 Rf = 120 Rf = 130 Rf = 140 Rf = 150 Rf = 160 Rf = 170 Rf = 180 Rf = 190 Rf = 200 Rf = 210 Rf = 220 Rf = 230 Rf = 240 µfi = 0.20
FIGURE 2 : Solution for µfi = 0.20.
30 35 40 45 50 55 60 100 150 200 250 300 350 400 450 500 Rf = 30 Rf = 40 Rf = 50 Rf = 60 Rf = 70 Rf = 80 Rf = 90 Rf = 100 Rf = 110 Rf = 120 Rf = 130 Rf = 140 Rf = 150 Rf = 160 Rf = 170 Rf = 180 Rf = 190 Rf = 200 Rf = 210 Rf = 220 Rf = 230 Rf = 240 µfi = 0.50
30 35 40 45 50 55 60 100 150 200 250 300 350 400 450 500 550 Rf = 30 Rf = 40 Rf = 50 Rf = 60 Rf = 70 Rf = 80 Rf = 90 Rf = 100 Rf = 110 Rf = 120 Rf = 130 Rf = 140 Rf = 150 Rf = 160 Rf = 170 Rf = 180 Rf = 190 Rf = 200 Rf = 210 Rf = 220 Rf = 230 Rf = 240 µfi = 0.70
FIGURE 4 : Solution for µfi = 0.70 .
It is essential to have a clear idea of the correct definition of µfi . It is defined by equation 1.
µfi = Ed,fi / Rd,fi(0) (1)
with Ed,fi design effect of actions in the fire situation,
Rd,fi(0) design load bearing capacity (resistance) in the fire situation at time t = 0.
This ratio may appear as the most rational choice for expressing the variable supposed to influence the fire resistance time. It has yet to be recognised that it is based on a quantity,
Rd,fi(0), which is not directly provided by the design of the structure at room temperature. A
specific calculation is required in order to obtain this value and it can only be made by one of the calculation methods, hopefully the simplified calculation method, whereas the main purpose of the tabulated data is to avoid any calculation! If the author of the project has to
calculate Rd,fi(0) at time t = 0 in order to use the tabulated data, he might as well directly
apply the same simplified calculation method at time t in order to calculate Rd,fi(t)!
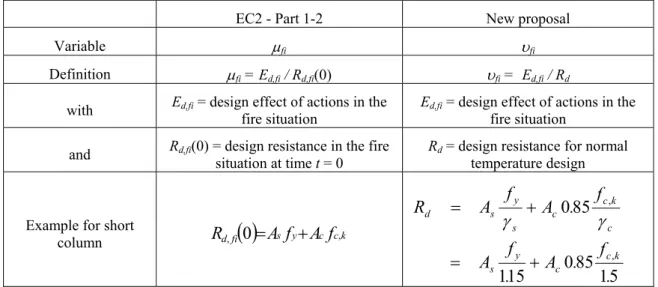
Table 3 shows the comparison between the load ratio µfi which is proposed in the Eurocode
and the load ratio υfi that will be used in the alternative method proposed in the next section
of this paper. This comparison is made in Table 3 for the very simple case of a centrally loaded short column. The calculations would of course be much more complex if the load is applied with an eccentricity or if the slenderness of the column has to be taken into account, see appendix 1.
EC2 - Part 1-2 New proposal
Variable µfi υfi
Definition µfi = Ed,fi / Rd,fi(0) υfi = Ed,fi / Rd
with Ed,fi = design effect of actions in the
fire situation Ed,fi = design effect of actions in the fire situation and Rd,fi(0) = design resistance in the fire
situation at time t = 0 Rd = design resistance for normal temperature design
Example for short
column Rd,fi
( )
0=Asfy+Acfc,k 5 1 85 0 15 1 85 0 , , . f . A . f A f . A f A R k c c y s c k c c s y s d + = + = γ γTable 3 : comparison between two different load ratio
COMPARISON BETWEEN EUROCODE AND EXPERIMENTAL RESULTS
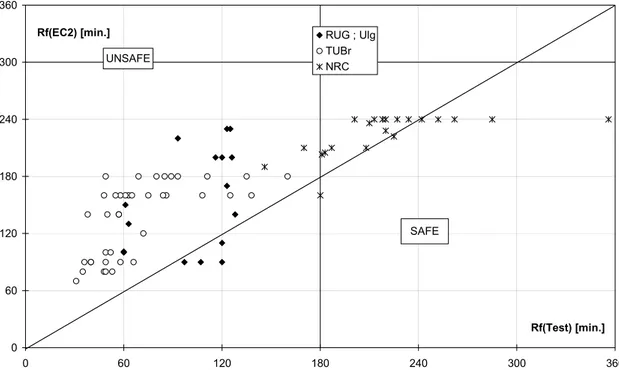
The results provided by Table 4.1 of Eurocode 2 have been compared with the results of experimental tests made in Belgium, University of Liege and Gent [2], in Germany, Technical University of Braunschweig [3], and in Canada, Fire Research Station in Ottawa [4]. A total of 82 test results have been considered. The result of this comparison is shown on Figure 5. On this figure, it is quite clear that the tests made in Belgium were calibrated to investigate the fire resistance period of 2 hours where a gap existed between the German tests, usually around one hour, and the Canadian tests, three to four hours. It can be seen that the application of the recommendations of Table 4.1 leads to results on the unsafe side. The
average value of all the ratio Rf(EC2) / Rf(Test) is 1.71. It means that the existing calculation
method based on Table 4.1 overestimates the fire resistance of columns by a factor which, in the average, has a value of 1.71. The standard deviation of the population is 0.69, leading to a coefficient of variation of 0.69/1.71 = 0.41.
0 60 120 180 240 300 360 0 60 120 180 240 300 360 Rf(Test) [min.]
Rf(EC2) [min.] RUG ; Ulg
TUBr NRC
SAFE UNSAFE
FIGURE 5 : Comparison between EUROCODE and tests
NEW PROPOSAL
The situation depicted in Figure 5 motivated a research project having as an objective to present an alternative design method. The methodology was the following.
1. An extensive parametric investigation was first performed with the numerical code SAFIR of the University of Liege [5] in order to highlight the influence of different parameters on the fire resistance.
2. Additional experimental programs were performed in Belgium, [6] and [7], in order to investigate some effects on which it was impossible to conclude from other previously performed tests (the results of these new test series are incorporated in Figure 5). Most of the tests have been performed at the University of Gent on columns 3.95 m high, while a few tests on 2.10 m high columns have been performed at the University of Liege. The following parameters have been examined : load level, massivity (dimensions of the cross sections), length, diameter of the longitudinal reinforcement and structural detailing, concrete cover, load eccentricity, concrete strength. A lot of observations could be made from these test results.
• Columns including reinforcement with a large diameter (φ = 25 mm) present fire resistance times much smaller than those expected from theoretical estimation, mainly because of extensive corner spalling occurrence. Such premature failures have practically not been observed with φ 16 or φ 12 reinforcement. It has also been noticed that the use of 8 φ 16 instead of 4 φ 25 leads to a substantial improvement. • Experimental results displayed a rather wide scatter.
• Corner spalling has been observed in many tests, more frequently in Gent than in Liege. In this latter case, very few spalling was detected, but large cracks along the
bearing reinforcements could often be seen. The length of the columns and the end conditions, not similar in Gent and in Liege, can partly explain these differences. • The influence of the load level, the massivity and the length corresponds to what
could be expected : the increase of the load level and of the length, and a decrease of the cross-section lead to a decrease of the fire resistance.
• The increase of concrete cover has a positive effect on the fire resistance or on the admissible load level. This influence, however, seems less important than the one resulting from FIP/CEB Recommendations and Eurocode 2.
3. A simple model was established which took account of all most sensitive parameters. 4. The model was calibrated on the base of the experimental results.
The new model for assessing the fire resistance Rf of reinforced concrete columns is based
on the following formula :
8 . 1 , ' , , , , 120 120 + + + + = f fa fL fb fn f R R R R R R υ (2) in which
(
fi f R,υ=831−υ)
(3) d fi d fi R E, = υ (4)υfi takes into account the load ratio, in which the crushing strength of the column is
included, as well as the effects of bending and second order effects.
(
30 6 . 1 , = a− Rfa)
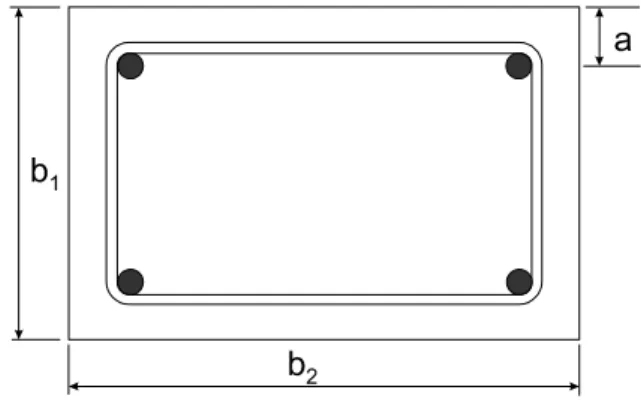
(5)with a the axis distance in mm of the steel to the nearest exposed surface, see Fig. 6.
FIGURE 6 : Definition of a, b1 and b2
(
LRf,L=9.6 5−
)
(6)with L the buckling length of the column in m. ' 09 . 0 ' , b Rfb = (7) with p A 4 '= b in mm.
For Fig. 6, 2 1 2 1 2 ' b b b b b= + 0 ,n= f R for n ≤ 4 (8) 12 ,n= f R for n > 4
with n the number of longitudinal bars.
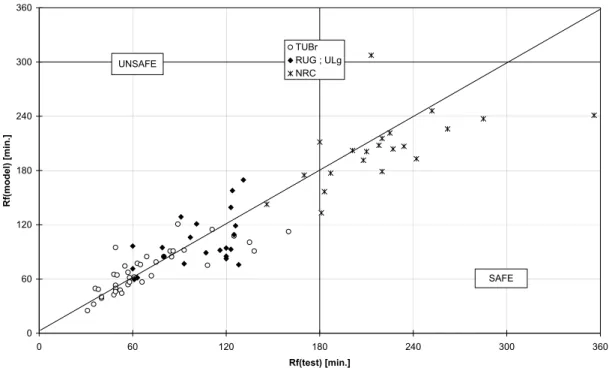
Figure 7 presents the comparison of the results obtained by the new model and the results of
the experimental tests. The average value of the ratio Rf(model) / Rf(test) is equal to 1.01 and
the standard deviation is equal to 0.23
0 60 120 180 240 300 360 0 60 120 180 240 300 360 Rf(test) [min.] Rf(model) [min.] TUBr RUG ; ULg NRC UNSAFE SAFE
FIGURE 7 : Comparison between new model and tests
Even if an equation is proposed, see Eq. 2, which allows the calculation of the fire resistance for any combination of the parameters, the proposed model must anyway be seen as belonging to the family of the tabulated data. Indeed, the proposed equation is just a best fit equation; it is not based on any consideration of equilibrium. In this sense, the field of application of this model is restricted, for each parameter, to the range in which experimental values exist. Allowing anyway very limited extrapolations on some parameters, the field of application is:
Load level 0.15 ≤ υfi ≤ 0,80
Dimensions of the section 200 ≤ b’ ≤ 450 mm
b2≤ 1.5 b1
Concrete cover 25 ≤ a ≤ 80 mm
Reinforcement ratio 0.9 % ≤ As/Ac ≤ 4.0 %
Concrete strength 24 ≤ fcm ≤ 53 MPa
Eccentricity e ≤ 15 cm
Diameter of the bars φ < 25 mm
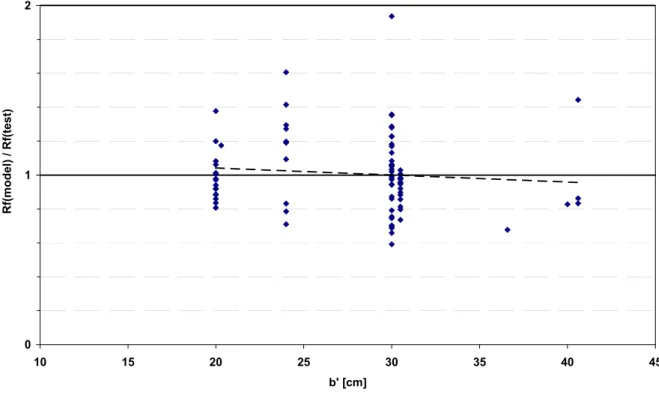
It has been verified that the model gives a safety level which is not dependent of either the load level, the width of the section, the concrete cover or the length of the column. It can be noticed that the linear best regression among the points is virtually equal to the horizontal
line at level Rf(model) / Rf(test)= 1.00 in all figures from Fig. 8 to Fig. 11
0 1 2
0 0,1 0,2 0,3 0,4 0,5 0,6 0,7 0,8 0,9
Rf(model) / Rf(test)
0 1 2 10 15 20 25 30 35 40 45 b' [cm] Rf(mo d el) / Rf(test)
FIGURE 9 : Rf(model) / Rf(test) as a function of b '
0 1 2 20 30 40 50 60 70 80 90 a [mm] Rf(model) / Rf(test)
FIGURE 10 : Rf(model) / Rf(test) as a function of a FIGURE 10 : Rf(model) / Rf(test) as a function of a
0 1 2
100 200 300 400 500 600
Rf(model) / Rf(test)
FIGURE 12 : Rf(model) / Rf(test) as a function of L Notes :
1. In the interpretation of the tests which has been made in order to calibrate the model and to draw figures 5 and 8, the measured average values of the mechanical properties of concrete and steel have been taken into account. In a normal design process, the characteristic values of these properties shall be used and this will introduce, in the average, an additional safety margin.
2. A new series of tests has been recently performed in Liege on 4 short columns with a circular section. The diameter was 30 cm and 2 columns had 6 φ 12 and 2 had 6 φ 20. The resistance times were, expressed as ( model ; test ), the following
( 166 ; 156 ) ( 143 ; 131 ) ( 179 ; 187 ) ( 160 ; 163 )
In order to retain the simplicity of the presentation of the tabulated data, a table similar to table 1 or 2 of this paper, i.e. table 4.1 of the Eurocode, can be established with the new model. This is table 4 presented here bellow, valid for a buckling length L of 3 meters. In this table, two different possibilities have been proposed for several of the combinations fire resistance – load level. One solution is a wide section with a normal concrete cover, the other one is a normal section with a more important concrete cover.
Standard Column width bMinimum dimensions (mm)
min/axis distance a of the main bars
fire Column exposed on more than one side Exposed on one side resistance υfi = 0.2 υfi = 0.5 υfi = 0.7 υfi = 0.7 R 30 200/25 200/25 200/25 140/25 R 60 200/25 200/35 250/30 300/30** 200/45 140/25 R 90 200/30 300/25 350/30** 300/40 300/45** 450/35** 140/25 R 120 250/40 300/30** 300/45** 450/35** 350/50** 450/45** 160/35 R 180 350/45** 350/60** 450/65** 210/55 R 240 350/60** 450/70** 450/80** 270/70 ** Minimum 8 bars
Table 4 : tabulated data for reinforced concrete column – new proposal
It is not easy to compare table 2 and table 4 because they are based on a different definition of the load ratio. Anyway, under the realistic following hypotheses:
As = 0.0085 Ac fy = 500 Mpa fc = 25 Mpa
one obtains the following relation that gives an idea of the ratio that might exist between the two different definition of the load level
µfi = 0.6 υfi
Thus, column 3 of Table 2, for example, should be compared with column 4 of Table 4. It can be observed that the new proposal is by far more severe.
CONCLUSIONS
The comparison which has been made between experimental test results and the tabulated data proposed in Eurocode 2 shows that there is very little correlation and that the results proposed by the Eurocode are almost systematically on the unsafe side.
A model has been proposed which has a good correlation with the results of a series of 82 experimental tests. The new model allows to determine the solution very easily even for a combination of the parameters which is different from the one proposed in the table. This is achieved by a simple interpolation equation.
REFERENCES
[1] ENV 1992-1-2, Eurocode 2: Design of concrete structures - Part 1-2: General rules -
Structural fire design, CEN, Brussels, November 1995.
[2] Dotreppe J-C., Baus R., Franssen J.-M., Brüls A. & Vanderzeypen, Y., Dimensionnement des colonnes en béton armé en considérant le problème de la résistance au feu. Rapport de Clôture, Convention F.R.F.C. N° 29010.90/F, Service des Ponts et Charpentes, Université de Liège, 1995.
[3] Hass R., Zur Praxisgerechten Brandschutztechnischen Beurteilung von Stutzen aus
Stahl und Beton, Inst. für Baustoffe, Massivbau und Brandschutz der Technischen Universität Braunschweig, Heft 69, 1986.
[4] Lie T. T. & Woolerton J. L., Fire resistance of reinforced concrete columns - Test results, Int. Report N°569, National Research Council, Institute for Research in Construction, Ottawa, 1988.
[5] Franssen J.-M., Kodur V. K. R. & Mason J., User's Manual for SAFIR (Version NZ). A Computer Program for Analysis of Structures Submitted to the Fire, Univ. of Liege, Ponts et Charpentes, Rapport interne SPEC/2000_03, 2000
[6] Dotreppe J.-C., Franssen J-M., Brüls A., Baus R., Vandevelde P., Minne R., Van Nieuwenburg D. & Lambotte H., Experimental research on the determination of the main parameters affecting the behaviour of reinforced concrete columns under fire conditions, Magazine of Concrete Research, 49, N° 179, Thomas Telford Ltd, London, pp. 117-127 (1997).
[7] Aldea C.-M., Franssen J.-M. & Dotreppe J-C. Fire tests on normal and high strength reinforced concrete columns, Proceedings of the International Workshop on Fire Performance of High Strength Concrete, NIST-National Institute of Standards and Technology, Gaithersburg, Maryland, USA, pp. 109-124 (1997).
APPENDIX
I Basic equations for the calculation of the resistance of the column
The method is the method called model column and explained in Eurocode 1 Part 1-1. It goes as follows.
First order eccentricity of the load e0= 0,6 e1 + 0,4 e2 ≥ 0,4 e1
Accidental eccentricity 2 L ea =ν with 2001 100 100 1 ≥ = L ν External equilibrium 10 2 0 e L e eext= + a+χ (I.1) Internal equilibrium
(
)
int int int int , N N M e = χ (I.2)Equation I.1 and I.2 are solved with the use of a spreadsheet:
• The straight line corresponding to equation I.1 is first drawn in a (χ ; e) plan.
• For successive and increasing values of Nint, the curves corresponding to equation I.2
are drawn in the same plane. For each value of Nint, different points of the curve are
found by giving successive and increasing values to χ and computing with the
spreadsheet the value of Mint and, hence, of eint.
II Main parameters of the experimental tests
Rf
Lab. As a b1 b2 L fcm fym esup einf Nd,fi Rd υfi Rd,fi(0) µfi Test Model
cm² mm cm kN/cm² cm kN kN kN min. TUBr 9.2 30 20 20 571 4.2 48.0 10.0 10.0 140 206 0.68 252 0.56 31 25 TUBr 9.2 30 20 20 571 4.2 48.0 5.0 5.0 172 292 0.59 371 0.46 35 32 TUBr 12.6 38 20 20 476 3.1 46.2 2.0 2.0 240 463 0.52 630 0.38 36 50 TUBr 18.9 38 30 30 470 3.5 50.5 0.5 0.5 1 548 1 964 0.79 2 988 0.52 38 49 TUBr 12.6 38 20 20 576 3.2 44.3 1.0 1.0 208 416 0.50 590 0.35 40 40 TUBr 9.2 30 20 20 571 4.2 47.7 1.0 1.0 245 479 0.51 712 0.34 40 39 TUBr 12.6 38 20 20 476 2.4 48.7 340 575 0.59 799 0.43 48 43 TUBr 18.9 38 30 30 476 3.8 40.4 0.5 0.5 1 224 1 956 0.63 3 105 0.39 48 65 TUBr 12.6 38 20 20 476 3.1 46.2 1.0 1.0 280 540 0.52 766 0.37 49 50 TUBr 12.6 38 20 20 476 3.1 46.2 6.0 6.0 170 307 0.55 390 0.44 49 46 TUBr 18.9 38 30 30 470 3.2 50.3 15.0 15.0 280 715 0.39 923 0.30 49 95 TUBr 9.2 30 20 20 571 4.2 48.2 1.0 1.0 175 479 0.37 712 0.25 49 53 TUBr 18.9 38 30 30 470 3.2 52.6 15.0 15.0 465 727 0.64 941 0.49 50 64 TUBr 9.2 30 20 20 571 4.2 48.5 5.0 5.0 122 292 0.42 371 0.33 52 48 TUBr 12.6 38 20 20 476 3.1 46.2 10.0 10.0 130 227 0.57 282 0.46 53 44 TUBr 18.9 38 30 30 470 3.2 50.3 1.0 1.0 970 1 753 0.55 2 654 0.37 55 74 TUBr 18.9 38 30 30 376 4.2 45.2 0.5 0.5 1 695 2 347 0.72 3 723 0.46 57 67 TUBr 18.9 38 30 30 470 3.2 52.6 1.0 1.0 1 308 1 775 0.74 2 662 0.49 57 54 TUBr 18.9 38 30 30 576 2.4 48.7 800 1 475 0.54 2 126 0.38 58 62 TUBr 12.6 38 20 20 376 2.4 48.7 420 743 0.57 1 027 0.41 58 57 RUG 6.8 31 30 20 390 3.1 49.3 2.0 2.0 300 637 0.47 986 0.30 60 71 RUG 6.8 41 30 20 390 3.3 49.3 2.0 2.0 283 608 0.47 972 0.29 60 96 RUG 8.0 33 30 30 390 3.4 57.6 950 1 773 0.54 2 858 0.33 61 59 TUBr 18.9 38 30 30 576 2.4 48.7 3.0 3.0 600 1 119 0.54 1 564 0.38 61 62 Ulg 8.0 33 30 30 210 2.9 57.6 1 270 1 751 0.73 2 840 0.45 63 61 TUBr 18.9 38 30 30 476 2.4 48.7 3.0 3.0 650 1 244 0.52 1 809 0.36 63 77 TUBr 18.9 38 30 30 476 3.1 46.2 15.0 15.0 362 679 0.53 878 0.41 65 76 TUBr 12.6 38 20 20 376 2.4 48.7 420 743 0.57 1 027 0.41 66 57 TUBr 18.9 38 30 30 476 3.1 46.2 3.0 3.0 650 1 406 0.46 2 115 0.31 69 85 TUBr 9.2 30 20 20 571 4.2 47.8 1.0 1.0 128 479 0.27 712 0.18 72 64 TUBr 18.9 38 30 30 476 3.1 46.2 9.0 9.0 460 902 0.51 1 288 0.36 75 79 RUG 10.2 34 20 20 189 5.1 22.0 468 1 208 0.39 2 030 0.23 79 95 RUG 3.1 30 20 20 189 4.7 22.0 385 997 0.39 1 729 0.22 80 85 TUBr 18.9 38 30 30 476 3.1 46.2 3.0 3.0 650 1 406 0.46 2 115 0.31 80 85 TUBr 18.9 38 30 30 376 2.4 48.7 930 1 754 0.53 2 616 0.36 84 91 TUBr 18.9 38 30 30 476 3.1 46.2 1.5 1.5 740 1 596 0.46 2 434 0.30 85 85 TUBr 18.9 38 30 30 376 2.4 48.7 3.0 3.0 710 1 341 0.53 2 003 0.35 86 91 TUBr 18.9 38 30 30 333 4.3 54.4 15.0 15.0 355 969 0.37 1 282 0.28 89 121
Rf Lab. As a b1 b2 L fcm fym esup einf Nd,fi Rd υfi Rd,fi(0) µfi Test Model
cm² mm cm kN/cm² cm kN kN kN min. RUG 15.3 34 30 20 160 4.0 22.0 558 1 503 0.37 2 491 0.22 91 129 RUG 16.1 33 40 40 390 3.0 57.6 2.0 2.0 1 650 2 590 0.64 4 240 0.39 93 77 TUBr 18.9 38 30 30 476 3.2 49.9 -1.5 1.5 735 1 807 0.41 2 725 0.27 93 92 Ulg 6.8 41 30 20 210 2.7 49.3 620 1 028 0.60 1 649 0.38 97 106 RUG 4.7 30 30 20 160 4.5 22.0 457 1 321 0.35 2 280 0.20 101 121 Ulg 6.8 31 30 20 210 3.1 49.3 611 1 138 0.54 1 837 0.33 107 89 TUBr 18.9 38 30 30 476 2.4 48.7 880 1 630 0.54 2 400 0.37 108 75 TUBr 18.9 38 30 30 266 3.3 45.8 3.0 3.0 845 1 743 0.48 2 732 0.31 111 115 RUG 8.0 33 30 30 390 2.9 57.6 422 1 584 0.27 2 525 0.17 116 92 RUG 8.0 33 30 30 390 3.5 57.6 622 1 834 0.34 2 967 0.21 120 82 RUG 6.8 31 30 20 390 3.0 49.3 2.0 2.0 178 615 0.29 947 0.19 120 94 RUG 6.8 41 30 20 390 3.2 49.3 2.0 2.0 334 606 0.55 970 0.34 120 85 RUG 8.0 48 30 30 390 3.7 57.6 2.0 2.0 349 1 528 0.23 2 466 0.14 123 139 Ulg 8.0 33 30 30 210 2.9 57.6 803 1 720 0.47 2 782 0.29 123 93 RUG 4.7 40 30 20 160 4.5 22.0 457 1 499 0.30 2 595 0.18 124 158 RUG 8.0 33 30 30 390 3.7 57.6 2.0 2.0 220 1 568 0.14 2 525 0.09 125 109 TUBr 18.9 38 30 30 266 3.3 41.8 5.0 5.0 780 1 458 0.53 2 275 0.34 125 108 RUG 16.1 33 30 30 390 3.6 57.6 2.0 2.0 370 1 704 0.22 2 682 0.14 126 119 RUG 8.0 33 30 30 390 3.3 57.6 -2.0 2.0 664 1 687 0.39 1 584 0.42 128 76 RUG 15.3 44 30 20 160 4.9 22.0 558 1 785 0.31 2 987 0.19 131 170 TUBr 18.9 38 30 30 476 3.8 44.9 -3.0 3.0 645 1 886 0.34 2 946 0.22 135 101 TUBr 18.9 38 30 30 376 2.4 48.7 930 1 754 0.53 2 616 0.36 138 91 NRC 20.4 61 31 31 191 3.5 44.4 1 778 2 583 0.69 4 073 0.44 146 143 TUBr 18.9 38 30 30 333 3.1 43.3 1.5 1.5 735 1 737 0.42 2 711 0.27 160 112 NRC 20.4 61 31 31 191 3.7 44.4 1 333 2 691 0.50 4 264 0.31 170 175 NRC 12.6 58 20 20 191 4.2 44.2 169 1 295 0.13 2 017 0.08 180 212 NRC 20.4 61 31 31 381 4.0 44.4 2.5 2.5 1 000 1 892 0.53 2 987 0.33 181 133 NRC 20.4 61 31 31 267 3.8 44.4 2.5 0.0 1 178 2 292 0.51 3 650 0.32 183 157 NRC 20.4 61 31 31 191 3.8 44.4 1 333 2 763 0.48 4 392 0.30 187 177 NRC 20.4 61 31 31 191 4.4 44.4 1 044 3 037 0.34 4 874 0.21 201 202 NRC 20.4 61 31 31 191 3.6 44.4 1 067 2 650 0.40 4 191 0.25 208 191 NRC 20.4 61 31 31 191 3.5 44.4 916 2 614 0.35 4 128 0.22 210 201 NRC 65.5 80 41 41 191 4.6 41.4 2 978 6 504 0.46 10 026 0.30 213 307 NRC 20.4 61 31 31 191 3.4 44.4 800 2 552 0.31 4 019 0.20 218 208 NRC 20.4 61 31 31 191 3.5 44.4 711 2 598 0.27 4 100 0.17 220 215 NRC 20.4 61 31 31 267 3.9 44.4 1 000 2 604 0.38 4 138 0.24 220 179 NRC 40.9 61 31 31 191 3.7 44.4 1 333 3 447 0.39 5 144 0.26 225 221 NRC 20.4 61 31 31 191 5.3 44.4 1 178 3 516 0.34 5 720 0.21 227 204 NRC 20.4 61 31 31 191 5.0 44.4 1 067 3 341 0.32 5 411 0.20 234 207 NRC 20.4 61 31 31 267 4.0 44.4 800 2 623 0.30 4 172 0.19 242 193 NRC 40.9 61 31 31 191 4.3 44.4 978 3 724 0.26 5 603 0.17 252 246 NRC 40.9 61 41 41 191 3.9 44.4 2 418 5 112 0.47 8 051 0.30 262 226 NRC 65.5 64 41 41 191 3.8 41.4 2 795 5 804 0.48 8 792 0.32 285 237 NRC 31.0 59 31 46 191 4.3 41.4 1 413 4 397 0.32 7 074 0.20 356 241