www.atmos-chem-phys.net/15/12789/2015/ doi:10.5194/acp-15-12789-2015
© Author(s) 2015. CC Attribution 3.0 License.
Retrieval of ammonia from ground-based FTIR solar spectra
E. Dammers1, C. Vigouroux2, M. Palm3, E. Mahieu4, T. Warneke3, D. Smale5, B. Langerock2, B. Franco4, M. Van Damme1,6, M. Schaap7, J. Notholt3, and J. W. Erisman1,81Cluster Earth and Climate, Department of Earth Sciences, Vrije Universiteit Amsterdam, Amsterdam, the Netherlands 2Belgian Institute for Space Aeronomy, Brussels, Belgium
3Institut für Umweltphysik, University of Bremen, Bremen, Germany 4Institute of Astrophysics and Geophysics, University of Liege, Belgium 5National Institute of Water and Atmosphere, Lauder, New Zealand
6Spectroscopie de l’Atmosphère, Service de Chimie Quantique et Photophysique,
Université Libre de Bruxelles, Brussels, Belgium
7TNO Built Environment and Geosciences, Department of Air Quality and Climate, Utrecht, the Netherlands 8Louis Bolk Institute, Driebergen, the Netherlands
Correspondence to: E. Dammers (e.dammers@vu.nl)
Received: 1 June 2015 – Published in Atmos. Chem. Phys. Discuss.: 28 August 2015 Revised: 6 November 2015 – Accepted: 9 November 2015 – Published: 18 November 2015
Abstract. We present a retrieval method for ammonia (NH3)
total columns from ground-based Fourier transform infrared (FTIR) observations. Observations from Bremen (53.10◦N, 8.85◦E), Lauder (45.04◦S, 169.68◦E), Réunion (20.9◦S, 55.50◦E) and Jungfraujoch (46.55◦N, 7.98◦E) were used
to illustrate the capabilities of the method. NH3 mean
total columns ranging 3 orders of magnitude were ob-tained, with higher values at Bremen (mean of 13.47 × 10¹⁵molecules cm−2) and lower values at Jungfraujoch (mean of 0.18 × 10¹⁵molecules cm−2). In conditions with high surface concentrations of ammonia, as in Bremen, it is possible to retrieve information on the vertical gradient, as two layers can be distinguished. The retrieval there is most sensitive to ammonia in the planetary boundary layer, where the trace gas concentration is highest. For conditions with low concentrations, only the total column can be re-trieved. Combining the systematic and random errors we have a mean total error of 26 % for all spectra measured at Bremen (number of spectra (N ) = 554), 30 % for all spec-tra from Lauder (N = 2412), 25 % for specspec-tra from Réunion (N = 1262) and 34 % for spectra measured at Jungfraujoch (N = 2702). The error is dominated by the systematic uncer-tainties in the spectroscopy parameters. Station-specific sea-sonal cycles were found to be consistent with known seasea-sonal cycles of the dominant ammonia sources in the station sur-roundings. The developed retrieval methodology from FTIR
instruments provides a new way of obtaining highly time-resolved measurements of ammonia burdens. FTIR-NH3
ob-servations will be useful for understanding the dynamics of ammonia concentrations in the atmosphere and for satellite and model validation. It will also provide additional infor-mation to constrain the global ammonia budget.
1 Introduction
Nitrogen emissions in the form of ammonia (NH3), which
largely derive from agriculture, have been associated with acidification and eutrophication of soils and surface waters (Krupa, 2003; Vitousek et al., 1997), which may reduce bio-diversity in vulnerable ecosystems (Bobbink et al., 1998, 2010). Ammonia also reacts with nitric acid and sulfuric acid to form ammonium salts, which account for a large fraction of particulate matter concentrations (Schaap et al., 2004). Particulate matter is a major contributor to smog and is related to negative health impacts (Pope III et al., 2009). Moreover ammonium salts play an important role in the radiance balance of the Earth, thus having an impact on climate change (Charlson et al., 1991; Erisman et al., 2007). It has been shown that reduced nitrogen also plays a role in the fixation of carbon dioxide (CO2) (Reay et al.,
of reactive nitrogen (Nr) to the atmosphere (Holland et al., 1999). Current global Nr emissions have been estimated to be almost 4 times larger than pre-industrial levels (Fowler et al., 2013), with NH3emissions amounting to 49.3 Tg in 2008
(EDGAR – Emission Database for Global Atmospheric Re-search, 2011). Consequently this has led to large increases in atmospheric nitrogen deposition (Rodhe et al., 2002; Den-tener et al., 2006). Biomass burning was found to account for 11 % of the global emission budget of NH3(Bouwman et al.,
1997). While agricultural emissions dominate in the North-ern Hemisphere, biomass burning is one of the main sources of NH3concentration in the Southern Hemisphere.
Despite its central role in many environmental threats, lit-tle is known about the ammonia budget and its distribution across the globe. Uncertainties in global and regional emis-sion rates are large, with errors of more than 50 % (Erisman et al., 2007; Sutton et al., 2013). Ammonia concentrations have a large variability in time and space and a short lifetime in the order of hours. The lack of globally distributed obser-vations hampers our understanding. Surface obserobser-vations are available, but these are not homogenously distributed over the globe, with most observation sites located in the North-ern Hemisphere. Most sites provide data with a poor tem-poral resolution (e.g. many observation networks use pas-sive samplers with a sampling time of 2 or 4 weeks (Thi-jsse et al., 1998; Puchalski et al., 2011)), whereas emis-sion and deposition dynamics affect concentrations on the scale of hours to days. Systems with higher sampling fre-quency such as the AMANDA, MARGA and (denuder) fil-ter packs are available, but the number of measurement net-works using these instruments is limited as they are often costly to operate (Erisman et al., 2001; Thomas et al., 2009; Mount et al., 2002; Hansen et al., 2003). Moreover, mea-suring NH3is challenging and existing in situ measurement
techniques are often prone to sampling artefacts (von Bo-brutzki et al., 2010). Recent advances in open-path remote sensing techniques, like (mini-)differential optical absorption spectroscopy (DOAS) systems and open-path quantum cas-cade laser (QCL) instruments, show great potential in over-coming part of these sampling issues (Volten et al., 2012; Miller et al., 2014), but are still in the development stage and not widely applied yet. Another aspect is the lack of verti-cal information, as most instruments only measure surface concentrations (Erisman et al., 2007, 2008; Van Damme et al., 2015a). Some recent airborne measurements have been made (Nowak et al., 2007, 2010; Leen et al., 2013), but only during dedicated campaigns with limited temporal and spa-tial coverage. In short, it is very difficult to obtain detailed knowledge on the global ammonia budget using field obser-vations that are currently available.
Remote sensing products from atmospheric satellite sounders such as the Infrared Atmospheric Sounding In-terferometer (IASI), the Tropospheric Emission Spectrom-eter (TES) and the Cross-track Infrared Sounder (CrIS) (Van Damme et al., 2014a; Shephard et al., 2011, 2015) have
be-come available and show good promise to improve NH3
con-centration monitoring (Van Damme et al. 2014b; Luo et al., 2015; Whitburn et al., 2015). However, these data sets are constrained by the overpass time of the satellite and the atmo-spheric conditions (cloud coverage, thermal contrast, etc.). Moreover, the uncertainties associated to the data are rela-tively large, which calls for a detailed evaluation of the data. A recent study (Van Damme et al., 2015a) showed a number of challenges related to the validation. First, reliable hourly in situ data are sparse. Second, when not using optimal es-timation satellite products, as is the case for the IASI-NH3
retrieval, one has to assume a vertical profile to link surface concentrations to a column value. Third, the ground-based observations are often influenced by local sources, whereas satellite observations have a footprint of the order of tens of kilometres. A recent study by Shephard et al. (2015) shows the potential of an instrument that can be used for profile comparisons. In the study, instruments on an aircraft were used to measure a vertical profile of NH3; these
measure-ments were used as a validation tool for the NH3-profile
ob-servations of TES. Hence, a measurement methodology that provides columnar and vertical profiles of ammonia concen-trations at a high temporal resolution would be highly ben-eficial for evaluating the merits of the novel satellite prod-ucts. Fourier transform infrared spectrometry (FTIR) pro-vides this methodology. Atmospheric sounders have a long history for validation of satellite products. FTIR observations are already commonly used for the validation of satellite products of, among others, carbon monoxide (CO), methane (CH4) and nitrous oxide (N2O) (Wood, 2002; Griesfeller et
al., 2006; Dils et al., 2006; Kerzenmacher et al., 2012). FTIR spectrometry is a well-established remote sensing technique for the observation of atmospheric trace gases (Rao and Weber, 1992). FTIR has so far been used to estimate ammonia emissions from fires (Yokelson et al., 1997, 2007; Paton-Walsh et al., 2005), but only on a campaign basis, not through long-term monitoring. There are several moni-toring stations with FTIR instruments that are operated on a regular basis, providing long-term time series for a suite of key tropospheric and stratospheric species, including carbon dioxide (CO2), carbon monoxide (CO) and ozone (O3). So
far nobody has systematically analysed the FTIR measure-ments for NH3. We have developed a NH3-retrieval strategy
for four Network for the Detection of Atmospheric Compo-sition Change (NDACC) FTIR stations, spanning very dif-ferent concentration conditions (polluted and remote sites), in order to obtain time series of NH3total columns and show
their value for describing temporal variations.
First we present the measurement sites and the retrieval strategies in Sect. 2. We describe the characteristics of the re-trieval in Sect. 3.1.1 and the uncertainty budget in Sect. 3.1.2. Section 3.2 constitutes of an interpretation of the results in combination with a comparison with existing data sets of CO total columns and temperature to distinguish between emis-sion sources. We summarize the results in Sect. 4.
2 Measurement sites and retrieval strategies 2.1 Sites description
Ground-based FTIR instruments measure the solar absorp-tion spectra under cloud-free condiabsorp-tions by using a Fourier transform spectrometer. These spectra can be analysed by using a line-by-line model (Pougatchev et al., 1995; Hase et al., 2004, 2006), which models the spectroscopic absorp-tion lines by using known parameters from a spectroscopic database (e.g. HITRAN, Rothman et al., 2013) in combina-tion with the radiative state of the atmosphere, and an opti-mal estimation inversion scheme (Rodgers, 2000). Informa-tion on vertical concentraInforma-tion profiles can be retrieved us-ing the pressure broadenus-ing of the absorption lines. For the NDACC network the spectral region measured is the near- to mid-infrared domain (740 to 4250 cm−1, i.e. 13.5 to 2.4 µm),
with a HgCdTe or InSb cooled detector (Zander et al., 2008) and a suite of optical filters being used to optimize the signal-to-noise ratio in the complementary spectral regions. Instru-ments in the network are routinely checked and character-ized using laboratory measurements of HBr lines and the line-fit software (Hase et al., 1999) to assess the instrument line shape, alignment and measurement noise levels. Four NDACC stations are used in our study, two in each hemi-sphere:
– The site of Bremen (53.10◦N, 8.85◦E) is especially suitable to measure variations in ammonia concentra-tions as the surrounding state, Lower Saxony, is a region with intensive agricultural activities with high and temporal variable emissions (Dämmgen and Eris-man, 2005). In short, the ammonia total columns (molecules cm−2) at Bremen are expected to reach high values compared to background stations. The University of Bremen operates a Bruker 125HR spectrometer and a solar tracker by Bruker GmbH, directly on the univer-sity campus.
– The Jungfraujoch station (46.55◦N, 7.98◦E) is a high-altitude station (3580 m a.s.l.) located in Switzerland (Zander et al., 2008). There are no sources of large emis-sions surrounding the station itself as it is located in the free troposphere. At Jungfraujoch, a Bruker 120HR in-strument has been in operation since the early 1990s. For the current study, specific for the Jungfraujoch site, we used a subset of spectra recorded during the 2004– 2013 time period with apparent solar zenith angles (SZA) between 70 and 85◦to increase the capability to retrieve the very low ammonia concentrations.
– The Lauder (45.04◦S, 169.68◦E) National Institute of Water and Atmospheric Research (NIWA) atmospheric research station in Central Otago, New Zealand, is sit-uated at an altitude of 370 m a.s.l. Long-term opera-tions started in 1991 with a Bruker 120M (Griffith et
al., 2003). This instrument was replaced with a Bruker 120HR in October 2001. Ammonia emissions in the sur-rounding valley are mostly due to livestock grazing on the pastures and are a by-product of seasonal fertilizer application. In recent years there has been an increase in cattle grazing and crop cultivation (EDGAR – Emission Database for Global Atmospheric Research, 2011). – Réunion Island (20.9◦S, 55.50◦E) is located in the
Indian Ocean to the east of Madagascar. The station is located at the University campus of Saint-Denis on the north side of the island. Agricultural activities are mostly related to sugar cane production. The island is prone to some local biomass burning and wild fire events, which are known to emit ammonia. It is also very close to Madagascar, a region with frequent and intense biomass burning events, and it has been found, using backward trajectory, that the emissions in Mada-gascar can be transported to Réunion Island within 1 day (Vigouroux et al., 2009). The measurements used in this study are performed with a Bruker 120M spec-trometer. Details on the measurements can be found in Senten et al. (2008) and Vigouroux et al. (2012). These stations are expected to provide significant differences in variability and levels of ammonia, making them suitable to demonstrate the strength of our retrieval scheme for ap-plication across the whole network. A summary of the sta-tion descripsta-tions is given in Table 1. CO columns were ob-tained from the NDACC database to be used for comparison in Sect. 3.
2.2 NH3retrieval strategies
The ammonia absorption lines from its υ2vibrational band
can be observed in the 700–1350 cm−1 wavenumber range and they are also used in the retrieval of satellite prod-ucts of ammonia (e.g. Clarisse et al., 2009; Van Damme et al., 2014a). In this spectral range the FTIR spectra can be measured using a potassium bromide (KBr) beam splitter in combination with a mercury–cadmium–telluride (MCT) nitrogen-cooled detector (Zander et al., 2008). The retrieval scheme of trace gas concentrations from FTIR spectra is built on the use of a set of spectral micro-windows containing ab-sorption lines of the targeted species, with minimum interfer-ence by other atmospheric species or solar lines. Two slightly different sets of spectral micro-windows were used at the four stations, but both sets use the same main NH3absorption
lines. The target and interfering species are summarized in Table 2, with the profile-retrieved species indicated in bold. To properly estimate ammonia, interfering species like O3
and water vapour (H2O) that overlap NH3lines in the υ2
vi-brational band have to be accounted for. Two micro-windows were chosen that contain as few interfering species as possi-ble. In both sets, the first micro-window (MW1) covers the NH3absorption line at 930.75 cm−1. At Bremen/Lauder, the
Table 1. FTIR stations used in the analysis. The location, longitude, latitude and altitude are given for each station as well as the instrument
used for the measurements. Some station specifics are given in the last column.
Station Location Longitude Latitude Altitude (m a.s.l.) Instrument Station specifics Bremen Germany 8.85◦E 53.10◦N 27 Bruker 125 HR City, fertilizers, livestock Lauder New Zealand 169.68◦E 45.04◦S 370 Bruker 120 HR Fertilizers, livestock Réunion Indian Ocean 55.5◦E 20.90◦S 85 Bruker 120 M Fertilizers, fires
Jungfraujoch Switzerland 7.98◦E 46.55◦N 3580 Bruker 120 HR High altitude, no large sources
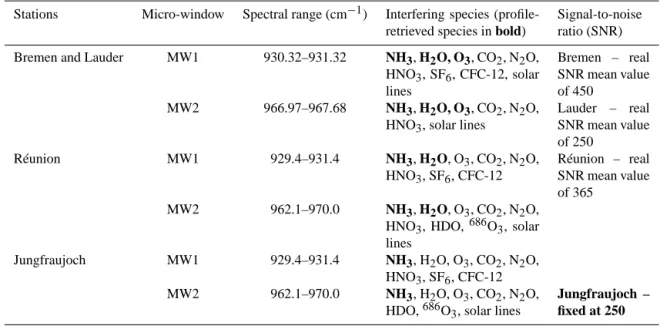
Table 2. Micro-windows used in the NH3retrieval at the four stations.
Stations Micro-window Spectral range (cm−1) Interfering species (profile-retrieved species in bold)
Signal-to-noise ratio (SNR) Bremen and Lauder MW1 930.32–931.32 NH3, H2O, O3, CO2, N2O,
HNO3, SF6, CFC-12, solar lines Bremen – real SNR mean value of 450 MW2 966.97–967.68 NH3, H2O, O3, CO2, N2O,
HNO3, solar lines
Lauder – real SNR mean value of 250 Réunion MW1 929.4–931.4 NH3, H2O, O3, CO2, N2O, HNO3, SF6, CFC-12 Réunion – real SNR mean value of 365 MW2 962.1–970.0 NH3, H2O, O3, CO2, N2O, HNO3, HDO,686O3, solar
lines
Jungfraujoch MW1 929.4–931.4 NH3, H2O, O3, CO2, N2O,
HNO3, SF6, CFC-12
MW2 962.1–970.0 NH3, H2O, O3, CO2, N2O,
HDO,686O3, solar lines
Jungfraujoch – fixed at 250
choice was to use only isolated NH3absorption features to
avoid possible problems due to line mixing, therefore the spectral window MW1 is only 1 cm−1wide (930.32–931.32; MW1). Figure 1 shows an example of a synthetic spectrum calculated to fit a observation that was measured with the 125HR in Bremen on the 19 April 2010 at 09:59 UTC (so-lar zenith angle of 45◦). The NH3 concentrations on this
day were slightly higher than average, resulting in slightly stronger NH3absorption features in the spectra. The top two
figures show the absorption contributions of the absorbing species in both micro-windows. The bottom two panels show an enlarged version of the figure to distinguish the interfer-ing species with smaller absorption features. At Réunion Is-land/Jungfraujoch, MW1 was extended (929.4–931.4; MW1) to cover another NH3 line at 929.9 cm−1. This improved
the retrieval for Réunion Island because at this location the NH3 concentration levels are much lower than at Bremen
and the water vapour concentrations are much higher. In this high humidity condition, the 930.75 cm−1line is not isolated
from H2O, and it improved the retrieval to add the more
iso-lated one at 929.9 cm−1 (see Fig. 2). The main interfering
species in MW1 are CO2, N2O and H2O. Minor interfering
species are SF6and CFC-12. The second window spans the
NH3 line at 967.35 cm−1. Again, different widths are used
for Bremen/Lauder (966.97–967.68; MW2) and Réunion Is-land/Jungfraujoch (962.7–970; MW2). The very weak ab-sorption signatures at Réunion Island and Jungfraujoch are close to the noise level and therefore the whole NH3
ab-sorption shape is retrieved (about 964–968 cm−1; see Fig. 2)
rather than a single line. The main interfering species in MW2 are O3, CO2 and H2O for all sites. At Réunion
Is-land HDO also interferes in MW2 as well as the isotopologue
686O
3(i.e.16O–18O–16O), which has been fitted in addition
to the main 666O3. At Jungfraujoch apart from CO2, two
O3 isotopologues (the most abundant and686O3) and water
vapour, which are the main interferences, N2O, CFC-12, SF6
and HDO absorptions are also retrieved. Typical NH3
absorp-tions are weak, on the order of a few tenths of a percent. The typical measurement noise (signal-to-noise ratio) differs per spectra and site but ranges between ∼ 250 at Lauder and ∼450 at Bremen. Channelling was not an issue in any of the spectra and did not need to be fitted.
Except at Jungfraujoch where SFIT2 is used, the retrieval is performed using the more recent SFIT4.0.9.4 algorithm (Pougatchev et al., 1995; Hase et al., 2004, 2006). Both ver-sions use a form of the optimal estimation method (Rodgers, 2000) to retrieve the volume mixing ratios and total columns of NH3 and make use of a priori information (profile and
Figure 1. Calculated spectrum for both spectral windows measured with the 125HR in Bremen on the 19 April 2010 at 09:59 UTC,
corre-sponding to a total column of 18.83 × 10¹⁵molecules cm−2. The top two panels show the individual contributions of the different species in the first (MW1) and second (MW2) spectral windows. The second row shows the same calculated spectra but now with the y-axis scaled to show the minor interfering species.
covariance matrix). For Bremen, Lauder and Jungfraujoch the used NH3 a priori volume mixing ratios are based on
balloon observations (Toon et al., 1999, NH3 available in
data set but not reported). The shape of the balloon measure-ments’ profile was kept constant but extended and scaled to expected surface concentrations. The a priori surface volume mixing ratio is estimated to be 10 ppb for Bremen (Dämm-gen and Erisman, 2005). Although the shape of NH3
pro-files do change through time, the largest share of NH3is
ex-pected to be in the mixing layer, which is represented by the lowest layers in the calculation (Van Damme et al., 2015a; Nowak et al., 2010). At Réunion Island, the a priori profile was taken from the MOZART model (L. Emmons, private communication, 2014). The a priori profile peaks at a higher altitude (4–5 km) instead of the boundary layer as in Bremen, as NH3is expected to originate mainly from the transport of
biomass burning emissions at this location. At all stations, the a priori profiles of the interfering species were taken from the Whole Atmosphere Community Climate Model (Chang et al., 2008).
At Bremen and Lauder, the a priori covariance matrices only have diagonal values, corresponding to standard devia-tions of 100 % for all layers with no interlayer correlation, chosen in relation to the large range of possible concen-trations and variations between layers. At Jungfraujoch and Réunion Island, we did not use the a priori covariance matrix as an optimal estimation; however, the Tikhonov-type L1
reg-ularization (e.g. Sussmann et al., 2009) was adopted for the Jungfraujoch retrievals. After several tests, values of 50 and 250 were adopted for the alpha parameter and the signal to noise for inversion, respectively. A Tikhonov regularization with an alpha parameter value of 50 was also adopted for the Réunion retrievals. The signal to noise ratio is calculated for each of the spectra, the mean value being 365.
Daily temperature and pressure profiles for the meteoro-logical variables were taken from NCEP (National Centers for Environmental Prediction). For the radiative transfer cal-culations the profiles were split into about 50 levels, depend-ing slightly on the station, from ground up to 80 km (100 km in the case of Jungfraujoch and Réunion Island). The lay-ers have a typical thickness of 500 m in the troposphere, up
Figure 2. Example of a synthetic atmospheric spectrum for both
spectral windows at Réunion Island, computed for 5 June 2011, and a total column of 1.07×10¹⁵molecules cm−2. The top panel shows the individual contributions of the main species in the first spectral window. The bottom panel shows the second spectral window.
to 2 km for the higher layers. For the line spectroscopy we use the HITRAN 2012 database (Rothman et al., 2013) in combination with a number of corrections for CO2(ATMOS,
Brown et al., 1996) (except for Jungfraujoch for which the HITRAN lines are used) and sets of pseudo-lines generated by G. C. Toon (NASA-JPL) to account for broad unresolved absorptions by heavy molecules (e.g. CFC-12, SF6).
Figure 3 shows an example of the fit in both micro-windows for the same measured spectra as used in Fig. 1. The top two and bottom two panels show the calculated (green line) and measured spectrum (blue line) and the residual of both micro-windows. The simultaneous fits are good with a standard deviation of 0.15 % in both cases.
3 Results of the FTIR retrievals
3.1 Characteristics of the NH3retrievals
3.1.1 Vertical information
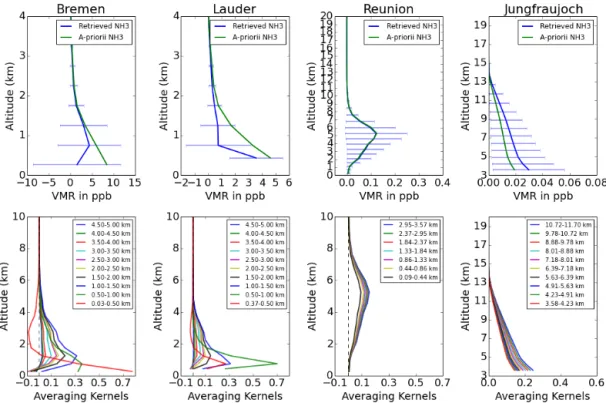
The retrieved vertical information differs from station to sta-tion. The top of Fig. 4 shows the average NH3volume
mix-ing ratios (VMR) for each of the retrieved layers (blue line) and the a priori profile that was used as input in the retrieval (green line), for the four stations. The bottom of Fig. 4 shows the averaging kernels for each of the four stations averaged over all available observations. As mentioned earlier most of the NH3 at Bremen is in the lowest layers. In Fig. 4 this is
also observed as the averaging kernel shows the most sensi-tivity in the lowest layers (red and green lines for the layers 0.03–0.5 and 0.5–1 km). The combination of the two spec-tral micro-windows contains, on average, 1.9 degrees of free-dom of signal (DOFS) for the Bremen spectra, which means around two independent vertical layers can be retrieved. The two separate layers consist of a layer covering ground–1 km and one that covers 1–6 km height, which can be observed in Fig. 4. It must be taken into account, however, that the aver-aging kernels shown are a mean of all observations and thus the retrievable number of layers and combined layer depths vary from spectra to spectra. On average, the Lauder spec-tra have a DOFS of 1.4. There is only vertical information for multiple layers during periods with increased NH3 total
columns, which mostly occur during summer. Similar to Bre-men, averaging kernels peak near the surface. At Réunion Island, only a DOFS of 1.0 is achieved, with almost no ver-tical information available. All the averaging kernels peak at the same altitude (about 5 km), which is also the peak of the a priori profile (Fig. 4). Similar to the Réunion spectra, the Jungfraujoch spectra do not have vertical information with a DOFS of 1.0.
3.1.2 Uncertainties budget
For the error analysis the posteriori error calculation included in the SFIT4 package is used. The error calculation is based on the error estimation approach by Rodgers (2000). It allows the calculation of the error by attributing errors to each of the parameters used in the retrieval. The error budget can be di-vided into three contributions: the error due to the forward model parameters, the measurement noise and the error due to the vertical resolution of the retrieval (smoothing error). The assumed uncertainties for the parameters used in the re-trieval are listed in Table 3 for the parameters used in the cal-culation for Bremen, Lauder and Réunion. For Jungfraujoch, the error computation was performed using the perturbation method, the spectra of 2009 to 2011 and the Rodger formal-ism as explained e.g. in Franco et al. (2015). For Réunion Is-land, the covariance matrix used for the smoothing error has diagonal elements representing 150 % variability from the a
Figure 3. Measured and calculated spectrum for both spectral windows measured with the 125HR in Bremen on the 19 April 2010 at
09:59 UTC, corresponding to a total column of 18.83 × 10¹⁵molecules NH3cm−2. The top two panels show the observed (blue line) and
calculated (green line) spectra for MW1 (left) and MW2 (right). The bottom two figures show the residuals of the fits in both spectral windows.
Figure 4. Top panels: the retrieved NH3profile (blue) and the a priori profile (green) in order from left to right: Bremen (left), Lauder (Left
middle), Réunion Island (right middle) and Jungfraujoch (right). Horizontal lines indicate the standard deviation in all observations for each layer. Bottom panels: the normalized averaging kernel for each of the stations.
priori profile. To reflect the error in the NCEP temperature profiles, we assume an uncertainty of about 2 K in the tro-posphere and a 5 K uncertainty in the stratosphere. For the uncertainty in the NH3line parameters we assume values as
stated in the HITRAN 2012 database. We assume a conser-vative 20 % uncertainty for the intensity and 10 % for both the temperature and pressure broadening coefficients.
The results of the error calculation are listed in Table 4. Combining the systematic and random errors, we have a
mean total error of 25.8 % for all the spectra measured at Bremen (N = 554), 30.2 % for the spectra at Lauder (N = 2412), 25.2 % for the Réunion spectra (N = 1262) and 34.2 for the Jungfraujoch spectra (N = 2702). The errors are dom-inated by uncertainties in the spectroscopy. In detail, the ran-dom error sources amount to a mean error of 9.1 % for the Bremen spectra, which is mostly due to uncertainty in tem-perature, measurement noise and the zero level of the sensor (i.e. an instrument property). In the case of the systematic
Table 3. Random and systematic uncertainties used in the error calculation.
Version (stations) SFIT 4 (Bremen, Lauder, Réunion) Version (stations) SFIT 2 (Jungfraujoch)
Parameter Random uncertainty Systematic uncertainty Parameter Random uncertainty Systematic uncertainty
Temperature 2 K troposphere 2 K troposphere Temperature 1.5 K 0–20 km
5 K stratosphere 5 K stratosphere 2.0 K 20–30 km
5.0 K 30 km –
Solar line shift 0.005 cm−1 0.005 cm−1 Line intensity 20.0 %
Solar line strength 0.1 % 0.1 % Line T broadening 10.0 %
Solar zenith angle 0.01◦ 0.01◦ Line P broadening 10.0 %
Phase 0.001 radian (rad) 0.001 rad Interfering species HITRAN2012: varies
Zero level 0.01 0.01 Instrumental line shape (ILS) 10 %
Background curvature 0.001 cm−2 Influence of a priori profiles Calculated
Field of view 0.001 Solar zenith angle (SZA) 0.2◦
Line intensity 20.0 %
Line T broadening 10.0 %
Line P broadening 10.0 %
Interfering species HITRAN2012: varies
Table 4. Mean random and systematic errors for each of the individual NH3retrieval parameters. The table is split into two sections to cover
both the error calculation using SFIT4 (Bremen, Lauder, Réunion) and SFIT2 (Jungfraujoch). At the bottom the errors are summarized into total mean errors for each of the stations.
Station Bremen Lauder Réunion Jungfraujoch
Parameter Mean Mean Mean Mean Mean Mean Parameter Mean Mean
random systematic random systematic random systematic random systematic
error (%) error (%) error (%) error (%) error (%) error (%) error (%) error (%)
Temperature 4.9 4.9 3.6 3.6 2.7 2.9 Temperature 15.2
Solar zenith angle 1.6 1.6 Solar zenith angle 1.9
Phase 1.0 1.0 1.1 1.1 Instrumental line shape 1.4
Zero level 5.0 5.0 6.8 6.8
Measurement noise 4.5 8.4 10.9 Measurement noise 18.2
Interfering species 1.3 2.4 0.9 8.7 (H2O Interfering species 1.4
line pressure broadening)
Retrieval parameters 0.1 0.1 Model parameters 1.4
Background curvature 1.1 1.2 0.3 Forward model 1.0
Smoothing error 2.8 8.1 10.3 Smoothing 5.4
Spectroscopy 21.0 22.7 17.8 Spectroscopy 20.1
NH3a priori 6.1
Influence of a priori 6.6 profiles (H2O & HDO)
Subtotal error 9.1 23.5 12.0 27.0 15.3 20.0 Subtotal error 25.3 23.1
Total error 25.8 30.2 25.2 Total 34.2
error, with a mean error of 23.5 %, the error is for the largest part due to the spectroscopy (i.e. line parameters), with smaller contributions of the temperature, zero level, phase and the smoothing error. The results are similar for the Lauder, Réunion and Jungfraujoch spectra, with most of the uncertainty coming from the line parameters. Hence, line intensity parameters of the ammonia absorption lines are crit-ical for the NH3concentrations.
3.2 Time series
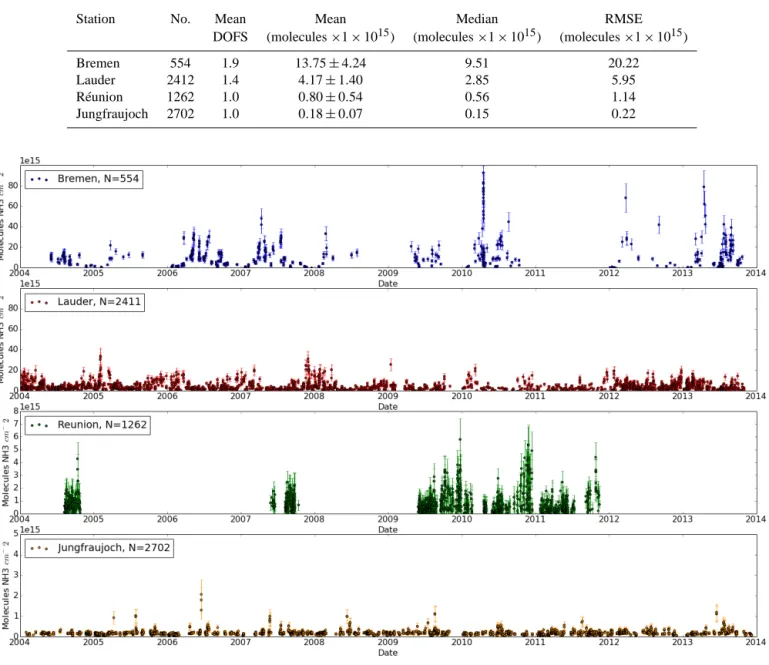
Figure 5 shows the NH3 total columns retrieved from all
available spectra from 2004 to 2013. Table 5 gives a sum-mary of statistics of the retrieved NH3 columns.
Individ-ual measurements at Bremen (blue) show high concentra-tions, especially in spring, with an overall mean column to-tal of 13.7 × 10¹⁵ molecules NH3 cm−2 and a
root-mean-square error (RMSE) of 20.22 indicating a large variability in the observations. The amplitude of the spring peaks varies
Table 5. Statistics of the NH3columns. (No.: number of data points, DOFS: degrees of freedom of signal, mean ± the error of the mean, RMSE: root-mean-square error.). Total columns are given in 1 × 10¹⁵molecules NH3cm−2.
Station No. Mean Mean Median RMSE
DOFS (molecules ×1 × 10¹⁵) (molecules ×1 × 10¹⁵) (molecules ×1 × 10¹⁵)
Bremen 554 1.9 13.75 ± 4.24 9.51 20.22
Lauder 2412 1.4 4.17 ± 1.40 2.85 5.95
Réunion 1262 1.0 0.80 ± 0.54 0.56 1.14
Jungfraujoch 2702 1.0 0.18 ± 0.07 0.15 0.22
Figure 5. Time series of retrieved NH3columns (in molecules NH3cm−2). From top to bottom the figure shows the Bremen (blue), Lauder
(red), Réunion (green) and Jungfraujoch (yellow) total columns. The bars reflect the errors in the individual observations.
throughout the years, with maxima in 2010 and 2013, reach-ing ∼ 93 × 1015 and 85 × 1015 molecules NH3 cm−2. The
variability through the years is caused by changes in mete-orology, emissions and timing of the measurements. Gaps in the data are due to days with overcast and instrument downtimes. The individual observed columns are sorted into monthly averages to analyse the seasonal variability and to understand the processes driving the NH3 concentrations.
This is shown in Fig. 6, together with monthly averages of surface temperature and CO total columns. NH3column
to-tal concentrations at Bremen (Blue line) have a seasonal cy-cle with highest levels during spring, the summer months and
autumn. The maximum concentrations occur around April, which is consistent with temporal emission patterns for ma-nure application reported for this region (Friedrich and Reis, 2004; Van Damme et al., 2015b; Paulot et al., 2014). The baseline variability with higher concentrations in summer can be explained by an increase in volatilization rates of NH3, emitted from livestock housing, which is driven by
an-imal activity and temperature (Gyldenkærne et al., 2005). A comparison is made with CO to distinguish between agricul-tural and fire emissions sources. A correlation between NH3
and CO columns is not observed, which is consistent with agriculture being the dominant source of ammonia.
Figure 6. 2004–2013 monthly averaged columns for NH3, CO and temperature. The top two panels show the monthly NH3column
concen-trations (molecules NH3cm−2)for each of the four stations. Vertical lines indicate the mean monthly error. The bottom two panels show
additional column concentrations of CO (bottom, left) and temperature (bottom, right).
On average the measurements at Lauder (Fig. 5, red line, top panel) yield a column total of 4.17 × 10¹⁵ molecules NH3cm−2. These levels are about one-third of the
concen-trations measured at Bremen (blue, top panel). Spectra from Lauder are available for most days in the retrieved time se-ries, which makes it easier to discern peaks and variability. Distinctive peaks are only visible in each summer. Maxima during springtimes are not often observed. The peak values are similar in between years, with maxima typically around 30 × 1015molecules NH3cm−2. The RMSE of 5.95 reflects
a large variability in the observations between individual re-trievals. The average error is 1.34 × 10¹⁵ molecules NH3
cm−2, which is around a quarter of the mean. Figure 6 shows
the seasonal cycle of Lauder (red line, top left panel). The seasonal variation of NH3 coincides with that of the
atmo-spheric temperature (red line, bottom right panel) and with the livestock emissions in the surrounding region, which are strongly correlated with temperature.
The third panel of Fig. 5 shows the observations from Réu-nion (green symbols, bottom panel). The mean column total observed at Réunion is 0.80 × 10¹⁵ molecules NH3 cm−2.
The concentrations are low during most of the year. How-ever, peaks reaching densities of ∼ 6 × 10¹⁵molecules NH3
cm−2can be observed during the end of each year. The peaks in September–November coincide with the dry season, in-dicating that emissions are mostly due to biomass burning and large fire events (Vigouroux et al., 2012). This is sup-ported by the increased CO concentrations, which are also observed in October and November (see, bottom left panel, Fig. 6). NH3 surface concentration measurements are not
available for this region but a recent paper by Van Damme et al. (2015b), which uses IASI-NH3 observations, shows
similar seasonal cycles for the south-eastern parts of Africa (Madagascar). Temperature is almost constant throughout the year and is not a major factor in the seasonality of Réu-nion.
Observations from Jungfraujoch have the lowest mean concentration of all four stations (Fig. 5, orange line), with a mean of 0.18 × 10¹⁵molecules NH3cm−2. The low
concen-trations at Jungfraujoch are expected, as the station is located in the free troposphere high above the surrounding valleys. Transport of NH3from the valleys only occurs sporadically
during days with intense vertical mixing. This was also ob-served in an earlier study of CO concentrations (Barret et al., 2003). The Jungfraujoch observations show almost no sea-sonal effects with only a minimal increase during the sum-mer months. The low concentrations measured at Jungfrau-joch support our assumption on the vertical distribution of the ammonia concentrations with low values in the troposphere that were used in our a priori profiles.
4 Conclusions and perspectives
In this study we presented a new method to retrieve ammo-nia total columns from ground-based FTIR solar spectra. Ob-servations from four complementary stations were used to illustrate the capabilities of the retrieval method. NH3 total
columns ranging 3 orders of magnitude were obtained with high abundances at Bremen (mean of 13.7 × 10¹⁵molecules cm−2, with a mean DOFS of 1.9) to low columns at Jungfrau-joch (mean of 0.18 × 10¹⁵ molecules cm−2, with a mean DOFS of 1.0). The very low levels obtained at Jungfrau-joch demonstrate the sensitivity of the retrieval method we
developed. A separate error calculation shows random errors in the order of 10 % and systematic errors of 25 % for indi-vidual observations. The errors are dominated by uncertain-ties in spectroscopy, atmospheric temperature and deviations in instrumental parameters. For conditions with high surface concentrations of ammonia, as in Bremen, it is possible to re-trieve information on the vertical gradient as two layers can be discriminated. At Bremen, the retrieval is most sensitive to ammonia in the planetary boundary layer, where most of the ammonia is expected. For conditions with lower concen-trations there is not enough information to discriminate in-dividual layers. Station-specific seasonal cycles were found to be consistent with known seasonal cycles of the dominant ammonia sources in the station surroundings. For example, highest levels in Bremen were observed during springtime when manure is applied to the fields, with column total con-centrations reaching up to 93 × 1015molecules cm−2.
Remote sensing techniques avoid sampling artefacts com-mon to other techniques such as filter packs (Puchalski et al., 2011; von Bobrutzki et al., 2010). For in situ observa-tions, open-path remote sensing techniques, e.g. DOAS and QCL instruments, are starting to be used (Volten et al., 2010; Miller et al., 2014). The FTIR-NH3observations would be
an excellent addition to these approaches as it provides the NH3 total column and profiles, including vertical
informa-tion, for sites sampling high ammonia levels. With a mean error of ∼ 25 % for all observations in high ammonia source areas, the accuracy of the FTIR retrievals is comparable to that reported for satellite products (TES, IASI, CrIS). Com-pared to the in situ open-path remote sensing methods, the FTIR method has a higher uncertainty, but this is a trade-off for the ability to retrieve vertical information. To improve the accuracy of the FTIR-NH3 retrieval, a reassessment of
the spectral line parameters is necessary.
Observations from existing networks commonly represent daily or even monthly averaged concentration values, which severely complicates any attempt to validate satellite obser-vations. The novel FTIR-NH3observations enable a direct
validation of satellite products. As the FTIR- NH3
prod-uct provides averaging kernels, a direct comparison can be made with optimal estimation satellite retrievals while tak-ing account of the a priori information and vertical sensi-tivity of both instruments (Rodgers and Connor, 2003). A dedicated field campaign was executed at the Cabauw Ex-perimental Site for Atmospheric Remote Sensing (CESAR) in the Netherlands (spring and summer 2014) to validate the IASI-NH3using a range of instruments, including
mini-DOAS instruments and a Bruker IFS-66 instrument. The uncertainty in the emission distributions hampers the performance and prediction capabilities of air quality and climate models (Heald et al., 2012). Emissions are usu-ally based on nationusu-ally reported yearly emission inventories (Pouliot et al., 2012) and gridded by distributing the emis-sions according to animal populations and agricultural land use (Bouwman et al., 2002; Kuenen et al., 2011). To improve
on static emission time profiles, a new direction is to in-clude the impact of the meteorological variability of ammo-nia emissions in modelling systems (Sutton et al., 2013). Re-cently, such an improvement was shown to greatly enhance the performance of air quality models (Skjøth et al., 2011). Satellite observations in combination with chemical transport models (CTM) have been used to provide a top-down con-straint on ammonia emissions (e.g. Zhu et al., 2013). Simi-lar to satellite observations, FTIR total columns in combina-tion with surface and satellite observacombina-tions could provide the means to evaluate the emission modelling through compar-ing trends and concentration anomalies within and between years. For this purpose continuous time series are necessary. Due to the lack of continuous data (i.e. more than one obser-vation per hour) we could not derive a typical diurnal cycle in this study, whereas this would be highly useful for model evaluation. Improved knowledge on the diurnal cycles may also greatly help to interpret model evaluation results com-pared to satellite data, as they provide snapshots, e.g. daily observations by IASI at 09:30 local time. Also, the model– measurement comparison would be less sensitive to mod-elling errors in the turbulent vertical exchange as the ammo-nia is integrated vertically.
The developed retrieval methodology from FTIR instru-ments provides a new way of obtaining vertically and tem-porally resolved measurements of ammonia concentrations. FTIR-NH3observations may prove very valuable for
satel-lite and model validation and may provide a complementary source of information to constrain the global ammonia bud-get.
Acknowledgements. This work is part of the research programme GO/12-36, which is financed by the Netherlands Organisation for Scientific Research (NWO). Acknowledgements are addressed to the Université de La Réunion and CNRS (LACy-UMR8105 and UMS3365) for their strong support of the OPAR station (Observatoire de Physique de l’Atmosphère de la Réunion) and the OSU-R (Observatoire des Sciences de l’Univers de la Réunion) activities. The authors gratefully acknowledge C. Hermans and F. Scolas from BIRA-IASB, and J.-M. Metzger from Université de La Réunion, for the Réunion Island measurements. We are also grateful to Louisa Emmons (NCAR) who provided NH3 profiles
from the MOZART model used as a priori information in the Réunion Island retrievals. The University of Liège contribution to the present work has mainly been supported by the A3C project (PRODEX Program of the Belgian Science Policy Office, BEL-SPO, Brussels). Additional support was provided by MeteoSwiss (Global Atmospheric Watch), the Fédération Wallonie-Bruxelles and the F.R.S.-FNRS. We thank the International Foundation High Altitude Research Stations Jungfraujoch and Gornergrat (HFSJG, Bern). E. Mahieu is a Research Associate with F.R.S.-FNRS. The Lauder NIWA FTIR program is funded through the New Zealand government’s core research grant framework. We are grateful to the many colleagues who have contributed to FTIR data acquisition at the various sites.
Edited by: F. Dentener
References
Barret, B., De Mazière, M., and Mahieu, E.: Ground-based FTIR measurements of CO from the Jungfraujoch: characterisation and comparison with in situ surface and MOPITT data, At-mos. Chem. Phys., 3, 2217–2223, doi:10.5194/acp-3-2217-2003, 2003.
Bobbink, R., Hornung, M., and Roelofs, J. G.: The effects of air-borne nitrogen pollutants on species diversity in natural and semi-natural European vegetation, J. Ecol., 86, 717–738, 1998. Bobbink, R., Hicks K., Galloway J., Spranger T., Alkemade R.,
Ashmore M., Bustamante M., Cinderby S., Davidson E., Den-tener F., Emmett B., Erisman, J. W., Fenn, M., Gilliam, F., Nordin, A., Pardo, L., and De Vries, W.: Global assessment of nitrogen deposition effects on terrestrial plant diversity: a syn-thesis, Ecol. Appl., 20, 30–59, 2010.
Bouwman, A. F., Lee, D. S., Asman, W. A. H., Dentener, F. J., Van Der Hoek, K. W., and Olivier, J. G. J.: A global high-resolution emission inventory for ammonia, Global Biogeochem. Cycles, 11, 561–587, 1997.
Bouwman, A. F., Boumans, L. J. M., and Batjes, N. H.: Estimation of global NH3 volatilization loss from synthetic fertilizers and animal manure applied to arable lands and grasslands, Global Biogeochem. Cycles, 16, 1024, doi:10.1029/2000GB001389, 2002.
Brown, L. R., Gunson, M. R., Toth, R. A., Irion, F. W., Rinsland, C. P., and Goldman, A.: 1995 atmospheric trace molecule spec-troscopy (ATMOS) linelist, Appl. Optics, 35, 2828–2848, 1996. Chang, L., Palo, S., Hagan, M., Richter, J., Garcia, R., Riggin, D., and Fritts, D.: Structure of the migrating diurnal tide in the Whole Atmosphere Community Climate Model (WACCM), Adv. Space Res., 41, 1398–1407, doi:10.1016/j.asr.2007.03.035, 2008. Charlson, R. J., Langner, J., Rodhe, H., Leovy, C. B., and Warren,
S. G.: Perturbation of the Northern-Hemisphere radiative balance by backscattering from anthropogenic sulfate 15 aerosols, Tellus A, 43, 152–163, 1991.
Clarisse, L., Clerbaux, C., Dentener, F., Hurtmans, D., and Coheur, P.-F.: Global ammonia distribution derived from infrared satellite observations, Nat. Geosci., 2, 479–483, 2009.
Dämmgen, U. and Erisman, J. W.: Emission, transmission, depo-sition and environmental effects of ammonia from agricultural sources, in: Emissions from European agriculture, edited by: Kuczynski, T., Dämmgen, U., Webb, J., and Myczko, A., Wa-geningen Academic Publishers, WaWa-geningen, the Netherlands, p. 97–112, 2005.
Dentener, F., Drevet, J., Lamarque, J. F., Bey, I., Eickhout, B., Fiore, A. M., Hauglustaine, D., Horowitz, L. W., Krol, M., Kulshrestha, U. C., Lawrence, M., Galy-Lacaux, C., Rast, S., Shindell, D., Stevenson, D., Van Noije, T., Atherton, C., Bell, N., Bergman, D., Butler, T., Cofala, J., Collins, B., Doherty, R., Ellingsen, K., Gal-loway, J., Gauss, M., Montanaro, V., Müller, J. F., Pitari, G., Ro-driguez, J., Sanderson, M., Solmon, F., Strahan, S., Schultz, M., Sudo, K., Szopa, S., and Wild, O.: Nitrogen and sulfur deposition on regional and global scales: A multimodel evaluation, Global
Biogeochem. Cycles, 20, GB4003, doi:10.1029/2005GB002672, 2006.
Dils, B., De Mazière, M., Müller, J. F., Blumenstock, T., Buchwitz, M., de Beek, R., Demoulin, P., Duchatelet, P., Fast, H., Franken-berg, C., Gloudemans, A., Griffith, D., Jones, N., Kerzenmacher, T., Kramer, I., Mahieu, E., Mellqvist, J., Mittermeier, R. L., Notholt, J., Rinsland, C. P., Schrijver, H., Smale, D., Strandberg,0 A., Straume, A. G., Stremme, W., Strong, K., Sussmann, R., Tay-lor, J., van den Broek, M., Velazco, V., Wagner, T., Warneke, T., Wiacek, A., and Wood, S.: Comparisons between SCIAMACHY and ground-based FTIR data for total columns of CO, CH4, CO2
and N2O, Atmos. Chem. Phys., 6, 1953–1976,
doi:10.5194/acp-6-1953-2006, 2006.
EDGAR – Emission Database for Global Atmospheric Research: Source: EC-JRC/PBL. EDGAR version 4.2, http://edgar.jrc.ec. europa.eu (last access: 15 October 2012), 2011.
Erisman, J. W., Otjes, R., Hensen, A., Jongejan, P., van den Bulk, P., Khlystov, A., Mols, H., and Slanina, J.: Instrument development and application in studies and monitoring of ambient ammonia, Atmos. Environ., 35, 1913–1922, 2001.
Erisman, J. W., Bleeker, A., Galloway, J., and Sutton, M. S.: Re-duced nitrogen in ecology and the environment, Environ. Pollut., 150, 140–149, 2007.
Erisman, J. W., Bleeker, A., Hensen, A., and Vermeulen, A.: Agri-cultural air quality in Europe and the future perspectives, Atmos. Environ., 42, 3209–3217, doi:10.1016/j.atmosenv.2007.04.004, 2008.
Fowler, D., Coyle, M., Skiba, U., Sutton, M. A., Cape, J. N., Reis, S., Sheppard, L. J., Jenkins, A., Grizzetti, B., Galloway, J. N., Vitousek, P., Leach, A., Bouwman, A. F., Butterbach-Bahl, K., Dentener, F., Stevenson, D., Amann, M., and Voss, M.: The global nitrogen cycle in the twenty-first century, Phil. Trans. R. Soc. London B Biol. Sci., 368, published online, avail-able at: http://rstb.royalsocietypublishing.org/content/368/1621/ 20130164.abstract, 2013.
Franco, B., Hendrick, F., Van Roozendael, M., Müller, J.-F., Stavrakou, T., Marais, E. A., Bovy, B., Bader, W., Fayt, C., Her-mans, C., Lejeune, B., Pinardi, G., Servais, C., and Mahieu, E.: Retrievals of formaldehyde from ground-based FTIR and MAX-DOAS observations at the Jungfraujoch station and com-parisons with GEOS-Chem and IMAGES model simulations, At-mos. Meas. Tech., 8, 1733–1756, doi:10.5194/amt-8-1733-2015, 2015.
Friedrich, R. and Reis, S. (Eds.): Emissions of Air Pollutants – Measurements, Calculations and Uncertainties, 3-540-00840-3, Springer-Verlag, Berlin Heidelberg New York, 2004.
Griesfeller, A., Griesfeller, J., Hase, F., Kramer, I., Loës, P., Mikuteit, S., Raffalski, U., Blumenstock, T., and Nakajima, H.: Comparison of ILAS-II and ground-based FTIR measurements of O3, HNO3, N2O, and CH4over Kiruna, Sweden, J. Geophys.
Res., 111, D11S07, doi:10.1029/2005JD006451, 2006. Griffith, D. W. T., Jones, N. B., McNamara, B., Walsh, C. P., Bell,
W., and Bernardo, C.: Intercomparison of NDSC ground-based solar FTIR measurements of atmospheric gases at Lauder, New Zealand, J. Atmos. Ocean. Tech., 20, 1138–1153, 2003. Gyldenkærne, S., Skjøth, C. A., Hertel, O., and Ellermann, T.:
A dynamical ammonia emission parameterization for use in air pollution models, J. Geophys. Res.-Atmos., 110, 1–14, doi:10.1029/2004JD005459, 2005.
Hansen, D. A., Edgerton, E. S., Hartsell, B. E., Jansen, J. J., Kandasamy, N., Hidy, G. M., and Blanchard, C. L.: The southeastern aerosol research and characterization study: Part 1. Overview, J. Air Waste Manage. Assoc., 53, 1460–1471, doi:10.1080/10473289.2003.10466318, 2003.
Hase, F., Blumenstock, T., and Paton-Walsh, C.: Analysis of the instrumental line shape of high-resolution fourier transform IR spectrometers with gas cell measurements and new retrieval soft-ware, Appl. Optics, 38, 3417–3422, 1999.
Hase, F., Hannigan, J. W., Coffey, M. T., Goldman, A., Höpfner, M., Jones, N. B., Rinsland, C. P., and Wood, S. W.: Intercompar-ison of retrieval codes used for the analysis of high-resolution, ground-based FTIR measurements, J. Quant. Spectrosc. Ra., 87, 25–52, doi:10.1016/j.jqsrt.2003.12.008, 2004.
Hase, F., Demoulin, P., Sauval, A. J., Toon, G. C., Bernath, P. F., Goldman, A., Hannigan, J. W., and Rinsland, C. P.: An empirical line-by-line model for the infrared solar transmittance spectrum from 700 to 5000 cm−1, J. Quant. Spectrosc. Ra., 102, 450–463, doi:10.1016/j.jqsrt.2006.02.026, 2006.
Heald, C. L., Collett Jr., J. L., Lee, T., Benedict, K. B., Schwandner, F. M., Li, Y., Clarisse, L., Hurtmans, D. R., Van Damme, M., Clerbaux, C., Coheur, P.-F., Philip, S., Martin, R. V., and Pye, H. O. T.: Atmospheric ammonia and particulate inorganic nitrogen over the United States, Atmos. Chem. Phys., 12, 10295–10312, doi:10.5194/acp-12-10295-2012, 2012.
Holland, E. A., Dentener, F. J., Braswell, B. H., and Sulzman, J. M.: Contemporary and pre-industrial global reactive nitrogen bud-gets, in: New Perspectives on Nitrogen Cycling in the Temperate and Tropical Americas, p. 7–43, Springer, the Netherlands, 1999. Kerzenmacher, T., Dils, B., Kumps, N., Blumenstock, T., Clerbaux, C., Coheur, P.-F., Demoulin, P., García, O., George, M., Griffith, D. W. T., Hase, F., Hadji-Lazaro, J., Hurtmans, D., Jones, N., Mahieu, E., Notholt, J., Paton-Walsh, C., Raffalski, U., Ridder, T., Schneider, M., Servais, C., and De Mazière, M.: Validation of IASI FORLI carbon monoxide retrievals using FTIR data from NDACC, Atmos. Meas. Tech., 5, 2751–2761, doi:10.5194/amt-5-2751-2012, 2012.
Krupa, S.: Effects of atmospheric ammonia (NH3) on terres-trial vegetation: a review, Environ. Pollut., 124, 179–221, doi:10.1016/S0269-7491(02)00434-7, 2003.
Kuenen, J., Denier van der Gon, H., Visschedijk, A., van der Brugh, H., and van Gijlswijk, R.: MACC European emission inventory for the years 2003–2007, TNO Rep. TNO-060-UT-2011-00588, TNO, Utrecht, the Netherlands, 2011.
Leen, J. B., Yu, X. Y., Gupta, M., Baer, D. S., Hubbe, J. M., Kluzek, C. D., Tomlinson, J. M., and Hubbell, M. R.: Fast in situ air-borne measurement of ammonia using a mid-infrared off-axis ICOS spectrometer, Environ. Sci. Technol., 47, 10446–10453, doi:10.1021/es401134u, 2013.
Luo, M., Shephard, M. W., Cady-Pereira, K. E., Henze, D. K., Zhu, L., Bash, J. O., Pinder, R. W., Capps, S., and Walker, J.: Satellite Observations of Tropospheric Ammonia and Car-bon Monoxide: Global Distributions, Correlations and Compar-isons to Model Simulations, Atmos. Environ., 106, 262–277, doi:10.1016/j.atmosenv.2015.02.007, 2015.
Miller, D. J., Sun, K., Tao, L., Khan, M. A., and Zondlo, M. A.: Open-path, quantum cascade-laser-based sensor for high-resolution atmospheric ammonia measurements, Atmos. Meas. Tech., 7, 81–93, doi:10.5194/amt-7-81-2014, 2014.
Mount, G. H., Rumburg, B., Havig, J., Lamb, B., Westberg, H., Yonge, D., Johnson, K., and Kincaid, R.: Measurement of atmo-spheric ammonia at a dairy using differential optical absorption spectroscopy in the mid-ultraviolet, Atmos. Environ., 36, 1799– 1810, 2002.
Nowak, J. B., Neuman, J. A., Kozai, K., Huey, L. G., Tanner, D. J., Holloway, J. S., Ryerson, T. B., Frost, G. J., McKeen, S. A., and Fehsenfeld, F. C.: A chemical ionization mass spectrometry technique for airborne measurements of ammonia, J. Geophys. Res.-Atmos., 112, D10S02, doi:10.1029/2006JD007589, 2007. Nowak, J. B., Neuman, J. A., Bahreini, R., Brock, C. A.,
Middle-brook, A. M., Wollny, A. G., Holloway, J. S., Peischl, J., Ryerson, T. B., and Fehsenfeld, F. C.: Airborne observations of ammonia and ammonium nitrate formation over Houston, Texas, J. Geo-phys. Res.-Atmos., 115, D22304, doi:10.1029/2010JD014195, 2010.
Paton-Walsh, C., Jones, N. B., Wilson, S. R., Haverd, V., Meier, A., Griffith, D. W. T., and Rinsland, C. P.: Measurements of trace gas emissions from Australian forest fires and correlations with coincident measurements of aerosol optical depth, J. Geophys. Res.-Atmos., 110, 1–6, doi:10.1029/2005JD006202, 2005. Paulot, F., Jacob, D. J., Pinder, R. W., Bash, J. O., Travis, K., and
Henze, D. K.: Ammonia emissions in the United States, Euro-pean Union, and China derived by high resolution inversion of ammonium wet deposition data: Interpretation with a new agri-cultural emissions inventory (MASAGE NH3), J. Geophys. Res.-Atmos., 119, 4343–4364, doi:10.1002/2013JD021130, 2014. Pope III, C. A., Ezzati, M., and Dockery, D. W.: Fine-Particulate
Air Pollution and Life Expectancy in the United States, N. Engl. J. Med., 360, 376–386, doi:10.1056/NEJMsa0805646, 2009. Pougatchev, N. S., Connor, B. J., and Rinsland, C. P.: Infrared
mea-surements of the ozone vertical distribution above Kitt Peak, J. Geophys. Res.-Atmos., 100, 16689–16697, 1995.
Pouliot, G., Pierce, T., van der Gon, H. D., Schaap, M., Moran, M., and Nopmongcol, U.: Comparing emission inventories and model-ready emission datasets between Europe and North America for the AQMEII project, Atmos. Environ., 53, 4–14, doi:10.1016/j.atmosenv.2011.12.041, 2012.
Puchalski, M. A., Sather, M. E., Walker, J. T., Lehmann, C. M., Gay, D. A., Mathew, J., and Robarge, W. P.: Passive am-monia monitoring in the United States: Comparing three dif-ferent sampling devices, J. Environ. Monit., 13, 3156–3167, doi:10.1039/c1em10553a, 2011.
Rao, K. N. and Weber, A.: Spectroscopy qf the Earth’s Atmosphere and Interstellar Medium, Academic, San Diego, Calif., 1992. Reay, D. S., Dentener, F., Smith, P., Grace, J., and Feely, R. A.:
Global nitrogen deposition and carbon sinks, Nat. Geosci., 1, 430–437, 2008.
Rodgers, C. D.: Inverse Methods for Atmospheric Sounding – The-ory and Practice, 2, 256, doi:10.1142/9789812813718, 2000. Rodgers, C. D. and Connor, B. J.: Intercomparison of remote
sound-ing instruments, J. Geophys. Res.-Atmos., 108, published online, doi:10.1029/2002JD002299, 2003.
Rodhe, H., Dentener, F., and Schulz, M.: The global distribution of acidifying wet deposition, Environ. Sci. Technol., 36, 4382– 4388, 2002.
Rothman, L. S., Gordon, I. E., Babikov, Y., Barbe, A., Chris Benner, D., Bernath, P. F., Birk, M., Bizzocchi, L., Boudon, V., Brown, L. R., Campargue, A., Chance, K., Cohen, E. A., Coudert, L. H.,
Devi, V. M., Drouin, B. J., Fayt, A., Flaud, J. M., Gamache, R. R., Harrison, J. J., Hartmann, J. M., Hill, C., Hodges, J. T., Jacque-mart, D., Jolly, A., Lamouroux, J., Le Roy, R. J., Li, G., Long, D. a., Lyulin, O. M., Mackie, C. J., Massie, S. T., Mikhailenko, S., Müller, H. S. P., Naumenko, O. V., Nikitin, A. V., Orphal, J., Perevalov, V., Perrin, A., Polovtseva, E. R., Richard, C., Smith, M. A. H., Starikova, E., Sung, K., Tashkun, S., Tennyson, J., Toon, G. C., Tyuterev, V. G., and Wagner, G.: The HITRAN2012 molecular spectroscopic database, J. Quant. Spectrosc. Ra., 130, 4–50, doi:10.1016/j.jqsrt.2013.07.002, 2013.
Schaap, M., van Loon, M., ten Brink, H. M., Dentener, F. J., and Builtjes, P. J. H.: Secondary inorganic aerosol simulations for Europe with special attention to nitrate, Atmos. Chem. Phys., 4, 857–874, doi:10.5194/acp-4-857-2004, 2004.
Senten, C., De Mazière, M., Dils, B., Hermans, C., Kruglanski, M., Neefs, E., Scolas, F., Vandaele, A. C., Vanhaelewyn, G., Vigouroux, C., Carleer, M., Coheur, P. F., Fally, S., Barret, B., Baray, J. L., Delmas, R., Leveau, J., Metzger, J. M., Mahieu, E., Boone, C., Walker, K. A., Bernath, P. F., and Strong, K.: Technical Note: New ground-based FTIR measurements at Ile de La Réunion: observations, error analysis, and comparisons with independent data, Atmos. Chem. Phys., 8, 3483–3508, doi:10.5194/acp-8-3483-2008, 2008.
Shephard, M. W. and Cady-Pereira, K. E.: Cross-track Infrared Sounder (CrIS) satellite observations of tropospheric ammonia, Atmos. Meas. Tech., 8, 1323–1336, doi:10.5194/amt-8-1323-2015, 2015.
Shephard, M. W., Cady-Pereira, K. E., Luo, M., Henze, D. K., Pin-der, R. W., Walker, J. T., Rinsland, C. P., Bash, J. O., Zhu, L., Payne, V. H., and Clarisse, L.: TES ammonia retrieval strat-egy and global observations of the spatial and seasonal vari-ability of ammonia, Atmos. Chem. Phys., 11, 10743–10763, doi:10.5194/acp-11-10743-2011, 2011.
Shephard, M. W., McLinden, C. A., Cady-Pereira, K. E., Luo, M., Moussa, S. G., Leithead, A., Liggio, J., Staebler, R. M., Akingunola, A., Makar, P., Lehr, P., Zhang, J., Henze, D. K., Millet, D. B., Bash, J. O., Zhu, L., Wells, K. C., Capps, S. L., Chaliyakunnel, S., Gordon, M., Hayden, K., Brook, J. R., Wolde, M., and Li, S.-M.: Tropospheric Emission Spectrometer (TES) satellite validations of ammonia, methanol, formic acid, and car-bon monoxide over the Canadian oil sands, Atmos. Meas. Tech. Discuss., 8, 9503–9563, doi:10.5194/amtd-8-9503-2015, 2015. Skjøth, C. A., Geels, C., Berge, H., Gyldenkærne, S., Fagerli, H.,
Ellermann, T., Frohn, L. M., Christensen, J., Hansen, K. M., Hansen, K., and Hertel, O.: Spatial and temporal variations in ammonia emissions – a freely accessible model code for Europe, Atmos. Chem. Phys., 11, 5221–5236, doi:10.5194/acp-11-5221-2011, 2011.
Sussmann, R., Borsdorff, T., Rettinger, M., Camy-Peyret, C., De-moulin, P., Duchatelet, P., Mahieu, E., and Servais, C.: Technical Note: Harmonized retrieval of column-integrated atmospheric water vapor from the FTIR network – first examples for long-term records and station trends, Atmos. Chem. Phys., 9, 8987– 8999, doi:10.5194/acp-9-8987-2009, 2009.
Sutton, M. A., Reis, S., Riddick, S. N., Dragosits, U., Nemitz, E., Theobald, M. R., Tang, Y. S., Braban, C. F., Vieno, M., Dore, A. J., Mitchell, R. F., Wanless, S., Daunt, F., Fowler, D., Blackall, T. D., Milford, C., Flechard, C. R., Loubet, B., Massad, R., Cellier, P., Personne, E., Coheur, P. F., Clarisse,
L., Van Damme, M., Ngadi, Y., Clerbaux, C., Skjøth, C. A., Geels, C., Hertel, O., Wichink Kruit, R. J., Pinder, R. W., Bash, J. O., Walker, J. T., Simpson, D., Horváth, L., Misselbrook, T. H., Bleeker, A., Dentener, F., and de Vries, W.: Towards a climate-dependent paradigm of ammonia emission and depo-sition, Philos. Trans. R. Soc. London, Ser. B, 368, 20130166, doi:10.1098/rstb.2013.0166, 2013.
Thijsse, T. R., Duyzer, J. H., Verhagen, H. L. M., Wyers, G. P., Way-ers, A., and Möls, J. J.: Measurement of ambient ammonia with diffusion tube samplers, Atmos. Environ., 32, 333–337, 1998. Thomas, R. M., Trebs, I., Otjes, R., Jongejan, P. A. C., ten Brink,
H., Phillips, G., Kortner, M., Meixner, F. X., and Nemitz, E.: An automated analyzer to measure surface-atmosphere exchange fluxes of water soluble inorganic aerosol compounds and reactive trace gases, Environ. Sci. Technol., 43, 1412–1418, 2009. Toon, G. C., Blavier, J.-F., Sen, B., Margitan, J. J., Webster, C. R.,
Max, R. D., Fahey, D. W., Gao, R., DelNegro, L., Proffitt, M., Elkins, J., Romashkin, P. A., Hurst, D. F., Oltmans, S., Atlas, E., Schauffler, S., Flocke, F., Bui, T. P., Stimpfle, R. M., Bonne, G. P., Voss, P. B., and Cohen, R. C.: Comparison of MkIV balloon and ER-2 aircraft measurements of atmospheric trace gases, J. Geophys. Res., 104, 26779–26790, 1999.
Van Damme, M., Clarisse, L., Heald, C. L., Hurtmans, D., Ngadi, Y., Clerbaux, C., Dolman, A. J., Erisman, J. W., and Coheur, P. F.: Global distributions, time series and error characterization of atmospheric ammonia (NH3) from IASI satellite observations, Atmos. Chem. Phys., 14, 2905–2922, doi:10.5194/acp-14-2905-2014, 2014a.
Van Damme, M., Wichink Kruit, R. J., Schaap, M., Clarisse, L., Clerbaux, C., Coheur, P.-F., Dammers, E., Dolman, A. J., and Erisman, J. W.: Evaluating 4 years of atmospheric am-monia (NH3) over Europe using IASI satellite
observa-tions and LOTOS-EUROS model results, J. Geophys. Res.-Atmos., 119, 9549–9566, doi:10.1002/2014JD021911, 2014b. Van Damme, M., Clarisse, L., Dammers, E., Liu, X., Nowak, J. B.,
Clerbaux, C., Flechard, C. R., Galy-Lacaux, C., Xu, W., Neu-man, J. A., Tang, Y. S., Sutton, M. A., ErisNeu-man, J. W., and Coheur, P. F.: Towards validation of ammonia (NH3)
measure-ments from the IASI satellite, Atmos. Meas. Tech., 8, 1575– 1591, doi:10.5194/amt-8-1575-2015, 2015a.
Van Damme, M., Erisman, J. W., Clarisse, L., Dammers, E., Whit-burn, S., Clerbaux, C., Dolman, A. J., and Coheur, P.-F.: World-wide spatiotemporal atmospheric ammonia (NH3) columns
vari-ability revealed by satellite, Geophys. Res. Lett., 42, 8660–8668, doi:10.1002/2015GL065496, 2015b.
Vigouroux, C., Hendrick, F., Stavrakou, T., Dils, B., De Smedt, I., Hermans, C., Merlaud, A., Scolas, F., Senten, C., Vanhaelewyn, G., Fally, S., Carleer, M., Metzger, J.-M., Müller, J.-F., Van Roozendael, M., and De Mazière, M.: Ground-based FTIR and MAX-DOAS observations of formaldehyde at Réunion Island and comparisons with satellite and model data, Atmos. Chem. Phys., 9, 9523–9544, doi:10.5194/acp-9-9523-2009, 2009. Vigouroux, C., Stavrakou, T., Whaley, C., Dils, B., Duflot, V.,
Her-mans, C., Kumps, N., Metzger, J.-M., Scolas, F., Vanhaelewyn, G., Müller, J.-F., Jones, D. B. A., Li, Q., and De Mazière, M.: FTIR time-series of biomass burning products (HCN, C2H6,
C2H2, CH3OH, and HCOOH) at Reunion Island (21◦S, 55◦E)
and comparisons with model data, Atmos. Chem. Phys., 12, 10367–10385, doi:10.5194/acp-12-10367-2012, 2012.
Vitousek, P. M., Aber, J., Howarth, R. W., Likens, G. E., Matson, P. A., Schindler, D. W., Schlesinger, W. H., and Tilman, G. D.: Human alteration of the global nitrogen cycle: causes and conse-quences, Ecological Society of America, Washington, D.C., US, 1997.
Volten, H., Bergwerff, J. B., Haaima, M., Lolkema, D. E., Berkhout, A. J. C., van der Hoff, G. R., Potma, C. J. M., Wichink Kruit, R. J., van Pul, W. A. J., and Swart, D. P. J.: Two instruments based on differential optical absorption spectroscopy (DOAS) to mea-sure accurate ammonia concentrations in the atmosphere, Atmos. Meas. Tech., 5, 413–427, doi:10.5194/amt-5-413-2012, 2012. von Bobrutzki, K., Braban, C. F., Famulari, D., Jones, S. K.,
Black-all, T., Smith, T. E. L., Blom, M., Coe, H., Gallagher, M., Gha-laieny, M., McGillen, M. R., Percival, C. J., Whitehead, J. D., El-lis, R., Murphy, J., Mohacsi, A., Pogany, A., Junninen, H., Ranta-nen, S., Sutton, M. A., and Nemitz, E.: Field inter-comparison of eleven atmospheric ammonia measurement techniques, Atmos. Meas. Tech., 3, 91–112, doi:10.5194/amt-3-91-2010, 2010. Whitburn, S., Van Damme, M., Kaiser, J. W., van der Werf,
G. R., Turquety, S., Hurtmans, D., Clarisse, L., Clerbaux, C., and Coheur, P.-F.: Ammonia emissions in tropical biomass burning regions: Comparison between satellite-derived emis-sions and bottom-up fire inventories, Atmos. Environ., 1–13, doi:10.1016/j.atmosenv.2015.03.015, 2015.
Wood, S. W.: Validation of version 5.20 ILAS HNO3, CH4, N2O, O3, and NO2 using ground-based measurements at
Arrival Heights and Kiruna, J. Geophys. Res., 107, 8208, doi:10.1029/2001JD000581, 2002.
Yokelson, R. J., Susott, R., Ward, D. E., Reardon, J., and Griffith, D. W. T.: Emissions from smoldering combustion of biomass mea-sured by open-path Fourier transform infrared spectroscopy, J. Geophys. Res., 102, 18865, doi:10.1029/97JD00852, 1997. Yokelson, R. J., Urbanski, S. P., Atlas, E. L., Toohey, D. W.,
Al-varado, E. C., Crounse, J. D., Wennberg, P. O., Fisher, M. E., Wold, C. E., Campos, T. L., Adachi, K., Buseck, P. R., and Hao, W. M.: Emissions from forest fires near Mexico City, At-mos. Chem. Phys., 7, 5569–5584, doi:10.5194/acp-7-5569-2007, 2007.
Zander, R., Mahieu, E., Demoulin, P., Duchatelet, P., Roland, G., Servais, C., De Mazière, M., Reimann, S., and Rinsland, C. P.: Our changing atmosphere: Evidence based on long-term infrared solar observations at the Jungfraujoch since 1950, Sci. Tot. Env-iron., 391, 184–195, 2008.
Zhu, L., Henze, D. K., Cady-Pereira, K. E., Shephard, M. W., Luo, M., Pinder, R. W., Bash, J. O., and Jeong, G. R.: Constraining U.S. ammonia emissions using TES remote sensing observations and the GEOS-Chem adjoint model, J. Geophys. Res. Atmos., 118, 3355–3368, doi:10.1002/jgrd.50166, 2013.