WGEEL Country Reports
Report on the eel stock and fishery in Belgium 2013/2014 Authors
Claude Belpaire, Research Institute for Nature and Forest (INBO), Duboislaan 14, 1560 Groenen-daal-Hoeilaart, Belgium. Tel. +32 +32 2 658 04 11. Fax +32 2 657 96 82 Claude.Belpaire@inbo.be
David Buysse, Research Institute for Nature and Forest (INBO), Kliniekstraat 25, 1070 Brussels, Belgium
Jan Breine, Research Institute for Nature and Forest (INBO), Duboislaan 14, 1560 Groenendaal-Hoeilaart, Belgium
Hugo Verreycken, Research Institute for Nature and Forest (INBO), Duboislaan 14, 1560 Groenendaal-Hoeilaart, Belgium
Michael Ovidio, Laboratoire de Démographie des Poissons et Hydroécologie, Unité de Biologie du Comportement, Institut de Zoologie, Département des Sciences et Gestion de l'Environnement, Université de Liège, Quai van Beneden 22, 4020 Liège, Belgium
Billy Nzau Matondo, Laboratoire de Démographie des Poissons et Hydroécologie, Unité de Biologie du Comportement, Institut de Zoologie, Département des Sciences et Gestion de l'Environnement, Université de Liège, Quai van Beneden 22, 4020 Liège, Belgium
Jens De Meyer, Ghent University, Evolutionary Morphology of Vertebrates & Zoology Museum, K.L. Ledeganckstraat 35, 9000 Gent (Belgium)
Dominique Adriaens, Ghent University, Evolutionary Morphology of Vertebrates & Zoology Museum, K.L. Ledeganckstraat 35, 9000 Gent (Belgium)
Kathleen Roland, Unit of Research in Environmental and Evolutive Biology (URBE), University of Namur (FUNDP), Rue de Bruxelles, 61, 5000 Namur (Belgium)
Patrick Kestemont, Unit of Research in Environmental and Evolutive Biology (URBE), Univer-sity of Namur (FUNDP), Rue de Bruxelles, 61, 5000 Namur (Belgium)
Kristof Vlietinck, Agency for Nature and Forests, Koning Albert II-laan 20/bus 8, 1000 Brussels, Belgium.
Reporting Period: This report was completed in October 2014, and contains data up to 2014.
1. Introduction
This report is written in preparation of the EIFAAC/ICES Working Group on Eel meet-ing at Copenhagen (4–10 September 2013). Extensive information on the eel stock and fishery in Belgium has been presented in the previous Belgian country reports (i.e. Belpaire et al., 2006; 2007; 2008; 2009; 2010, 2011, 2012 and 2013), in the Belgian Eel Man-agement Plan (EMP), in the first report submitted in line with Article 9 of the eel Reg-ulation 1100/2007 (Vlietinck et al., 2012). This report should thus be read in conjunction with those documents.
Four international RBDs are partly lying on Belgian territory: the Scheldt (Schelde/Es-caut), the Meuse (Maas/Meuse), the Rhine (Rijn/Rhin) and the Seine. For description of the river basins in Belgium see the 2006 Country Report (Belpaire et al., 2006). All RBDs are part of the North Sea ICES ecoregion.
In response to the Council Regulation CE 1100/2007, Belgium has provided a single Eel Management Plan (EMP), encompassing the two major river basin districts (RBD) pre-sent on its territory: the Scheldt and the Meuse RBD.
Given the fact that the Belgian territory is mostly covered by two internationals RBDs, namely the Scheldt and Meuse, the Belgian Eel Management Plan was prepared jointly by the three Regional entities, each respectively providing the overview, data and measures focusing on its larger RBDs. The Belgian EMP thus focuses on the Flemish, Brussels and Walloon portions of the Schelde/Escaut RBD, and the Walloon and Flem-ish portions of the Meuse/Maas RBD.
The Belgian EMP has been approved by the European Commission on January 5th, 2010.
The three Belgian authorities (Flanders, Wallonia or Brussels Regions) are responsible for the implementation and evaluation of the proposed EMP measures on their respec-tive territory.
In the next years, all eel-related measures proposed in the Belgian EMP will be fine-tuned according to the existing WFD management plans and implemented in such manner by the responsible regional authorities.
The Belgian EMP focuses on: For the Flemish region
• the ban of fyke fishing on the lower Scheldt in 2009;
• making up an inventory of the bottle necks for upstream eel migration (pri-ority and timing for solving migration barriers).
Specific action in 2010–2014: In Flanders, 38 fish migration bottlenecks of high priority were identified. 90% has to be solved at the end of 2015 and the remaining part by 2021. Until mid-2013, eight of the 38 bottlenecks were remediated and for several of them remediations are planned. In addition, a number of bottlenecks of moderate priority were remediated. In 2013, a study was started at the sea sluices of Leopold Canal and Schipdonk Canal to optimize management of the sluices in order to allow glass eel migration.
For downward migration
Specific action in 2012–2014: In the fall of 2013 a research will start on the Albert Canal to estimate the damage and mortality causes by the combined pump/hydropower in-stallations. Also downstreaming silvers eels will be equipped with transmitters in or-der to study their behaviour at the pump/hydropower installations and in oror-der to determine to which amount they use the Albert Canal as downstream migration route. Controlling poaching
Specific action in 2012–2014: actions have been focused and will be continued specifi-cally on the Scheldt estuary, on the Nete catchment and in the polders. Illegal fishing equipment was seized.
Glass eel restocking programme
Specific action in 2012–2014: In Flanders 156 kg, 140 kg and 500 kg were stocked respec-tively in 2012, 2013 and 2014.
achieving WFD goals for water quality
Specific action in 2010–2015: Flanders continues to work to the development of water treatment infrastructure to achieve the good ecological status and ecological potential for the WFD.
Eel stock monitoring
Specific action in 2012–2014:
Glass eel: the monitoring of the glass eel recruitment at Nieuwpoort (River IJzer) has been continued in 2013 and 2014, and will be continued in upcoming years.
Yellow eel/silver eel: A new report (Stevens et al., 2013) discusses the methodology for calculating the escapement of silver eel in Flanders. The suitability of the new Moni-toring Network Freshwater Fish for the European Eel Regulation reporting is discussed and recommendations are made to improve the methodology and validate the model results.
Eel quality monitoring
Specific action in 2012–2014: Flanders has contributed to the scientific work about the status and effects of hazardous substances on the eel (see abstracts under subchapter 11.3). Flanders continues to coordinate the Eel Quality Database (Belpaire et al., 2011b), for which a new application has been developed. A pilot programme to monitor eel and perch quality with respect to their levels of contaminants for reporting to the WFD has been finalised.
General status
The European eel is categorized as ‘Critical Endangered’ on the new Red List of Fishes in Flanders.
For the Walloon region
No updated information was made available by the Walloon region. We repeat here the information provided in the 2012 report.
• avoiding mortality at hydropower stations;
• sanitation of migration barriers on main waterways (especially in the Meuse catchment);
• Glass eel restocking programme.
No information was provided by the Walloon Region. Controlling poaching
Specific action in 2010–2012: actions have been focused specifically on the river Meuse and in the canals during the night. Numerous illegal fishing equipment was seized. In the coming years, Belgium will pursue with its neighbouring countries the develop-ment and impledevelop-mentation of cross boundary eel managedevelop-ment plans. These coordina-tion activities will take place within the Internacoordina-tional Scheldt Commission (ISC) and the International Meuse Commission (IMC).
In June 2012 Belgium submitted the first report in line with Article 9 of the eel Regula-tion 1100/2007. This report outline focuses on the monitoring, effectiveness and out-come of the Belgian Eel Management Plan.
2. Time-series data 2.1. Recruitment
2.1.1 Glass eel recruitment
2.1.1.1 Commercial
There are no commercial glass eel fisheries. 2.1.1.2 Recreational
There are no recreational glass eel fisheries. 2.1.1.3 Fishery independent
Glass eel recruitment at Nieuwpoort at the mouth of River Yser (Yser basin)
In Belgium, both commercial and recreational glass eel fisheries are forbidden by law. Fisheries on glass eel are carried out by the Flemish government. Former years, when recruitment was high, glass eels were used exclusively for restocking in inland waters in Flanders. Nowadays, the glass eel caught during this monitoring are returned to the river.
Long-term time-series on glass eel recruitment are available for the Nieuwpoort station at the mouth of the river Yser. Recently new initiatives have been started to monitor glass eel recruitment in the Scheldt basin (see below).
For extensive description of the glass eel fisheries on the river Yser see Belpaire (2002, 2006).
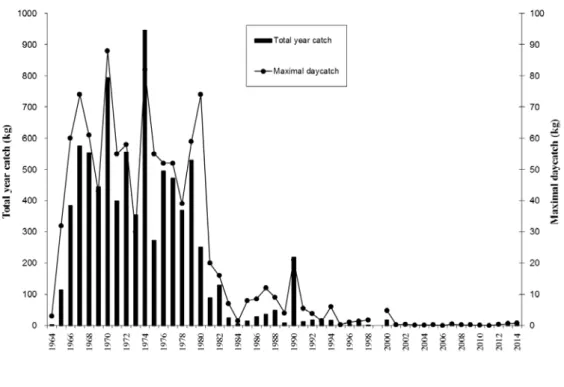
Figure 1 and Table 1 give the time-series of the total annual catches of the dipnet fish-eries in the Nieuwpoort ship lock and give the maximum day catch per season. Since the last report the figure has been updated with data for 2014.
Fishing effort in 2006 was half of normal, with 130 dipnet hauls during only 13 fishing nights between March 3rd, and June 6th. Catches of the year 2006 were extremely low and close to zero. In fact only 65 g (or 265 individuals) were caught. Maximum day catch was 14 g. These catches are the lowest record since the start of the monitoring (1964).
In 2007 fishing effort was again normal, with 262 dipnet hauls during 18 fishing nights between February 22nd, and May 28th. Catches were relatively good (compared to for-mer years 2001–2006) and amounted 2214 g (or 6466 individuals). Maximum day catch was 485 g. However this 2007 catch represents only 0.4% of the mean catch in the pe-riod 1966–1979 (mean = 511 kg per annum, min. 252–max. 946 kg).
In 2008 fishing effort was normal with 240 dipnet hauls over 17 fishing nights. Fishing was carried out between February 16th and May 2nd. Total captured biomass of glass eel amounted 964.5 g (or 3129 individuals), which represents 50% of the catches of 2007. Maximum day catch was 262 g.
In 2009 fishing effort was normal with 260 dipnet hauls over 20 fishing nights. The fishing was carried out between and February 20th and May 6th. Total captured bio-mass of glass eel amounted 969 g (or 2534 individuals), which is similar to the catches of 2008). Maximum day catch was 274 g.
In 2010 fishing effort was normal with 265 dipnet hauls over 19 fishing nights. The fishing was carried out between and February 26th and May 26th. Total captured bio-mass of glass eel amounted 318 g (or 840 individuals). Maximum day catch was 100 g. Both total captured biomass, and maximal day catch is about at one third of the quan-tities recorded in 2008 and 2009. Hence, glass eel recruitment at the Yser in 2010 was at very low level. The 2010 catch represents only 0.06% of the mean catch in the period 1966–1979 (mean = 511 kg per annum, min. 252–max. 946 kg).
In 2011 fishing effort was normal with 300 dipnet hauls over 20 fishing nights. The fishing was carried out between and February 16th and April 30th. Compared to 2010, the number of hauls was ca. 15% higher, but the fishing period stopped earlier, due to extremely low catches during April. Total captured biomass of glass eel amounted 412.7 g (or 1067 individuals). Maximum day catch was 67 g. Total captured biomass is similar as the very low catches in 2010. Maximal day catch is even lower than data for the four previous years (2007–2010). Overall, the quantity reported for the Yser station should be regarded as very low, comparable to the 2010 record. The 2011 catch repre-sents only 0.08% of the mean catch in the period 1966–1979 (mean = 511 kg per annum, min. 252–max. 946 kg).
In 2012 fishing effort was higher than previous years with 425 dipnet hauls over 23 fishing nights. The fishing was carried out between and March 2nd and May 1st. Com-pared to 2010, the number of hauls was 42% higher. Total captured biomass of glass eel amounted 2407.7 g (or 7189 individuals). Maximum day catch was 350 g. Both, the total captured biomass and the maximum day catch are ca. six times higher than in 2010. Overall, the quantity reported in 2012 for the Yser station increased significantly compared to previous years and is similar to the 2007 catches. Still, the 2012 catch rep-resents only 0.47% of the mean catch in the period 1966–1979 (mean = 511 kg per an-num, min. 252–max. 946 kg).
In 2013 fishing effort included 410 dipnet hauls over 23 fishing nights. The fishing was carried out between 20 February and 6 May. Total captured biomass of glass eel amounted 2578.7 g (or 7368 individuals). Maximum day catch was 686 g. So compared to 2012, similar fishing effort (number of hauls), and similar year catches, but higher maximum day catch.
In 2014 fishing effort included 460 dipnet hauls over 23 fishing nights. The fishing was carried out between 24 February and 25 April. Total captured biomass of glass eel amounted 6717 g (or 17 815 individuals). Maximum day catch was 770 g. So compared to 2013, same number of fishing nights, but 12% more hauls (increased fishing effort in number of hauls), and a 2.6 fold increase of the total year catches. Maximum day catch increased with 12% compared to the 2013 value.
Figure 1 and Table 1. Annual variation in glass eel catches at river Yser using the dipnet catches in the ship lock at Nieuwpoort (total year catches and maximum day catch per season). Figure 1A rep-resents the data for the period 1964–2014; Figure 1b shows the data for the period 2000–2014. In Table 1 the presented data are the total year catches between 1964 and 2014. Data Provincial Fisheries Commission West-Vlaanderen.
Decade Year 1960 1970 1980 1990 2000 2010 0 795 252 218.2 17.85 0.318 1 399 90 13 0.7 0.413 2 556.5 129 18.9 1.4 2.408 3 354 25 11.8 0.539 2.579 4 3.7 946 6 17.5 0.381 6.717 5 115 274 15 1.5 0.787 6 385 496 27.5 4.5 0.065 7 575 472 36.5 9.8 2.214 8 553.5 370 48.2 2.255 0.964 9 445 530 9.1 0.969
Other glass eel recruitment studies
The glass eel recruitment-series for the Schelde estuary which was reported in the 2011 Country Report (See Belpaire et al., 2011) for the period 2004–2011 has been stopped. 2.1.2 Yellow eel recruitment
2.1.2.1 Commercial
There is no commercial fishery for yellow eel in inland waters in Belgium. Commercial fisheries for yellow eel in coastal waters or the sea are negligibly small.
2.1.2.2 Recreational No data available. 2.1.2.3 Fishery independent
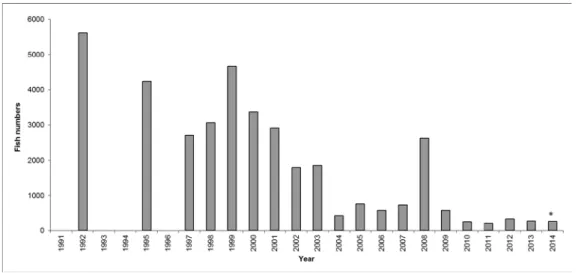
On the Meuse, the University of Liège is monitoring the amount of ascending young eels in a fish-pass. From 1992 to 2014 upstream migrating eels were collected in a trap (0.5 cm mesh size) installed at the top of a small pool-type fish-pass at the Visé-Lixhe dam (built in 1980 for navigation purposes and hydropower generation; height: 8.2 m; not equipped with a ship-lock) on the international River Meuse near the Dutch–Bel-gium border (290 km from the North Sea; width: 200 m; mean annual discharge: 238 m3 s-1; summer water temperature 21–26°C). The trap in the fish-pass is checked continu-ously (three times a week) over the migration period from March to September each year, except in 1994. A total number of 37302 eels was caught (biomass 2445 kg) with a size from 14 cm (1992 and 2001) to 88 cm (2012) and an increasing median value of 28.5 cm (1992) to 40 cm (2012) corresponding to yellow eels. The study based on a con-stant year-to-year sampling effort revealed a regular decrease of the annual catch from a maximum of 5613 fish in 1992 to minimum values of 423–758 in 2004–2007) (Figure 2, Table 2). In 2008 2625 eels were caught. This sudden increase might be explained by the fact that a new fish pass was opened (20/12/2007) at the weir of Borgharen-Maas-tricht, which enabled passage of eels situated downward the weir in the uncanalized Grensmaas. Nevertheless the number of eels were very low again in 2009 (n=584) and 2010 (n = 249). The figure for 2011 (n=208) is the lowest ever recorded since the start of the controls (1992, n = 5613). The figure for 2012 (n= 317) is a bit more than the two previous years. In 2013, 265 eels were caught (size range 19.6–76.5 cm, median 39.1 cm),
the data for 2014 (incomplete data, situation September 2014) are similar with 255 in-dividuals. The decreasing trend in the recruitment of young eels in this part of the Meuse was particularly marked from 2004 onwards. The University of Liège (Ovidio et al., 2012) is continuing a research program financed by EFF-EU to follow the up-stream migration of yellow eels at Lixhe and to analyse the historical trends. Since 2011, every individual yellow eel is pit-tagged and its upstream migration has been followed along detection stations placed at fish-passes located upstream in the Meuse and in the lower course of the river Ourthe (main tributary of River Meuse). A preliminary report has been published (Nzau Matondo et al., 2014). Note that some small changes have been made to the figure as presented in last years’ reports.
Figure 2. Variation in the number of ascending young yellow eels trapped at the fish trap of the Visé-Lixhe dam between 1992 and 2014. Data from University of Liège (J.C. Philippart) in Philippart and Rimbaud (2005), Philippart (2006) and Ovidio (pers. comm. 2014). * Data for 2014 are incomplete (situation 1/9/2014).
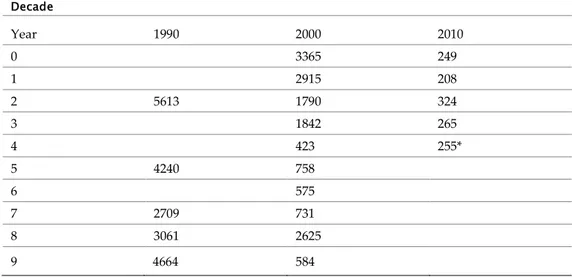
Table 2 Variation in the number of ascending young yellow eels trapped at the fish trap of the Visé-Lixhe dam between 1992 and 2013. Data from University of Liège (J.C. Philippart) in Philippart and Rimbaud (2005), Philippart (2006) and Ovidio (pers. comm., 2014). * Data for 2014 are incomplete (situation 1/9/2014). Decade Year 1990 2000 2010 0 3365 249 1 2915 208 2 5613 1790 324 3 1842 265 4 423 255* 5 4240 758 6 575 7 2709 731 8 3061 2625 9 4664 584
2.2 Yellow eel landings 2.2.1 Commercial
No time-series available. Currently there is no commercial yellow eel fisheries. 2.2.2 Recreational
No time-series available.
Based on an inquiry by the Agency for Nature and Forest in public waters in Flanders in 2008, recreational anglers harvest on a yearly basis 33,6 tons of eel (Vlietinck, 2010). In 2010 a small restriction of eel fishing was aimed by a new regulation (Besluit van de Vlaamse Regering 5/3/2010). Between April 16th and May 31th, and during the night, eels may not be taken home. This results in a roughly estimate of 10% reduction of eel harvest. Hence estimates for 2010 and later are an annual eel harvest of 30 tons (Vlietinck, pers. comm.). There is no distinction between the catch of yellow eel and silver eel, but due to the specific behaviour of silver eel, it is considered that these catches are mainly composed of yellow eel.
Only eels above the size limit of 30 cm are allowed to be taken home. In 2013 a new legislation on river fisheries went into force (Agentschap voor Natuur en Bos, 2013). The total number of fish (all species, including eel) which an angler is allowed to take with him on a fishing occasion is now limited to five. There is no indication to what extent this will have an impact on the total recreational biomass of eel retrieved by recreational fisheries.
2.3 Silver eel landings 2.3.1 Commercial
There is no commercial fishery for silver eel in inland waters in Belgium. Commercial fisheries for silver eel in coastal waters or the sea are negligibly small.
2.3.2 Recreational
No time-series available. Due to the specific behaviour of silver eel catches of silver eel by recreational anglers are considered low.
2.4 Aquaculture production
There is no aquaculture production of eel in Belgium. 2.4.1 Seed supply
2.4.2 Production
2.5 Stocking
2.5.1 Amount stocked
Stocking in Flanders
Glass eel and young yellow eels were used for restocking inland waters by governmen-tal fish stock managers. The origin of the glass eel used for restocking from 1964 on-wards was the glass eel catching station at Nieuwpoort on river Yser. However, due to the low catches after 1980 and the shortage of glass eel from local origin, foreign glass eel was imported mostly from UK or France.
Also young yellow eels were restocked; the origin was mainly the Netherlands. Re-stocking with yellow eels was stopped after 2000 when it became evident that also yel-low eels used for restocking contained high levels of contaminants (Belpaire and Coussement, 2000). So only glass eel is stocked from 2000 on (Figure 3). Glass eel re-stocking is proposed as a management measure in the EMP for Flanders.
In some years the glass eel restocking could not be done each year due to the high market prices. Only in 2003 and 2006 respectively 108 and 110 kg of glass eel was stocked in Flanders (Figure 3 and Table 3). In 2008 117 kg of glass eel from U.K. origin (rivers Parrett, Taw and Severn) was stocked in Flemish waterbodies. In 2009 152 kg of glass eel originating from France (Gironde) was stocked in Flanders. In 2010 (April 20th, 2010) 143 kg has been stocked in Flanders. The glass eel was originating from France (area 20–50 km south of Saint-Nazaire, small rivers nearby the villages of Por-nic, Le Collet and Bouin). A certificate of veterinary control and a CITES certificate were delivered.
In 2011 (21 April 2011) 120 kg has been stocked in Flemish waters. The glass eel was originating from France (Bretagne and Honfleur). A certificate of veterinary control and a CITES certificate were delivered.
In 2012 156 kg has been stocked in Flemish waters. The glass eel was supplied from the Netherlands but was originating from France.
In 2013 140 kg has been stocked in Flemish waters. The glass eel was supplied via a French company (SAS Anguilla, Charron, France).
In 2014 the lower market price allowed a higher quantity of glass eel to be stocked. 500 kg has been stocked in Flemish waters. The glass eel was supplied via a French company (Aguirrebarrena, France).
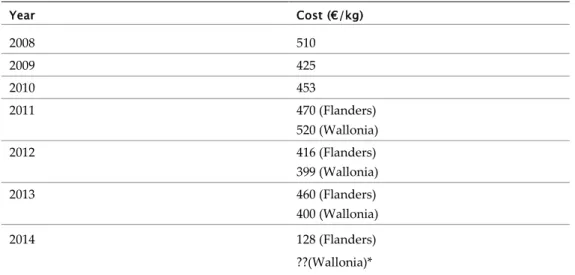
The cost of the glass eel per kg (including transport but without taxes) is presented in Table 2.
Table 2. Prices of restocked glass eel in Belgium (2008–2014). Year Cost (€/kg) 2008 510 2009 425 2010 453 2011 470 (Flanders) 520 (Wallonia) 2012 416 (Flanders) 399 (Wallonia) 2013 460 (Flanders) 400 (Wallonia) 2014 128 (Flanders) ??(Wallonia)*
*No information was provided by the Walloon region about the glass eel stocking in Wallonia in 2014. Glass eel restocking activities in Flanders are not taking account of the variation in eel quality of the restocking sites.
Figure 3 and Table 3. Restocking of glass eel in Belgium (Flanders and Wallonia) since 1994, in kg of glass eel. Flanders is represented in red and Wallonia in blue in the figure. * left Flanders/right Wallonia. Decade 1980 1990 2000 2010 Year 0 0 143 1 54 120/40* 2 0 156/50* 3 108 140/4* 4 175 0 500/?** 5 157,5 0 6 169 110 7 144 0 8 0 117 9 251,5 152
**No information was provided by the Walloon region about the glass eel stocking in Wallonia in 2014. Stocking in Wallonia
In Wallonia, glass eel restocking was initiated in 2011, in the framework of the Belgian EMP. In March 2011 40 kg of glass eel was restocked in Walloon rivers and lakes, in 2012 the amount stocked was 50 kg.
In 2013, for financial reasons no stocking was carried out in Wallonia, except for some restocking in three small rivers in the context of a research program led by the Univer-sity of Liège. This research program is financed by EFF (project code 32-1102-002) to test the efficiency of glass eel restocking in waterbodies of diverse typology. In May 2013 in total 4 kg of glass eel was stocked (1,5 kg in La Burdinale, 1,5 kg in d’Oxhe and 1 kg in Mosbeux). (price per kg was 400 Euros). The origin of these glass eels was UK
glass eels Ldt, UK Survival, dispersion, habitat and growth will be followed from Sep-tember on, to assess to what extent glass eel stocking is a valuable management meas-ure to restore Walloon eel stocks.
See under for more details on this restocking survey.
More information on stocking details for Wallonia is presented in Table 4 (Cost of the glass eel) and Table 5 (origin). No information was provided by the Walloon region about the glasseel stocking in Wallonia in 2014.
2.5.2 Catch of eel <12 cm and proportion retained for restocking
There are no glass eel fisheries in Belgium. As the glass eel caught for monitoring pur-poses by the Flemish authorities at the sluices at the mouth of River Yzer is so low, these glass eel are released directly above the sluices.
2.5.3 Reconstructed time-series on stocking
Stocking in Flanders
Table 5. Source and size of eel restocked in Flanders between 1994 and 2014.
Local Source Foreign Source
Year Glas s Eel Quarantine d Glass Eel Wild Bootlac e On-grown culture d Glas s Eel Quarantine d Glass Eel Wild Bootlac e On-grown culture d 1994 175 5394 1995 157,5 4880 1996 169 4168 1997 144 5517 1998 0 5953 1999 251,5 5208 2000 0 4283 2001 54 2002 0 2003 108 2004 0 2005 0 2006 110 2007 0 2008 117 2009 152 2010 143 2011 120 2012 156 2013 140 201 4 500
Stocking in Wallonia
Table 5. Source and size of eel restocked in Wallonia between 1994 and 2014.
Information to update this table has not been provided by the Walloon region.
Local Source Foreign Source
Year Glas s Eel Quarantine d Glass Eel Wild Bootlac e On-grown culture d Glas s Eel Quarantine d Glass Eel Wild Bootlac e On-grown culture d 1994 1995 1996 1997 1998 1999 2000 2001 2002 2003 2004 2005 2006 2007 2008 2009 2010 2011 40 2012 50 2013 4 2014 ?*
*No information was provided by the Walloon region about the glass eel stocking in Wallonia in 2014. All glass eel used for the Flemish and Walloon restocking programmes are purchased from foreign sources (usually UK or France). There are no quarantine procedures. Nowadays, no bootlace eels, nor ongrown cultured eels are restocked.
Table 5. Origin and amounts of glass eel restocked in Belgium (Flanders and Wallonia) between 2008 and 2013.
Year Region Origin Amount (kg)
2008 Flanders UK 125 2009 Flanders France 152 2010 Flanders France 143 2011 Wallonia UK 40 2011 Flanders France 120 2012 Flanders France 156 2012 Wallonia France 50 2013 Flanders France 140 2013 Wallonia UK 4 2013 Flanders France 500 2013 Wallonia* ? ?
*No information was provided by the Walloon region about the glass eel stocking in Wallonia in 2014. 2.6 Trade in eel
Information on the trade of the eel in Belgium is currently not available, but will be integrated in next year’s report.
3 Fishing capacity 3.1 Glass eel
Commercial nor recreational fishery for glass eels is allowed in Belgium. 3.2 Yellow eel
Professional coastal and sea fisheries
Marine eel catches through professional and coastal fisheries are negligible. Estuarine fisheries on the Scheldt
The trawl fisheries on the Scheldt was focused on eel, but since 2006 boat fishing has been prohibited, and only fyke fishing was permitted until 2009. Since 2009 no more licences are issued, which is as a measure of the Eel Management Plan of Flanders to reduce catches. In 2010 a Decree (Besluit van de Vlaamse Regering van 5 maart 2010) was issued to regulate the prohibition of fyke fishing in the lower Seascheldt.
For a figure of the time-series of the number of licensed semi-professional fishermen on the Scheldt from 1992 to 2009 (Data Agency for Nature and Forests) we refer to Belpaire et al., 2011 (Belgian Eel Country Report 2011).
Recreational fisheries in the Flemish region
The number of licensed anglers was 60 520 in 2004, 58 347 in 2005, 56 789 in 2006, 61 043 in 2007, 58 788 in 2008, 60 956 in 2009, 58 338 in 2010, 61 519 in 2011, 62 574 in 2012 and 64 643 in 2013. The time-series shows a general decreasing trend from 1983 (Figure 6). However in 2007 there was again an increase in the number of Flemish anglers (+7.5% compared to 2006). From an inquiry of the Agency for Nature and Forests in 2008 among 10 000 recreational anglers (36% feedback) it appeared that ca. 7% fishes for eel.
Figure 4. Time-series of the number of licensed anglers in Flanders (above) and Wallonia (below) since 1980 and 1995 respectively (Data Agency for Nature and Forests and Nature and Forestry Di-vision (DNF) of the Walloon Environment and Natural Resources DG (DGRNE). 2012 and later data not updated for Walloon region.
Recreational fisheries in the Walloon Region
Although in constant decline since the nineties, fishermen are still a well-represented community in the Walloon region. The number of licensed anglers was 65 687 in 2004, 63 145 in 2005, 59 490 in 2006, and 60 404 in 2007. Since then, numbers have decreased with 56 864 in 2008, 59 714 in 2009, 54 636 in 2010 and 55 592 in 2011 (Figure 4). The data for 2012 and later were not updated for the Walloon region.
Recreational fisheries in the Brussels capital
The number of licensed anglers is approximately 1400 (Data Brussels Institute for Man-agement of the Environment).
3.3 Silver eel
3.4 Marine fishery
Marine eel catches through professional and coastal fisheries are negligible. 4 Fishing effort
4.1 Glass eel
There is no professional or recreational fisheries on glass eel. 4.2 Yellow eel
See Section 4.2 for the number of recreational fishermen and the proportion of eel fish-ermen.
4.3 Silver eel
There are no professional or recreational fisheries on silver eel. 4.4 Marine fishery
Marine fisheries on eel are not documented and are assumed to be negligible. 5 Catches and landings
5.1 Glass eel
Commercial nor recreational fishery for glass eels is allowed in Belgium. 5.2 Yellow eel
Catches and landings-estuarine fyke fisheries on river Scheldt
Fyke fishing for eel on the lower Scheldt estuary is prohibited now. Since 2009 no more licences for fyke fisheries on the river Scheldt are issued, which is as a measure of the Eel Management Plan of Flanders to reduce fishing capacity. Before 2009 annual catches of eel by semi-professional fyke fishermen was estimated between 2.8 and 12.4 tons. This is thus reduced to zero in 2009 and later.
Catches and landings–recreational fisheries in Flanders
Based on an inquiry by the Agency for Nature and Forest in public waters in Flanders in 2008, recreational anglers harvest on a yearly basis 33,6 tons of eel (Vlietinck, 2010). This figure holds for 2009 too (Vlietinck, pers. comm.). In 2010 a small restriction of eel fishing was aimed by a new regulation (Besluit van de Vlaamse Regering 5/3/2010). Between April 16th and May 31th, and during the night, eels may not be taken home. This results in a roughly estimate of 10% reduction of eel harvest. Hence estimate for 2010, 2011 and 2012 is an annual eel harvest of 30 tons (Vlietinck, pers. comm.). There is no distinction between the catch of yellow eel and silver eel, but due to the specific behaviour of silver eel, it is considered that these catches are mainly composed of yel-low eel.
Other earlier estimates were 121 tonnes per annum and 43 tonnes per annum (Belpaire et al., 2008).
In 2000 a catch and release obligation for the recreational fishing of eel was issued due to high contaminant concentrations, however this law was abolished in 2006. This re-sulted in an increase in yield of yellow eel by recreational fisheries from nihil to the actual 30 tons.
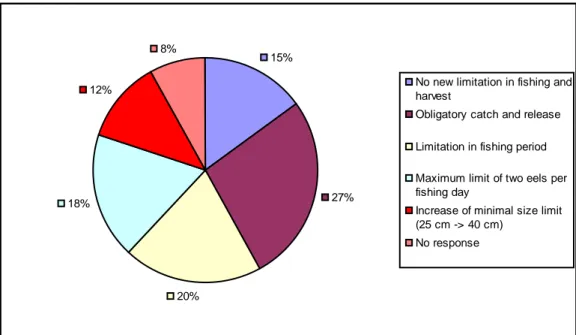
It is worth mentioning that based on the 2008 inquiry in a population of recreational anglers (Vlietinck, 2010), the majority (77%) of anglers are in favour of a restriction in the fishing or the harvest of eel (in the framework of the protection of the eel). 27% of the respondents are in favour of (among other options) the obligatory release of caught eel as management option (Figure 5).
Figure 5. Results of a 2008 inquiry among 10 000 Flemish recreational anglers for their preference in management options for restoring the eel stock. 36% (N = 3627 anglers) responded (Vlietinck, 2010).
Only eels above the size limit of 30 cm are allowed to be taken home.
In 2013 a new legislation on river fisheries went into force (Agentschap voor Natuur en Bos, 2013). The total number of fish (all species, including eel) which an angler is allowed to take with him on a fishing occasion is now limited to five. There is no indi-cation to what extent this will have an impact on the total recreational biomass of eel retrieved by recreational fisheries.
Currently (2014), in Flanders the eel is classified as “Critically Endangered” in the new Flemish Red List of Freshwater Fishes and Lampreys (Verreycken et al., 2014). It is not known if in the future this will have some implications on further restrictions on fish-ing and takfish-ing home eel by recreational fishermen.
Catches and landings–recreational fisheries in Wallonia
No new data available for recreational fisheries in the Walloon Region. See Belpaire et al. (2008) for an overview. In the Walloon region, fishing of eels is prohibited since 2006 (Walloon Government, 2006). By modification of the 1954 law on fishing activities, there is an obligation to release captured eels whatever their length. So from 2006 on, recreational catches of eel in Wallonia should be zero.
Recreational fisheries in Brussels capital No information on eel catches.
15% 27% 20% 18% 12% 8%
No new limitation in fishing and harvest
Obligatory catch and release
Limitation in fishing period
Maximum limit of two eels per fishing day
Increase of minimal size limit (25 cm -> 40 cm)
5.3 Silver eel
There are no professional or recreational fisheries on silver eel. 5.4 Marine fishery
Marine fisheries on eel are negligible and not documented. 5.5 Recreational fishery
See under 6.2 and 7.2 for the information available on recreational fisheries. No further data available.
Recreational Fisheries: Retained and Released Catches.
Retained Released
Inland Marine Inland Marine
Year Angling Passive
Gears Angling Passive gears Angling Passive gears Angling Passive gears
Provide the catch and release mortality (%) used in your country for angling in marine and inland waters.
Recreational Fisheries: Catch and Release Mortality.
Released
Inland Marine
Angling Passive gears Angling Passive gears Year
5.6 Bycatch, underreporting, illegal activities
Bycatch through exploitation of marine fish stocks is not reported and is considered low.
From time to time illegal activities have been observed. Fishing using illegal gears, and illegal selling of catches might be the illegal activities with most impact on the eel stock. Quantitative information is not available.
Table 6-x. Estimation of underreported catches in Country, per EMU and Stage.
Glass eel Yellow eel Silver Eel Combined
(Y + S) Year EMU_code Rep or ted c at ch es (k g) U nde rr ep t. % U nde rr ep t. (kg ) To ta l cat ch es (kg ) Rep or ted c at ch es (k g) U nde rr ep t. % U nde rr ep t. (k g) To ta l cat ch es (kg ) Rep or ted c at ch es (k g) U nde rr ep t. % U nde rr ep t. (k g) To ta l cat ch es (kg ) Rep or ted c at ch es (k g) U nde rr ep t. % U nde rr ep t. (k g) To ta l cat ch es (kg ) 2013 EMU_a EMU_b EMU_c EMU_d EMU_e EMU_f Total/mean (%)
AIM: Determine the % of the underreporting and the total catches of the Country per stage.
NOTE: Please indicate in the text whether the percentage underreported catch is a direct measurement or a guess using the estimate to calculate the underre-ported kgs and Total catches.
Table 6-y. Existence of illegal activities, its causes and the seizures quantity they have caused.
Glass eel Yellow eel Silver Eel Combined
(Y +S)
Year EMU Y/N/? Cause Seizures
(kg) Y/N/? Seizures (kg) Cause Y/N/? Seizures (kg) Cause Y/N/? Seizures (kg) Cause
2013 EMU_a EMU_b EMU_c EMU_d EMU_e EMU_f
AIM: Identify the illegal fishing activities and in case it is possible its causes and the seized kgs in case they were seizures. NOTES:
-Y/N/?:
• Y: you know for sure they have been illegal activities; • N: illegal activities are considered negligible / not significant; • ?: You do not know whether they have been illegal activities or not. -Cause: One of the followings:
• Fishing out of the season; • Fishing without licence; • Fishing using illegal gears;
• Retention of eel below or above any size limit; • Illegal selling of catches.
6 Catch per unit of effort 6.1 Glass eel
Commercial nor recreational fishery for glass eels is allowed in Belgium.
There is some information available on the cpue trend in the governmental glass eel monitoring at Nieuwpoort (River Yzer) (Table 6).
Table 6. Temporal trend in catch per unit of effort for the governmental glass eel monitoring by dipnet hauls at the sluices in Nieuwpoort (River Yzer, 2002–2014). Cpue values are expressed as Kg glass eel caught per fishing day with catch and as Kg glass eel per haul.
Yea r Total year catch Max daycatch
Total year catch/Number of fishing days with catch (Kg/day)
Total year catch/Number of hauls per season (Kg/haul) 200 2 1,4 0,46 0,140 0,0081 200 3 0,539 0,179 0,034 0,0040 200 4 0,381 0,144 0,042 0,0029 200 5 0,787 0,209 0,056 0,0044 200 6 0,065 0,014 0,006 0,0005 200 7 2,214 0,485 0,130 0,0085 200 8 0,964 0,262 0,060 0,0040 200 9 0,969 0,274 0,057 0,0037 201 0 0,318 0,1 0,017 0,0012 201 1 0,412 0,067 0,021 0,0014 201 2 2,407 0,35 0,105 0,0057 201 3 2.578 0.686 0.112 0.0063 201 4 6.717 0.770 0.292 0.0146 6.2 Yellow eel
There are only rough estimates about the catches of eel by recreational fishing. These data are based on an inquiry (N=3627 responses) by the Agency for Nature and Forest in public waters in Flanders in 2008 (Vlietinck, 2010). At that time recreational anglers harvest on a yearly basis 33,6 tons of eel. 6.6% of the recreational fishermen (N=58 788) are eel fishermen. So 3880 eel fishermen are catching 33.6 tons, or an average eel fish-ermen is fishing 8.7 kg eel per year.
6.3 Silver eel
There are no professional or recreational fisheries on silver eel. 6.4 Marine fishery
Marine fisheries on eel are negligible and not documented. 7 Other anthropogenic and environmental impacts
In Belgium, the eel stock is considerably impacted by an overall poor water quality (especially for Flanders), and by a multitude of migration barriers (draining pumps, sea sluices, dams, weirs, impingement by power stations and hydropower units). Water quality
Improvement of water quality by installing purification units is an on-going process (within the objectives of the Water Framework Directive). As an example the installa-tion of an important purificainstalla-tion unit in 2007 on the River Senne (north of Brussels) purifying the waste waters of the capital, has led to an impressive increase in the eel population in river Senne and Rupel during 2008 and 2009. Due to a temporary closure of the water treatment plant (for technical reasons) at the end of 2009 all eels disap-peared, subsequent monitoring showed that the eel population restored approximately six months after restart of the plant.
Restoring migration possibilities
On April 26, 1996, the Benelux Decision about free fish migration was adopted. The Decision sets that the Member States should guarantee free fish migration in all hydro-graphic basins before January 1, 2010. Recently, the 1996 Benelux decision has been evaluated. The general conclusion is that a lot of barriers have been removed, but also that the timing is not achievable and that the focus should be on the most important watercourses. On June 16, 2009 a new Benelux Decision (Benelux, 2009) was approved. According to this new Decision, Member States commit themselves to draw up a map indicating the most important watercourses for fish migration. Hereto, the Research Institute for Nature and Forest (INBO) drew up a proposal for this prioritization map based on ecological criteria (Figure 6).
The proposal for the new prioritization map accounts for both the distribution of EU Habitat Directive species and the recommendations of the eel management plan. In addition, the Benelux Decision allows accounting for regionally important fishes. Therefore, we also accounted for the distribution of the rheophilic species for which Flanders has developed a restoration program (dace, chub and burbot).
The total length of the prioritization network of Flemish water courses is 3237 km (al-most 15% of the total length of the watercourses in Flanders). Besides the barriers on the selected watercourses, also pumping stations and hydro turbines on unselected water courses should be taken into account. Depending on their location and function-ing, pumping stations and hydro turbines may have a significant impact on the sur-vival of downstream migrating fish and eel in particular. The results of a survey of pumping stations in Flanders will be used to draw up a list of the most harmful pump-ing stations. This list will then be added to the prioritization map.
The prioritization map gives an overview of the water courses that should be barrier-free in order to preserve the populations of the target species. Hereto a distinction is made between obstacles of first and second priority. Obstacles of first priority are those
located on the main rivers of the major river basins (Scheldt and Meuse). 90% of these barriers should be eliminated by 2015, the remaining 10% by 2021. In Flanders, the highest priority is given to the obstacles on the River Scheldt and to the obstacles that should be removed first according to the eel management plan. The remaining obsta-cles on the water courses of the prioritization map are assigned to the second priority. These obstacles will be divided into three groups. 50% of these should be removed before December 31, 2015. 75% should be removed before December 31, 2021 and 100% by December 31, 2027.
Additionally, water courses of special attention were selected. These are water courses that have important fish habitat, but where the removal of migration barriers is not a priority. These water courses are important for the restoration of the eel stock, have an ecologically valuable structure or are located in a sub-basin where Habitat Directive species occur. They are not part of the prioritization map and have no timing for the removal of existing migration barriers. However, downstream migration should be guaranteed in these water courses and if an opportunity arises, the existing fish migra-tion barriers should be removed.
Figure 6. Fish migration prioritization network of Flemish water courses (blue) and water courses of special attention (grey) following the Benelux Decision “Free migration of fish” M(2009)1. An update of the anthropogenic impacts has recently been made in the framework of the report of the evaluation of the Belgian EMP (Vlietinck et al., 2012). We refer to this document for a more complete description of the anthropogenic impacts on the stock. In summary following management measures are foreseen:
Table 7. Status of measures of habitat restoration as reported in the evaluation of the Belgian EMP (Vlietinck et al., 2012).
Measures region status timing
Resolving migration barriers for
upstream migration Flanders In progress 2027 Resolving migration barriers for
upstream migration
Wallonia In progress 2027
Measures to protect eels from impingment (by industries using cooling water) during their downward migration.
Measures to protect eels from hydropower installations during their downward migration.
Wallonia In progress To be defined
Measures to protect eels from hydroturbines and pumping stations during their downward migration.
Flanders In progress To be defined
Measures to attain good ecological status or good ecological potential of water bodies.
Belgium In progress 2027
Measures for sanitation of polluted sediments
Flanders To be started To be defined Wallonia In progress To be defined
Although numerous pumping stations have been used by water managers for numer-ous applications on rivers, canals and other waterbodies, their impact on fish popula-tions is poorly understood. Buysse et al. (2014) investigated European eel mortality after natural downstream passage through a propeller pump and two Archimedes screw pumps at two pumping stations on two lowland canals in Belgium. Fykenets were mounted permanently on the outflow of the pumps during the silver eel migra-tion periods. Based on the condimigra-tion and injuries, maximum eel mortality rates were assessed. Mortality rates ranged from 97 ± 5% for the propeller pump to 17 ± 7% for the large Archimedes screw pump and 19 ± 11% for the small Archimedes screw pump. Most injuries were caused by striking or grinding. The results demonstrate that pump-ing stations may significantly threaten escapement targets set in eel management plans (Buysse et al., 2014).
Research in progress into the possibilities for glass eel migration to the Diversion Canal of the Leie (DCL) and the Leopold Canal (LC) in Zeebrugge
Previous research conducted by INBO (commissioned by W&Z) near the Ganzepoot in Nieuwpoort and the Sas Slijkens in Ostend showed that reverse drain management significantly increases the upstream migration of glass eels from the sea to fresh water. Hence this study investigated the applicability of this reverse drain management on another fresh water/sea transition of the Diversion Canal of the Leie and that of the Leopold Canal in Zeebrugge. These two canals with a sharp salt/fresh water transition are two potentially important land inwards routes for glass eels in Flanders.
We looked at how many glass eels migrated upstream in the LC by applying the re-verse lock management. In this study the arriving glass eels were quantified when doors were 'slightly opened'. Quantification was done by sampling at one of the LC lock slides with a glass eel net which is inserted into the groove of the lock orifice. The goal of this research was also to assess whether the measures taken are efficient, i.e. do the glass eels that enter via reversed drain management grow and spread in the LC?
Therefore, we examined whether the glass eels that were admitted by modified drain management also lead to a significant increase in the eel population. In a relatively well-sealed trajectory of the LC between the lock slide in Zeebrugge and the weir in St Laureins, eels will be sampled in at least two consecutive years with different methods (electrofishing, fykenetting). This study should provide an answer to the following re-search question: Is there a significant increase in eel density in the LC between Zee-brugge and St Laureins by applying the reverse lock management?
9 Scientific surveys of the stock 9.1 Glass eel
See Section 3.1.1.3 Glass eel recruitment at Nieuwpoort at the mouth of River Yser (Yser basin).
Evaluation of the efficiency of the glass eel restoking and dispersal and habitat use of glass eel The University of Liege is carrying out a research project on the efficiency of restocking glass eel in three small rivers of Wallonia, affluents of rivers Méhaigne, Meuse and Vesdre, in order to increase our knowledge about the potential of restocking pro-grammes in the framework of the international eel management. Preliminary results are reported by Tarrago-Bes (2014).
9.2 Yellow eel
Fish stock monitoring network in Flanders
Since 1994, INBO runs a freshwater fish monitoring network consisting of ca. 1500 sta-tions in Flanders. These stasta-tions are subject to fish assemblage surveys on regular basis (on average every two to four years depending of the typology of the station). This network includes all water types, head streams as well as tributaries (stream width ranging from 0.5 m to 40 m), canals, disconnected river meanders, water retaining ba-sins, ponds and lakes, in all of the three major basins in Flanders (Yser, Scheldt and Meuse). Techniques used for analysing fish stocks are standardized as much as possi-ble, but can vary with water types. In general electrofishing was used, sometimes com-pleted with additional techniques, mostly fyke fishing. All fish are identified, counted and at each station 200 specimens of each species were individually weighed and total length was measured. As much as possible biomass (kg/ha) and density (individu-als/ha) is calculated. Other data available are number (and weight) of eels per 100 m electrofished river bank length or number (and weight) of eels per fyke per day. The data for this fish monitoring network are available via the website http://vis.milieu-info.be/.
This fish monitoring network is now been further developed to cope with the guide-lines of the Water Framework Directive.
A temporal trend analysis has been performed based on a dataset including fish stock assessments on locations assessed during the periods 1994–2000, 2001–2005 and 2006– 2009. 334 locations were assessed in those three periods (30 on canals and 304 on riv-ers). These results have been reported in the 2011 Country Report; see Belpaire et al. (2011) for further details.
In 2012–2013 a new data-analysis has been carried out for the most recent period, in the framework of updating the Red List status of Flanders’ fresh water fishes. In the new Flemish Red List of Freshwater Fishes and Lampreys (Verreycken et al., 2014), eel was placed in the Critically Endangered category. The number of eel individuals, steeply decreased with 75% between the periods 1996–2003 and 2004–2011 and this despite the yearly restocking with glass eel.
Reporting for the Eel Regulation and the Fish stock monitoring network in Flanders
According to the EU Eel Regulation, each Member State has to report every three years on the progress of the implementation of the eel management plans. One of the things
that need to be reported is the effective escapement of silver eels to sea. Both the calcu-lations for the eel management plan and the first interim report are based on data on yellow eel abundances collected by the Flemish Fish Monitoring Network Freshwater. However, the current Monitoring Network for Freshwater Fish was evaluated and merged into a new monitoring network for the Water Framework Directive (Stevens et al., 2013). This report discusses the methodology for calculating the escapement of sil-ver eel in Flanders. The suitability of the new Monitoring Network Freshwater Fish for the European Eel Regulation reporting is discussed and recommendations are made to improve the methodology and validate the model results.
It was concluded that the new Monitoring Network Freshwater Fish covers satisfacto-rily the watercourses of the eel management plan and is suitable for reporting on the distribution of eel in Flanders. However, the number of sampling points in the new monitoring network is strongly reduced. As a result, the estimators for the calculation of the density of yellow eel will be based on a limited number of measurements, result-ing in a lower reliability of these estimators. The new monitorresult-ing network can be used to calculate estimators per basin and per stratum (instead of current classification per basin and typology). This limits the number of combinations and avoids the double spatial component for the small streams in the ecological typology. Possibly a number of combinations can be grouped to increase the number of points per estimator. An analysis of the data from the Monitoring Network Freshwater Fish is necessary to de-termine which classification of watercourses is best suited to dede-termine these estima-tors.
Large rivers, canals and estuaries represent a significant portion of the surface area of watercourses in the eel management plan. However, electric fishing is less efficient or impossible (brackish waters) in these watercourses, as a result of which the density estimators are less reliable. Therefore a method should be developed to improve the density estimators for these watercourses and for the Scheldt estuary in particular. The methodology for calculating the escapement of silver eel is sufficiently suitable for reporting to Europe (see Stevens et al., 2009). However, the method and model param-eters need to be refined to reduce the uncertainty in the model output and the results of the model should be validated with real data on the escapement of silver eels. The report suggests two approaches:
- First, desk studies can be used (1) to improve the calculations of eel mortality and (2) to refine the classification of the freshwater eel habitat (analysis of the habitat and fish data from the Monitoring Network Freshwater Fish). In addi-tion, the habitat analysis is also important to underpin the conversion of eel cpue to eel density.
- On the other hand, field studies are necessary to calibrate the conversion of eel cpue to eel density, to improve the model parameters and to validate the model results.
Finally, supporting research can be used to evaluate the effectiveness of measures in the management plan and to improve the model (e.g. research on the impact of eel quality and on the contribution of the Scheldt estuary in the production and migration of silver eels in Flanders) (Stevens et al., 2013).
River Scheldt fish monitoring at the power station of Doel
Between 1991 and 2012, INBO has been following the numbers of impinged fish at the nuclear power station of Doel on the Lower Scheldt. We refer to the 2012 Country Re-port (Belpaire et al., 2012) for a presentation of results and trends. Unfortunately, due to a shortness of means this monitoring series has been stopped in 2012.
Estuarine fish monitoring by fykes
A fish monitoring network has been put in place to monitor fish stock in the Scheldt estuary using paired fykenets. Campaigns take place in spring and autumn. At each site, two paired fykenets were positioned at low tide and emptied daily; they were placed for two successive days. Data from each survey per site were standardized as number of fish per fyke per day. Figure 8 gives the time trend of eel catches in four locations along the Scheldt (Zandvliet, Antwerpen, Steendorp and Kastel). In the meso-haline zone (Zandvliet) catches are generally low. This could be due to the applied methodology. However, a decline is apparent as no eel was caught in Zandvliet since 2007 (except for fall 2013). Catches in 2012 were very low, but at the more upstream sites in 2013 and 2014 catches are increasing towards normal levels (Data Jan Breine, INBO).
Figure 8. Time trend of fyke catches of eel along the River Scheldt estuary. Numbers are expressed as mean number of eels per fyke per day. Data are split up in spring catches and fall catches. Years without monitoring data are excluded from the X-axis. Data Jan Breine, INBO.
Yellow eel telemetry study in the Méhaigne (Meuse RBD)
In 2009, University of Liège started up a telemetry study on 50–80 cm yellow eels in the Méhaigne, tributary of the river Meuse. The objectives are the evaluation of home range, mobility, habitat choice, impact of alterations of water regime by hydropower stations and the assessment of up and downstream migration. This study aims to study habitat choice of eels in support of the management of river habitat in Walloon rivers. The movements and habitat use of resident yellow eels were studied in a stream stretch having both natural and minimum flow zones. N = 12 individuals (total length 505– 802 mm) were surgically tagged with radio transmitters and released at their capture sites. They were located using manual radio receivers during the daytime from 2 to 5 days/week over periods ranging from 200 to 329 days, for a total of 1098 positions. Eels showed home ranges ranging from 33 to 341 m (median value, 62 m), displayed strong fidelity to sites and demonstrated a great degree of plasticity in habitat use. Eels were slightly mobile throughout the year, but their movements were season and tem-perature dependent, with a maximum during the spring (mean water temtem-perature, 12°C) and a minimum in winter (3°C). Stones and roots (utilization rate greater than 50% of eels for more than 30% of location days) were significantly the most frequently used habitats. Between the two flow zones, the natural flow was the most occupied, with a significantly higher proportion of resident eels (66.7% of radio-tagged yellow eels) and longer occupation (81% of location days) than the minimum flow zone with less suitable habitats (Ovidio et al., 2013).
Eel population study in the Lesse (Meuse RBD)
An ongoing research program financed by the Fonds Européen pour la Pêche (FEP) and the Service Public de Wallonie (SPW), aims to estimate the resident stock of eels in the Lesse River, sub-basin of the Belgian river Meuse. The stock is estimated by the method of capture–recapture sampling and densities are calculated according to the Petersen method. On each sampling site, electrofishing is performed and fykenets are placed. The eels captured are individually tagged with passive integrated transpond-ers. Morphometric measurements such as total length, weight, length of pectoral fins
and eye diameters allowed to determine the stages of eels. As their migration can be compromised by their health state, eel blood samplings are also made on each fish in order to evaluate the physiological and immunological state of the stock. The results of thyroïd hormones (T3 and T4), growth hormone (GH) and Insulin Like Growth Fac-tor 1 (IGF1) measurements will be compared with the stages previously defined. Lyso-zyme and complement activities measurements will give us some indications on the health state of fish individuals. The detection of herpes virus (HVA) is also done in each fish (Roland and Kestemont, 2014).
9.3 Silver eel
Verbiest et al. (2012) published the results of a study on the downstream migration of female silver eel by remote telemetry in the lower part of the River Meuse (Belgium and the Netherlands) using a combination of nine detection stations and manual track-ing. N = 31 eels (LT 64–90 cm) were implanted with active transponders and released in 2007 into the River Berwijn, a small Belgian tributary of the River Meuse, 326 km from the North Sea. From August 2007 till April 2008, 13 eels (42%) started their down-stream migration and were detected at two or more stations. Mean migration speed was 0.62 m/s (or 53 km/day). Only two eels (15%) arrived at the North Sea, the others being held up or killed at hydroelectric power stations, caught by fishermen or by pred-ators or stopped their migration and settled in the river delta. A majority (58%) of the eels classified as potential migrants did not start their migration and settled in the River Berwijn or upper Meuse as verified by additional manual tracking. More details are to be found in the paper.
See under 9.2 for information on a starting FEP research project assessing downstream migration of silver eel at the confluence of the Lesse and the Meuse.
De Canet et al. (2014) estimated the actual and historical eel stock and escapement to the sea estimated for French and Belgium Meuse by applying the EDA.2.0 model (Jouanin et al., 2012, Eel Density Analysis). A total of 19 980 yellow eels and 1000 silver eels was estimated in 2013 in the Belgian part of the Meuse. This number is 5.8 times lower than the estimated number in 1980. Eel presence and abundance are decreasing linearly with the distance to the sea and the cumulative height of dams. As part of this work, a first attempt to estimate the anthropogenic mortality and biomass according to a pristine state has provided some results. However the lack of data and proper biological parameters limited the results to plots used to illustrate the possible outputs. The numbers estimated by the model are fairly lower than previous estimates for this area, and the reasons for this result are discussed.
9 Data collected for the DCF
Not applicable for Belgium as there are no commercial catches in inland waters. Com-mercial catches of eel in coastal waters or marine fisheries are not reported to DCF. See Section 11.1 for data on length and weight gained from research sampling. There are no routine surveys on age of eels. Some silver eels from Flanders have been aged in the framework of the Eeliad program.
10 Life history and other biological information 10.1 Growth, silvering and mortality
L50 = the length at which 50% of the population has silvered (my interpretation of 50% maturity)
Length and age at silvering Fecundity
Weight-at-age
Length–weight relationship Length and weight and growth (DCF)
Flemish Region
Length and weight data of individual eel collected through the freshwater fish moni-toring network are available via the website http://vis.milieuinfo.be/.
An analysis of the length of yellow eels per catchment has been made for the EMP and is presented there.
Verreycken et al. (2011) describe the length–weight relationship (W = aLb) in eel (and other species) from Flanders. Nearly 263 000 individual length–weight (L/W) data, col-lected during 2839 fish stock assessments between 1992 and 2009, were used to calcu-late L/W relationships of 40 freshwater fish species from Flanders. Those stock assessments were performed by INBO in the framework of the Flemish Freshwater Fish Monitoring Network. The study area includes 1426 sampling locations character-ized as lacustrine as well as riverine habitats, including head streams, tributaries, ca-nals, disconnected river meanders, water retaining basins, ponds and lakes. Eel was the fifth most abundant species in our surveys. The equation was based on 17 586 in-dividual eels recorded for total length and weight (Figure 9).
Following equation was found: W = 0.0011 L3.130
Figure 9. Length–weight relation of European eel (n = 17 586) sampled over Flanders in the period 1992–2009.
In order to ascertain to what extent the log10a and b values calculated for the Flemish populations fell within the range available from other studies, we compared the Flem-ish values with the values available in FFlem-ishBase (Froese and Pauly, 2010) from other countries. Flemish a and b values both fell within the 95% CL of the mean European a and b values (Figure 10).
Our data originate from over almost two decades, irrespective of sampling sites, dates and seasons. Because of the dense sampling network in a small geographic area over a long sampling period, extremes are balanced out. Therefore and through the fact that Flanders is situated centrally in Europe, our a and b values may be applicable as refer-ence marks for an European L/W relation for eel. Moreover, our TL range covered the whole range between minimum and maximum length in sufficient numbers, making a and b values valid as mean values for all length ranges (Verreycken et al., 2011).
Figure 10. Estimated intercepts (log10a; Y-axis) versus estimated slope (b; X-axis) for the log10 trans-formed L/W regression and regression line for European eel from European datasets, as available
in Fishbase (Froese and Pauly, 2010), compared to the Flemish populations ( ■; 1992–2009). Linear
regression equation and r² are given (n = number of L/W relationships, including Flanders). (Ver-reycken et al., 2011).
Results from a study on head dimorphism (Ide et al., 2011) are presented in the 2011 Country Report (See Belpaire et al., 2011) for details).
Walloon Region
An analysis of the length of yellow eels in some rivers of the Meuse catchment has been made for the EMP and is presented there.
Head shape dimorphism in glass eel
Recently (De Meyer et al., under review) studied head shape dimorphism in glass eel (A. anguilla). Two phenotypes are present in the yellow eel stage, broadheads and nar-rowheads. While this has been linked to dietary differences, with broadheads feeding on harder and larger prey than narrowheads, very little is known about how and when this dimorphism arises during their ontogeny. Therefore, the authors examined head shape variation at an earlier ontogenetic stage, the glass eel stage, as at this stage, the eels are considered to be non-feeding. Head shape was studied in glass eels from dif-ferent sampling sites (Leopold Canal and the rivers Yser, Severn, Trent and Parret) by both taking measurements and using an outline analysis. We found that there’s already considerable variation in head broadness and bluntness, but no unambiguous support for head shape dimorphism at the glass eel stage was found. Variation in head width/head length ratios in non-feeding glass eels had, however, a similar range as in feeding yellow eels, indicating that head shape in European eel might be at least par-tially determined through other mechanisms than trophic segregation.
10.2 Parasites and pathogens Flemish Region
See for results on a pan European survey on the actual status of Anguillicola in silver eels (Faliex et al., 2012), 2012 Country Report (Belpaire et al., 2012).
Walloon Region
No new information compared to earlier reports. 10.3 Contaminants
Some recent work (recently published papers and contributions to international meet-ings) is summarized below.
In order to meet the requirements of the European Commission, De Jonghe et al. (2014) measured bioaccumulation of hydrophobic micropollutants in muscle tissue of eel (An-guilla an(An-guilla) and perch (Perca fluviatilis) from Flemish waterbodies. Quantified pol-lutants included mercury (Hg), hexachlorobenzene (HCB), hexachlorobutadiene (HCBd), Polybrominated diphenyl ethers (PBDE), Hexabromocyclododecane (HBCDD), perfluorooctane sulfonate (PFOS) and its derivates, dicofol, heptachlor and heptachlorepoxide. Measured Hg and HCB concentrations were compared between species and in time, based on historical data of eel pollutant monitoring in Flanders. In addition two polycyclic aromatic hydrocarbons (PAH), fluoranthene and benzo(a)py-rene, were measured in zebra mussels (Dreissena polymorpha), which were caged for six weeks. At all sample sites eel could be captured, however this was not possible for perch. For perch only (too) small individuals could be captured. An exceeding of the biota environmental quality standard (EQS) was observed for HCB, HBCDD and PFOS at some sample sites. For Hg and PBDE, biota-EQS were exceeded at all sample sites. EQS evaluation for HCB depended on fish species, since more elevated HCB concen-trations were measured in eel compared to roach. Measured Hg concenconcen-trations were dependent on fish size, and strong relations were observed between Hg accumulation in eel and perch. HCB concentrations in eel were found to decrease in time. In contrast, Hg concentrations seem to increase, although measured Hg bioaccumulation was com-parable with levels found in other European studies. Based on results from the present study and data from literature, biota EQS for both Hg and PBDE seem unrealistically low for Flemish and European watercourses. This study recommends eel as the most suitable species to monitor bioaccumulation of hydrophobic micropollutants in Flan-ders. The latter is based on both practical aspects (spatial distribution and amount of biomass) and species-specific aspects of the immature eel related to biomonitoring (sedentary, no gender issues, no reproduction). Furthermore, this study also highlights the need for intercalibration studies relating pollutant concentraties between different species (De Jonghe et al., 2014).
Van Ael et al. (2014) investigated the relationships between the presence of PCBs, OCPs and metals in aquatic ecosystems and the ecological water quality by combining da-tasets of long-term monitoring of chemicals in European eel (Anguilla anguilla, N = 1156) in Flanders (Belgium) and the Ecological Quality Ratio (EQR), based on the as-sessment of fish assemblages at 185 locations. For most pollutants, EQR scores were lower when pollutant levels were higher. Threshold concentrations for a good quality could be formulated for PCB’s, most metals and OCPs. Mixed models suggested that the ecological water quality was significantly correlated with the presence of PCBs. However, the low R2 indicates that other environmental pressures may significantly influence the biotic integrity of fish communities. Empirical data and their analyses are
essential to enable defining threshold values of bioaccumulated levels to allow better protection of the aquatic environment and its biota through associated food webs as demanded by the Water Framework Directive.
In a study by Malarvannan et al. (2014), pooled yellow European eel (Anguilla anguilla (L.)) samples, consisting of 3–10 eels, collected between 2000 and 2009 from 60 locations in Flanders (Belgium) were investigated for persistent contaminants, such as polybro-minated diphenyl ethers (PBDEs), hexabromocyclododecanes (HBCDs), polychlorin-ated biphenyls (PCBs) and dichlorodiphenyltrichloroethane and its metabolites (DDTs). The current study expands the knowledge regarding these contaminant con-centrations, their patterns and distribution profiles in aquatic ecosystems. PBDEs, HBCDs, PCBs, and DDTs were detected in all eel samples and some samples had high concentrations (up to 1400, 9500, 41 600 and 7000 ng/g lw, respectively). PCB levels accounted for the majority of the contamination in most samples. The high variability in PBDE, HBCD, PCB and DDT concentrations reported here is likely due to the variety in sampling locations demonstrating variable local pollution pressures, from highly industrialised areas to small rural creeks. Among PBDEs, BDE-47 (57% contribution to the sum PBDEs), −100 (19%) and −99 (15%) were the predominant congeners, similar to the composition reported in the literature in eel samples. For HBCDs, α-HBCD (74%) was predominant followed by γ-(22%) and β-HBCD (4%) isomers in almost all eel sam-ples. CB-153 (19%) was the most dominant PCB congener, closely followed by CB-138 (11%), CB-180 (9%), CB-187 (8%) and CB-149 (7%). The contribution to the total human exposure through local wild eel consumption was also highly variable. Intake of PBDEs and HBCDs, through consumption of wild eel, was below the RfD values for the aver-age population (consuming on averaver-age 2.9 g eel/day). At 16 out 60 sites, eels exceeded largely the new EU consumption threshold for PCBs (300 ng/g ww for the sum of six indicator PCBs). The current data show an on-going exposure of Flemish eels to PBDEs, HBCDs, PCBs and DDTs through indirect release from contaminated sediments or di-rect releases from various industries.
10.4 Predators
Flemish Region
Information on the occurrence and distribution of the cormorant has been provided for Flanders in the Belgian EMP.
It was estimated that the yearly consumption of eels by cormorants amounts 5.6–5.8 tonnes for Flanders.
Walloon Region
For the Walloon region, no new data were available. See 2008 report and the Belgian Eel Management Plan.
11 Other sampling
Information on habitat, water quality, migration barriers, turbines is available in the Belgian Eel Management Plan.
12 Stock assessment
This section does not contain new information compared to the 2013 Country Report. Information from last year is copied here.