Contents lists available atScienceDirect
Soil & Tillage Research
journal homepage:www.elsevier.com/locate/stillStudying the e
ffect of desiccation cracking on the evaporation process of a
Luvisol
– From a small-scale experimental and numerical approach
D.K. Tran
a,b,⁎, N. Ralaiza
fisoloarivony
a, R. Charlier
b, B. Mercatoris
a, A. Léonard
c, D. Toye
c,
A. Degré
aaUniversity of Liège, Gembloux Agro-Bio Tech, Terra Teaching and Research Centre, Soil–Water–Plant Exchanges, Passage des Déportés 2, 5030 Gembloux, Belgium bUniversity of Liège, Department ArGEnCo, Liège, Belgium
cUniversity of Liège, Chemical Engineering, Liège, Belgium
A R T I C L E I N F O Keywords:
Desiccation cracking Cutanic Luvisol Soil evaporation process
A B S T R A C T
Cracking due to desiccation of the soil surface is a common phenomenon related to the interaction between soil and the atmosphere. Indeed, during dry seasons, high evaporation of pore water near the soil surface leads to an increase in soil suction in this region. Consequently, the suction results in compressive effective stress on the soil structure and produces shrinkage, including cracking. As the crack network forms, the initial soil structure is strongly modified, which provides preferential flow pathways for solute-water and influences the soil hydraulic behaviour in general. The work aims to study the formation of cracks during evaporation process of a Cutanic Luvisol and evaluate how cracking affects the soil evaporation process. Laboratory experiments were performed on one undisturbed soil sample. To do that, a small-scale environmental chamber was designed and equipped with sensors for measuring the ambient temperature and relative humidity, and a digital camera for in-vestigating the initiation and propagation of cracks on the soil surface. In addition to aHYPROP device (UMS GmbH, Munich, Germany), the hydraulic properties and the kinetics of evaporation of soil samples were also determined through the test. Finally, numerical simulations were carried out by using thefinite element code LAGAMINE developed at the University of Liege to emphasize the effect of desiccation cracking on the soil hydraulic conductivity and the moisture transport mechanisms in the soil, as well as exchanges with ambient atmosphere.
1. Introduction
Cracking due to desiccation of the soil surface is a common phe-nomenon related to the interaction between the soil and the atmo-sphere. Indeed, during dry seasons, high evaporation of pore water near the soil surface leads to an increase in soil suction in this region. Consequently, the suction results in compressive effective stress on the soil structure and produces shrinkage in case of cohesive soil with clay minerals content. Due to soil heterogeneity and/or non-uniform water content distribution, along with the restraint conditions in the soilfield, such as less desiccation shrinkage tendency in deeper soil layers, initial conditions of zero net lateral strain, the shrinkage generates an increase in tensile stress at the soil surface. Cracks then initiate when the tensile effective stress exceeds the tensile strength of the soil (Konrad and Ayad, 1997). The extent and the magnitude of the crack network de-pend mostly both on the intrinsic soil properties such as its mineralogy, bulk density and the initial condition of the stressfield. External factors
such as climate conditions including wind speed, temperature, relative humidity, and particularly wetting–drying cycles, and bio- and cryo-turbation are also involved in soil cracking (Rodríguez et al., 2007; Tang et al., 2011, 2016).
The attention in this work is devoted to cracks in an agricultural soil induced by evaporation from the surface. In agricultural land, the presence of cracks modifies significantly the soil structure, control the soil hydraulic behaviour by creating preferentialflow paths for water and nutrients infiltrating deeper into the soil profile (Velde, 1999; Novák et al., 2000;Šimunek et al., 2003). Cracks greatly affect the ir-rigation efficiency by minimizing the amount of water lost to surface runoff. However, at the same time the irrigation undergoes consider-able of water lost below the rooting zone, leading to the redistribution of nutrients (Dekker and Bouma, 1984; Vervoort et al., 1999). Cracks also allow contaminants such as pesticides to bypass the soil matrix through preferentialflow pathways (Kurtzman et al., 2015). According to the Nitrates Directive (European Commission, 2013), high
https://doi.org/10.1016/j.still.2019.05.018
Received 30 January 2019; Received in revised form 10 May 2019; Accepted 21 May 2019 ⁎Corresponding author.
E-mail address:duckien.tran@uliege.be(D.K. Tran).
0167-1987/ © 2019 Elsevier B.V. All rights reserved.
concentration of nitrate leaching from agricultural sources through preferentialflow is one of the main contaminants causing groundwater pollution in many European countries. When considering the influence of climate change (severe drought/heat, less rainfall, etc.), crack for-mation and their effects will bring strong repercussions in the near future. Besides that, the development of desiccation cracks has also been observed in many geotechnical and geoenvironmental applica-tions and affects the behaviour of soil mass. The presence of cracks impacts negatively on the bearing capacity of structure foundations (Silvestri, 2000), as well as on the stability of soil slopes (Andrew, 2003). In case of embankment dams and dikes cracks may evolve into internal piping erosion then leading to the failure (Foster et al., 2000). In the past few decades, desiccation cracking in soil has been widely studied by using both experimental and numerical approaches. Different types of environmental chamber were designed to study cracking in soils as a result of drying/wetting conditions by imposing and monitoring temperature and relative humidity (Cui et al., 2014; Song et al., 2016; Lakshmikantha et al., 2018). Recently,Lozada et al. (2018)have presented an advanced climatic chamber which is able to provide accurate and independent control of temperature, relative hu-midity, solar irradiance, and wind velocity. Image acquisition and analysis by soil surface photographs during the experiments has become an efficient tool for quantifying crack patterns, and cracks morphology (Lakshmikantha et al., 2009; Sanchez et al., 2013;Liu et al., 2013). The crack pattern is characterised according to the distribution of crack lengths, width, orientation, or its fractal properties (Scott et al., 1986; Velde, 1999; Vogel et al., 2005). Experiments also have been conducted to improve the understanding of the initiation and propagation me-chanisms of desiccation cracks. Peron et al. (2009) performed three kinds of desiccation tests on fine-grained soils. Their results showed that cracking initiates close to the onset of desaturation, and suggested that the crack pattern geometry can be explained as a result of energy redistribution through the soil body following cracks initiation. Weinberger (1999)highlighted the importance offlaw discontinuities and layer boundaries in the mechanics of crack growth during de-siccation by tracing the nucleation and the growth path of natural mud cracks. Recently, the electrical resistivity method has been used to characterise the development of desiccation cracks in clayey soil (Tang et al., 2018). An interesting point of this method is its reliable ability to map the potential crack positions before possible visualization. Various studies have been undertaken to analyse the impact of cracks on the soil hydro-mechanical behaviour. As shown inMorris et al. (1992), at the same water content, a cracked soil is more compressible than an intact one and the overall mechanical strength is weakened due to the pre-sence of cracks. The soil mechanical behaviour is also degraded with increasing drying–wetting cycles as the surface of crack ratio and average crack width increase (Tang et al., 2011, 2016). Concerning the soil hydraulic behaviour, the soil hydraulic conductivity and soil water retention are directly controlled by the crack networks (Chertkov and Ravina, 1999; Li et al., 2017). Previous study conducted byAlbrecht and Benson (2001) has shown that due to desiccation cracking the hydraulic conductivity of soil samples increased by several orders of magnitude compared to their initial value. Another important question is to study the effect of crack development on the evaporation process as cracks provide a direct open pathway for water vapour moving from soil pores near the crack wall to the atmosphere.Selim and Kirkham (1970)found that artificially induced shrinkage cracks (0.64 cm wide) in bare soil increased evaporation rate by 12–16% and up to 30% with larger cracks (1.91 cm wide) compared to that from soils with no cracks. However, a recent study on desiccation crackings of clayey soil at small scale laboratory by Tang et al. (2018)showed that the for-mation of cracks at soil surface did not produce dramatic changes on the soil evaporation rate. In order to better evaluate the contribution of desiccation cracks to evaporation rate, more refined works must be carried out. On the numerical modelling of desiccation cracking, dif-ferent approaches were proposed such as the theory of linear elastic
fracture mechanics (LEFM) (Morris et al., 1992; Lachenbruch, 1961), finite elements method (FEM) with or without cohesive fracture and interface elements (Rodríguez et al., 2007; Nguyen et al., 2001;Sánchez et al., 2014; Vo et al., 2017) and discrete element method (DEM) (Peron et al., 2009;Amarasiri et al., 2011). However, most of the works fo-cussed on the initiation and the propagation of cracks, as well as the morphology of the crack network and not on the impact of cracks on soil hydraulic behaviour.
The present work reports a strategy for investigations of the eva-poration process of a Cutanic Luvisol conducted in a small scale en-vironmental chamber with focus on the effects of cracks on the kinetics of evaporation. The experimental campaign was carried out on a soil sample with continuous monitoring of weight, surface cracks and hy-draulic properties including the soil water retention curve (SWRC), conductivity. The development of the desiccation cracks at the soil surface were analysed in parallel with the kinetics of evaporation of the soil sample. Based on the experimental data obtained, numerical modelling of the test were used to seek the impacts of cracks during the evaporation process. Two numerical simulations were performed for an intact sample and a fractured one with a pre-existing crack, by means of a coupled thermo-hydro-mechanical (THM) model for unsaturated soil along with a simple concept of tensile crack development (Olivella and Alonso, 2008; Gerard et al., 2014). Lastly, numerical results obtained were analysed regarding the kinetics of evaporation and the fluid transfer mechanisms of the soil for intact and fractured samples.
2. Material and methods
2.1. Evaporation test
2.1.1. Soil characteristics
The undisturbed soil sample was taken from the field named “Bordia”, at the experimental farm of Gembloux Agro-Bio Tech, in Gembloux, Belgium. The soil type of the researchfield is classified as Cutanic Luvisol according to the WRB (World reference base for soil resources) soil system (WRB, 2006). The soil texture is a silt loam mainly dominated by silt (70–80%), clay (18–22%) and sand (5–10%). The organic matter is characterised by a C:N ratio between 10 and 12 with the quantity of C around 1.35 g per 100 g soil. The soil sample came from no-tillage treatment plots but with incorporation of crop residue. The attention was devoted for the top-soil at a depth of 0–10 cm as its structure presents a strong heterogeneity which is one of the factors promoting crack growth during desiccation. The soil sample ring was chosen to be compatible withHYPROP device for dimensions of 5 cm in height and 8 cm in diameter. The soil bulk density was 1.41 g cm−3.
2.1.2. Measuring system
Fig. 1schematically illustrates the setup of the measuring system, as used in the experiment. Evaporation test was performed by means of theHYPROP device, an accurate instrument to measure the soil water retention curve through evaporation method (Peters and Durner, 2008). In this technique, a saturated soil sample was placed on the device and both were weighed on a precision balance. The soil surface was then exposed to a free evaporation while the bottom was assembled with the sensor unit ofHYPROP device, and considered impermeable for soil water (Fig. 1). The variation in hydraulic head inside the soil sample was assessed by two tensiometers placed at different height while the changes in water content were determined by the changes in the weight of the sample. The evolution of soil temperature at the top and the bottom of the soil sample was measured by a sensor ad-ditionally mounted and a thermistor initially provided by HYPROP, respectively. To accelerate the evaporation process, the measuring system with the soil sample were installed in an small environmental chamber heated by a heat lamp bulb. During the test, the temperature and the relative humidity of the chamber were sequentially recorded.
Along with these measurements, a digital camera of 12 megapixels was positioned above the soil sample to capture images every 30 min and to assess how cracks initiate and evolve on the soil surface.
2.1.3. Measurement of evaporation process
During the evaporation test, theHYPROP device with the soil sample were placed on a 0.01 g precision balance installed in the chamber-dryer and connected to a computer. The mass and the water tension inside the sample changed by evaporation, were recorded in one-min interval by the Tension-View software. The first period is char-acterised by a high constant evaporation rate, presuming the drier chamber conditions are kept stable. If the hydraulic conductivity of the soil sample is high enough, a sufficient amount of soil water can be transmitted to the soil surface to meet the evaporated demand. Hence, the entire sample is constantly evaporated and both tensiometers give almost the same value in the water tension. On the contrary, the top part of the soil sample may dry out whereas the lower part is still humid, hence the top tensiometer shows dryer tensions than the bottom one. When the tensiometers dry out, cavitation occurs and the mea-sured tension drops to zero, the testfinished and the soil sample was removed from theHYPROP device. Finally, the sample was oven dried at 105 °C for 48 h to obtain the dry mass of the soil. TheHYPROP-Fit software was used to evaluation and export the hydraulic function. In this work, the data obtained werefitted with the unimodal constrained model ofGenuchten (1980)for the SWRC and the formulation proposed byMualem (1976)for the hydraulic conductivity, which in fact neglects the cracking effects. It is noted that since the aim of the present work is to introduce a strategy for investigations of the effects of desiccation cracks on the soil evaporation process by combination of experiment and numerical modelling, only the results from one test was chosen and presented in the following sections.
2.2. Numerical model
For the numerical study, a general framework for the modelling of unsaturated porous media is presented. The simulations were con-ducted using the finite element code LAGAMINE developed at the University of Liége (Collin et al., 2002). In this section, only the main constitutive equations are discussed (see Collin (2003)for more de-tails). Firstly, the liquid and heat transfer within the porous medium, as well as in exchange with the atmosphere are described. Secondly, a
model for the simulation of the cracks induced by thermal desiccation with the development of preferentialflow path is introduced. 2.2.1. Thermo-hydraulic model
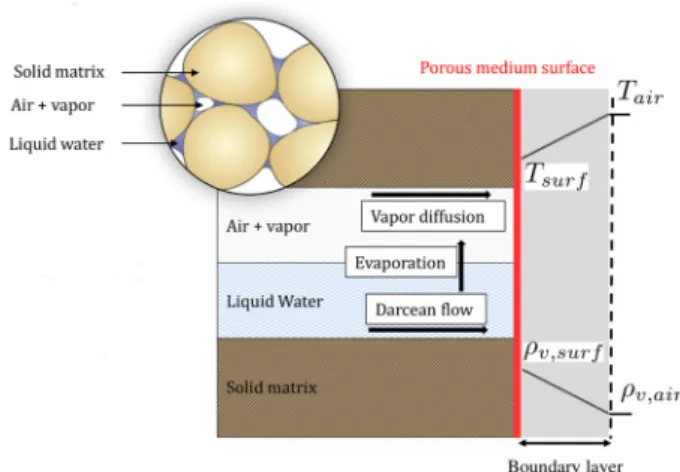
A biphasicflow model is considered to describe the fluid transport processes in partially saturated porous media considering here as a homogeneous soil.Fig. 2 illustrates a porous medium with a solid, a water and a gas phase, including liquid transfer mechanism both in-ternal and exin-ternal. Regarding the inin-ternal transfer, the advective fluxes of both water and gas phases are determined by the generalised Darcy's law. = −k ∇ + μ p ρ qi i( g) i i i (1) here the subscriptsi=w g, indicate the two phases water and gas, hence kiis the phase permeability of the partially saturated medium,μi is the phase dynamic viscosity, pi is the phase pressure andρiis the phase density.
Assuming that the porous medium is non-reactive with a fixed structure, the water and gas permeabilities are strongly dependent on the effective saturation, Se, given by:
= − − S θ θ θ θ e r s r (2)
whereθ is volumetric water content, θris the residual water content, andθs is the saturated water content. In our model the formulation proposed byMualem (1976)was adopted as:
= ⎡ ⎣ ⎢ − ⎛⎝ − ⎞⎠ ⎤⎦⎥ kw K Sw el 1 1 Sem m 1 2 (3) whereKwis the water permeability in fully saturated conditions, m is a model parameter, and l is a pore connectivity parameter, which ac-counts for the correlation between pores and for theflow path tortu-osity.
The water retention curve is defined as the relationship between the amount of water stored in a porous medium and the water tension, expressed as pressure head h [cm]. On the basis of the experimental results, the unimodal constrained model ofGenuchten (1980)is used:
= ⎡ ⎣ + − ⎤⎦ −
(
)
S he( ) 1 (αh) m m 1 1 (4) whereα [cm−1] is the inverse of air entry pressure, pr, represents the minimal capillary pressure needed to desaturated the porous medium, and m is a shape parameter of the model.The diffusive flux of water vapour in the gaseous mixture dry air–water vapour depends on the gradient of water vapour concentra-tion according to Fick's law:
= −D τϕ −S ∇ρ
iv v (1 e) v (5)
whereDvis the diffusion coefficient of vapour into dry air, τ and ϕ are the tortuosity and the porosity of the porous medium, and ρv is the vapour density. It is noted that within a porous medium, the diffusion coefficient,Dv, is affected by a reduction of the volume offered to the diffusion through the air porosity ϕ(1 − Se), as well as the actual length of the diffusion path of molecules through the porous space by means of the tortuosityτ.
The heat transfer in porous medium is described through the heat flux VT, which consists of three terms following conduction, convection and evaporation mechanisms:
= − ∇ + + + + − + + T c ρ c ρ c ρ T T ρ L V q q q i q i Γ [ ( )]( ) ( ) T m p w w w p a a g p v v g v v g v conduction , , , 0 convection latent (6) Fig. 1. Sketch of the measuring system used for evaporation test.
in which, cp w, ,cp a,,cp v, are respectively the water, the air and the vapour
specific heats, T0is the initial temperature of the medium, and L is the water evaporation latent heat (=2500 kJ/kg).
As for the moisture and heat exchange with the ambient, the common assumption is that all the transfers from the surface toward the ambient take place into a thin layer surrounding the porous medium (Gerard et al., 2010; Prime et al., 2015), as shown inFig. 2. In this so called“boundary layer model”, the vapour flow q¯, from the materials to the surroundings can be expressed as the product of a mass transfer coefficient α and a driving potential. The driving potential can be the difference between the air humidity in the ambient and at the soil surface (Anagnostou, 1995), or the difference of vapour potential (Kowalski and Strumillo, 1997), or the difference of the vapour density (Nasrallah and Perre, 1988). In this work, a vapour density difference between the ambient ρv,air and at the soil surface ρv,surf is adopted (Gerard et al., 2010; Prime et al., 2015):
= −
q¯ α ρ( v,surf ρv,air) (7)
= − − −
f¯ Lq¯ β T( air Tsurf) Rn (8) The heatflux exchange between the porous medium and the am-bient, denoted f¯ in Eq.(8), is the sum of three terms. Thefirst term is the latent heat of evaporation which is directly correlated to the vapour mass. The second term is proportional to a heat transfer coefficient β and the difference of the temperature between the ambient Tairand the soil surface Tsurf. The last term Rncorresponds to the net radiantflux from the drying-air and the lamp-bulb to the porous medium surface. The net radiantflux Rnis estimated based on the Stefan–Boltzmann law as the following equation:
= − +
Rn ε σA Ts ( air4 Tsurf4 ) Rlamp (9)
whereεs= 0.95 is the emissivity of the soil surface and the bulb-lamp, σ = 5.67 × 10⁻⁸J m−2K−4s−1is the constant of Stefan-Boltzmann. It is noted that theflux term Rlampfrom the lamp-bulb is negligible since only a small fraction of radiation from the lamp strikes the soil surface. Finally, the mass and heat transfer coefficients are determined based on the experimental data on the kinetic of evaporation by using Eqs.(7) and(8).
2.2.2. Mechanical model
A linear elasticity law is used for the mechanical behaviour of the soil skeleton. In order to describe the stress-strain relationship, the Bishop's effective stress is chosen to work with since it directly provides the effect of the soil suction:
′ = − + −
σij σij p δg ij S pr(g pw)δij (10) where ′σij[Pa] is the effective stress tensor, σij[Pa] is the total stress
tensor, Sr[–] is the water saturation, and δijis Kronecker's tensor, pgand pwdenote respectively gas and water pressure [Pa]. The strain is related to the effective stress through the following relation:
′ =
σ De ε
ij ijkl ij (11)
where ′σijis the elastic stress tensor,εijis the elastic strain and Dijkle is the
global elastic tensor defined as:
= + ⎛ ⎝ − ⎞ ⎠ D 2Gδ δ K 2G δ δ 3 e ijkl ik jl ij kl (12) where K and G are the bulk and the shear moduli given by:
= − K E ν 3(1 2 ) (13) = − + G ν ν K 3(1 2 ) 2(1 ) (14)
where E is the drained Young's modulus,ν is the drained Poisson's ratio of the porous medium.
2.2.3. Embedded fracture model
During the thermal desiccation, an important goal is to characterise the development of crack network induced by shrinkage and the var-iation of the hydraulic properties by creating preferentialflow paths. According toMitchell and Soga (2005), desiccation cracks are mainly tensile cracks. Crack initiation occurs when the tensile strength is reached and the soil permeability evolution is addressed with a strain-dependent relation. Different existing models have taken into account the influence of deformation or fracturing on the hydraulic perme-ability. In this study, the embedded fracture model (Olivella and Alonso, 2008; Gerard et al., 2014) is used to reproduce the development of cracks and preferential flows induced by desiccation through the existing preferential paths in the soil sample.
The basic idea of the embedded fracture model consists of an ap-propriate representation of single fractures predefined in a continuous finite element.Fig. 3illustrates, on the left, a single fracture in a porous medium characterised by its aperture b and, on the right, afinite ele-ment composed of a series of n parallel fractures. The number of tures in an element depends on the width a associated with each frac-ture and on the element size s. The evolution of permeability of the element contributed by fractures kfracturecan be expressed as a function the fracture aperture and its density through the cubic law:
= = + 〈 − 〉 k b a k λ ε ε 12 (1 ( n )) fracture 3 0 0 3 (15) = + 〈 − 〉 b b s n(εn ε ) 0 0 (16) in which, k0is initial permeability of fracture,λ is a parameter which Fig. 2. Illustration of a porous medium and liquid transfer mechanism (Hubert
et al., 2017).
Fig. 3. Illustration of a single fracture of aperture“b” (left) and a finite element size“s” with series of parallel fractures (right) (Olivella and Alonso, 2008).
reflects the density of fractures and its rugosity, εnis the normal strain of the fracture plane while ε0 is a threshold value associated with fracture initiation. If the fracture already exists with an aperture b0the threshold value of strain is set toε0< 0. The current fracture aperture b then is estimated as function of strain evolution as follows:
〈 − 〉 = ⎧ ⎨ ⎩ < − ≥ ε ε ε ε ε ε ε ε 0 if if n n n n 0 0 0 0 (17)
An additional hydro-mechanical coupling can also be introduced by considering an evolution of the retention curve with the fracture de-velopment. For such process, it is assumed that the fracture-aperture opening generates a decrease of the air entry pressure, i.e. the minimal capillary force needed to desaturate the material. The new capillary pressure in fracture zone is obtained by combining Eq.(15)and Kevil's law: = p p k k r f, r,0 0 3 3 (18)
where pr,0 is the capillary pressure for a reference permeability k0, which eventually can be the initial permeability.
2.2.4. Configuration of the simulations
2D-axisymetric simulations of a cylindrical soil sample were per-formed with the geometric configuration and boundary conditions presented inFig. 4. The right external side and the bottom of the sample (the solid grey lines) were considered as impervious boundaries as they were covered by the core ring and the HYPROP device. Vertical and horizontal displacements at those boundaries were blocked in order to promote the development of tensile strain in the soil core. The soil sample was initially saturated. Water and gas pressure are assumed initially constant and equal to the atmospheric pressure i.e.,
= =
pw pa 0.1MPa. The initial temperature of the sample is T0= 26 °C, which corresponds to the measurement of soil temperature at the mo-ment t = 0 h. In order to reproduce the simulation, the sample is sub-jected to a drying condition (i.e., temperature, relative humidity and radiation) as recorded in the chamber-dryer during the experiment (e.g.,Fig. 5d). Evaporation takes place only at the sample surface (the solid red line). The parameters used for the modelling of the evapora-tion test included hydraulic, thermal and mechanical models presented inTables 1–3, respectively. It is noted that the parameters of the hy-draulic model (water retention curve, hyhy-draulic conductivity), as well as the material parameters (density, porosity) were determined ex-perimentally from theHYPROP test. The specific heat of liquid water, water vapour and air are considered as known data, as well as the latent heat of water evaporation. Because of a lack of data, an overall thermal conductivity is taken over the medium. Its value was estimated by adopting the geometric mean of the thermal conductivities of three phases (Gens and Olivella, 2001). Finally, the two transfer coefficients α, β of mass and heat, respectively, between the soil sample and the environmental ambient were determined based on the experimental data on the kinetics of evaporation by using Eqs. (7)and(8). More details about the determination of these transfer coefficients can be found inLéonard et al. (2005), Prime et al. (2015 Jan). Moreover, as the experimental results showed a imperfectly constant evaporation rate during the CRP period (Fig. 5b and e), a linear relation between the mass transfer coefficient and the degree of saturation at the soil surface was assumed in order to reduce the overestimation of the evaporation rate in this period (Gerard et al., 2010). One can imagine that the boundary layer where the vapour exchanges take place, does not re-main perfectly saturated during thefirst period of evaporation (CRP), because the moisture transport was slower from the soil core to the surface than its capacity of evaporation.
Following the configuration above, two simulations of the eva-poration test were considered. Thefirst simulation was performed for an“intact soil” sample without any pre-existing cracks or further cracks
developed by desiccation. Hence, only the standard thermo-hydraulic model discussed in Section2.2was involved in this simulation but the embedded fractured model. The objective here is to demonstrate the capacity of the numerical model in reproducing the evaporation test, including the evolution of soil water evaporation rate and soil tem-perature. Moreover, the results obtained could provide a reference for comparison with any further simulations which involve the presence of cracks.
Based on the“Embedded fracture model” discussed in Section2.2.3, a second simulation was performed by considering a“fractured sample” where a pre-existing crack was pre-defined within the soil sample. The idea is to initiate cracks through preferential paths by considering the initial heterogeneity of the soil sample. The pre-existing fracture has an arbitrary geometry (seeFig. 8a) with properties defined inTable 4. It is noted that only one fracture geometry was considered since informa-tions about crack properties (such as length, width, volume, etc.) were unknown. In addition, the main aim here is to explore to what extent cracks affect the soil drying dynamic both at the global sample scale and locally at the crack scale. More rigorous studies can be conducted where images analysis is used for characterisations of the crack patterns and cracks morphology. Finally, numerical results obtained from two simulations were analysed regarding the kinetics of evaporation and the fluid transfer mechanisms of the soil sample in order to highlight the effects of the pre-defined cracks.
3. Results and discussion
3.1. Experimental results
3.1.1. Kinetics of evaporation
Several research conducted by laboratory tests under controlled conditions (Gerard et al., 2010; Léonard et al., 2005; An et al., 2018), as well asfield studies (Idso et al., 1974) have demonstrated three periods of soil water evaporation. Thefirst period, called constant rate period (CRP) is characterised by a high evaporation rate,1which is only con-trolled by ambient conditions (Léonard et al., 2005) and may remain constant over a wide range of moisture content by a continual supply of water from the interior of the soil. Once the supply of water to the soil surface is not enough to meet the evaporative demand, the evaporation rate drops and the falling rate period (FRP) begins. During the FRP period, the soil surface experiences a rapid drying, the soil evaporation front descends and forms a new dry surface layer. Transitions between periods CRP and FRP is characterised by a crucial parameter, so-called Fig. 4. Geometric configuration and boundary conditions of the problem.
1The evaporation rate, = −
q dmdt, is defined as the water mass loss divided by the evaporation surface, where m [kg] the mass of the soil sample.
“critical-moisture content” (Keey and Suzuki, 1974; Coumans, 2000). Finally, the third period is distinguished by a low, relatively constant evaporation rate, dominated by the water absorbed at the soil
liquid-solid interface.
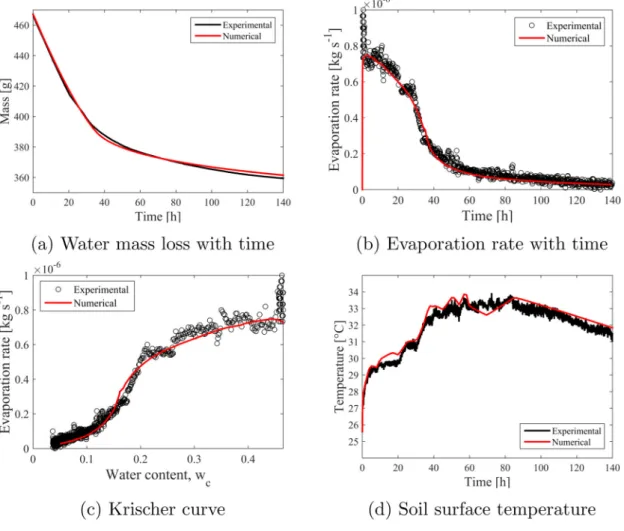
In order to characterise the kinetics of evaporation of the soil sample, three curves can be used: water mass loss versus time (Fig. 5a), evaporation rate versus time (Fig. 5b), and evaporation rate versus averaged moisture content, on a dry basis (Fig. 5c). The last curve, called Krischer curve, is often used since it gives a clear picture of the kinetics of evaporation of materials. Because the water vapour transfer is closely coupled with the thermal process, the Krischer curve was studied in parallel with the variation in soil temperature (Fig. 5d). The experimental results showed three periods of evaporation. After a very short transition time, the first period (CRP) begun with a high eva-poration rate and lasted around 28 h. However, the evaeva-poration rate during this period was not perfectly constant but varied from 0.75 × 10⁻⁶to 0.625 × 10⁻⁶kg s−1. Thereby, soil temperature at the surface sample also did not remain constant as reported in theory, but weakly increased during this period as shown inFig. 5d. The transition between two periods CRP and FRP was identified by an average water content of the soil sample about wcr≈0.21. The FRP period lasted around 18 h. Because the evaporation rate decreased during this period, the remaining amount of energy, after providing for the water Fig. 5. Experimental results on the kinetics of evaporation.
Table 1
Parameters of the hydraulic model
ρw[kg m−3] Liquid water density 1000
μw[Pa s] Water dynamic viscosity 1.E−3
Kw[m2] Water permeability 1.2E−12
l [–] Mualem model parameter 0.5
α [cm−1] Van Genuchten model parameter 0.027
m [–] Van Genuchten model parameter 0.23
θr[–] Residual water content 0
Table 2
Parameters of the thermal model
cp w, [J kg−1K−1] Liquid water specific heat 4180
cp v, [J kg−1K−1] Water vapour specific heat 1800
cp,a[J kg−1K−1] Air specific heat 1000
Γm[W m−1K−1] Medium thermal conductivity 0.9
L [J kg−1] Water evaporation latent heat 2500
Table 3
Parameters of the mechanical model
ρs[kg m−3] Solid density 2620
ϕ [–] Porosity 0.47
E [Pa] Drained Young's modulus 3.E8
ν [–] Drained Poisson's ratio 0.25
Table 4
Embedded fracture model properties.
Parameters Value
Fracture density,λ [–] 30
Threshold strain,ϵ0[–] −1.E−5
Initial water permeability along the fracture, k0[m2] 1.2 × 10⁻¹¹
evaporation, was used to heat the soil sample. Logically, the soil tem-perature increased and reached to the ambient temtem-perature, marking the end of this period. Another remarkable point in the evolution of soil temperature is that the temperature at the surface and the bottom of the sample remained almost identically during the experiment.
3.1.2. Crack development
The formation and the opening of existing cracks were investigated in parallel with the kinetics of evaporation of the soil sample. According toCorte and Higashi (1964), desiccation cracking would occur if the drying shrinkage is constrained, or the suction-induced tensile stress exceeds the soil tensile strength. These conditions may result from such situations as a frictional/displacement boundary condition, concentra-tion of stress, or heterogeneity of soil structure (Peron et al., 2009; Hueckel, 1992). In case of agricultural soil, it is evident that the soil sample has initially some heterogeneity, or even pre-existing cracks. The snapshots in Fig. 6present the soil surface state with the devel-opment of desiccation crack patterns at different periods of evapora-tion. The first cracks were observed at around 8 h, with the corre-sponding averaged water content of 0.38. It seems that thesefirst cracks initiated from the perturbation zone at the soil surface. As evaporation continued, a pattern of cracks was developed at the soil surface, as well as at the interface between the soil sample and the core ring. Crack network almost stopped growing at the soil surface after 20 h, but several cracks of 0.5–2 mm width were identified. The averaged water content corresponding to this moment was about 0.26, still far from the wcr. Interestingly, all the formation of cracks at the sample surface took
place during thefirst period of evaporation (CRP) when the soil surface was still saturated as observed inTang et al. (2018), Cui et al. (2014). Therefore, during the FRP period, the soil surface only experienced a rapid drying. An evolution in color of the soil at the surface could be recognised during this period. As shown inFig. 6, the dried part of soil presented a brighter color than the wet one. One can notice that the soil near the gap between the sample and the ring core and near the crack region dried faster. The remaining question is about the contribution of desiccation cracks to the kinetics of evaporation. In the next section, some of the effects of desiccation cracks on the water transfer
mechanisms, as well as on the evaporation rate were investigated by performing numerical modelling. But still, more refined experimental works should be carried out in the future in order to evaluate quanti-tatively these effects.
3.2. Modelling of the evaporation test
3.2.1. Simulation of intact sample
Fig. 7a, b and c presents the results of thefirst simulation on intact sample via the mass loss and the evaporation rate in function of time and of water content, respectively. In all plots, the numerical results show a good agreement with the experimental ones. The sample mass evolution during time was identical to the experimental mass recorded. Three periods of evaporation were also numerically reproduced ac-cording to the evolution of the evaporation rate over time or along with the water content. Evaporation started with a high rate 0.75 × 10⁻⁶kg s−1, then decreased to 0.625 × 10⁻⁶kg s−1, which corresponded to the end of the CRP period, as the experimental results. During the FRP period, the evaporation rate decreased quickly to a low value of 0.16 × 10⁻⁶kg s−1. The exact evaporation rate during the last period was also captured. On the evolution of soil surface temperature, the numerical curve obtained was almost superposed with the experi-mental one (Fig. 7d). The soil surface temperaturefirst increased from its initial value, T0= 26 °C, to a plateau value which corresponds to the temperature of the CRP period. It is noted that the soil temperature, TCRP, of the period CRP was not constant as reported in theory but varied from 29.5 °C to 31 °C as a result of non-constant evaporation rate during this period. Once the CRP period ended up, the soil temperature increased again and reached to the ambient temperature. In brief, the first results from the simulation of intact sample confirm the ability of the thermo-hydraulic model to reproduce numerically the evaporation test conducted.
3.2.2. Simulation of fractured sample
In this simulation, a pre-existing embedded fracture was included in the soil sample, and presented a saturated water permeability of 1.2 × 10⁻¹¹m2with an order of magnitude greater comparing to the Fig. 6. Snapshots of desiccation crack patterns at different periods of the evaporation process.
rest of the sample, 1.2 × 10⁻¹²m2. The geometry of the fracture pathways and the saturated water permeability map within the sample are illustrated inFig. 8a. Due to the presence of the fracture, apart from the soil surface, direct open pathways would be created for water va-pour in the fracture wall region moving to the atmosphere, then pro-vides a faster water desaturation in fractured zones.Fig. 8b shows the degree of saturation map within the sample at time t = 66 h, i.e., at the
beginning of the third period of evaporation. As the soil surface had experienced a rapid drying during the FRP period, minor values of the degree of saturation (< 0.1) were observed at the top of the sample. A preferential path offlow following the fractured zones was also noted along the soil sample with a lower degree of saturation.
On the water transport mechanisms, the drying process involves mainly the transfer of water in liquid form and its subsequent Fig. 7. Comparison of numerical and experimental results on the kinetics of evaporation.
evaporation within the porous medium to the surface. In the model presented here, it is driven by capillaryflow according to Darcy's law, and by vapourflow following Fick's law. To highlight the impacts of the embedded fracture, the profiles of water and vapour flows through the surface of the sample were plotted for different periods of the eva-poration process as shown inFig. 9a and b. The results showed an in-crease in the water advection flow in the fracture zones during the whole evaporation process. In detail, at t = 11 h in the CRP period, the maximum advection flow in the fracture zone is about 1.9 × 10⁻⁴kg s−1m−2more than 27% compared to the flow in the intact zones, which is 1.5 × 10⁻⁴kg s−1m−2. However, this effect was less important in the FRP period and the third period as a loss of the ability of the water to displace up to the soil surface during these periods. On the other hand, the vapour diffusion which was very low compared to the advectionflow, showed no changes during the CRP. It is clear because the soil surface still remains saturated during this period, hence the evaporation is only achieved by Darceanflow. The vapour diffusion flow plays its role when the FRP period begins and the soil surface starts desaturation. An increase of vapour diffusion was also observed in the fracture zones during the FRP. However, in the third period of evaporation, the situation was contrary. On the kinetics of evaporation, Fig. 10presents the evolution of evaporation rate with time of both intact and fractured samples. The results showed a small increase of around 5% in the evaporation rate during the whole CRP period from the fractured sample. This explains that the impact of de-siccation crack on the kinetics of evaporation is not evident to capture with such small scale laboratory of desiccation tests, under the drying
conditions of the environmental chamber.
Although the numerical modelling of desiccation cracks in soil re-mains very challenging (Hubert, 2019), an attempt was also made to evaluate the tensile stress during the simulation since the cracks de-veloped are mainly tensile cracks.Fig. 11a presents a map of the hor-izontal component of the stress within the soil sample at time t = 8 h. A zone subjected to the tensile stress was observed near the soil surface with a tendency of increasing toward the boundary of the sample where shrinkage was prevented. The evolution with time of the horizontal component of the strain within an element located at the sample surface is shown inFig. 11b. It is noted that the tensile strain was only devel-oped during the early stage of evaporation, then the whole sample was rapidly dominated by shrinkage deformation. During the simulation, the tensile strain imposed both the permeability and the air entry pressure evolving as a function of fracture aperture according to Eqs. (15)and(18), respectively.
4. Conclusions
This paper presents a study on the desiccation cracking of a Cutanic Luvisol at small scale sample. A strategy is also proposed for in-vestigation of the effects of cracks on the evaporation process based on a combination of experimental test and numerical modelling.
The evaporation test was carried out by mean of theHYPROP device, placed in an environmental chamber with monitoring of temperature and relative humidity. The experimental results showed three periods of evaporation following the evolution of the evaporation rate as a function of time or water content. On the kinetics of crack growth, the first crack initiated at early stage of the evaporation due to the het-erogeneity of the soil surface. All the formation of surface cracks took place during the constant rate period (CRP) of evaporation while the soil surface was still wet. No analysis of crack morphology/pattern was provided on account of the sample size and the image resolution. However, the experimental set-up with the number of measurements presented here could be replicated for extended study of desiccation cracking on larger volume of soil.
The numerical modelling of the evaporation test was based on a coupled thermal–hydraulic (T–H) model. The capacity of the model is validated by reproducing the kinetics of evaporation and the evolution of the soil temperature. The presence of a pre-existing embedded fracture is included within the T–H model to product preferential pathways offlow and provide a numerical framework for the thermo-hydro-mechanical coupling. The opening of the fracture is related to the tensile strain induced by desiccation, and conducts to a simultaneous evolution of the permeability and the retention curve through the air entry pressure. However, due to the difficulty of generating the tensile Fig. 9. Water and vapourflow through the soil surface at different periods of evaporation (R indicates the radial distance from the sample axis).
Fig. 10. Comparison of the evaporation rate with time between intact sample and fractured sample.
strain from desiccation shrinkage, only a small increase in water per-meability and decrease in air entry pressure were observed in the fractured zones near the soil surface. In this work, by comparing the numerical results from two cases of simulation on“intact sample” and “fractured sample”, some of the effects of cracks on the kinetics of evaporation were highlighted. An increase in the water advectionflow was observed in the fracture zones during the whole evaporation pro-cess, while the vapour diffusion flow only showed an increase during the FRP but a decrease in the third period of evaporation. The changes in water transport mechanisms result in an increase of the evaporation rate in the whole CRP period of evaporation.
In the line with the strategy outlined in this work, several im-provements could be made to study the problem of desiccation cracking and its impacts on the soil hydraulic behaviour. On the experimental work, characterization and quantification of crack pattern/morphology could be improved by using image analysis and micro/macro X-ray computed tomography (XCT) techniques. While the modelling of the initiation and propagation of cracks is still very challenging in soil mechanics, the embedded fracture model based on the known structure of soil cracking seems to be a simple and useful way for such case-study. The remaining difficulty is how to generate the tensile deformation within the soil sample, which is directly related to the opening of crack aperture. To solve that, appropriate boundary conditions with a me-chanical damage model for the fractured zones could be considered.
Acknowledgements
This work was performed thanks to the post-doctoral funding given by“Fonds Spéciaux pour la Recherche” – University of Liège, Belgium. References
Šimunek, J., Jarvis, N.J., van Genuchten, M., Gärdenäs, A., 2003. Review and comparison of models for describing non-equilibrium and preferentialflow and transport in the Vadose zone. J. Hydrol. 272 (1), 14–35.
Albrecht, B.A., Benson, C.H., 2001. Effect of desiccation on compacted natural clays. J. Geotech. Geoenviron. Eng. 127 (1), 67–75.
Amarasiri, A.L., Kodikara, J.K., Costa, S., 2011. Numerical modelling of desiccation cracking. Int. J. Numer. Anal. Methods Geomech. 35 (1), 82–96.
An, N., Hemmati, S., Cui, Y.J., Tang, C.S., 2018. Numerical investigation of water eva-poration from Fontainebleau sand in an environmental chamber. Eng. Geol. 234, 55–64.
Anagnostou, G., 1995. Seepageflow around tunnels in swelling rock. Int. J. Numer. Anal.
Methods Geomech. 19 (10), 705–724.
Andrew, W., 2003. Take, The influence of seasonal moisture cycles on clay slopes. PhD thesis. University of Cambridge.
Chertkov, V., Ravina, I., 1999. Tortuosity of crack networks in swelling clay soils. Soil Sci. Soc. Am. J. 63, 1523–1530.
Collin, F., Li, X., Radu, J., Charlier, R., 2002. Thermo-hydro-mechanical coupling in clay barriers. Eng. Geol. 64 (2), 179–193 (Key Issues in Waste Isolation Research). Collin, F., 2003. Couplages thermo-hydro-mécaniques dans les sols et les roches tendres
partiellement saturés. PhD thesis. Université de Liège, Liège, Belgique.
Corte, A., Higashi, A., 1964. Experimental research on desiccation cracks in soil. US Army Snow Ice Permafrost Establish. 66 (12), 83.
Coumans, W., 2000. Models for drying kinetics based on drying curves of slabs. Chem. Eng. Process.: Process Intensif. 39 (1), 53–68.
Cui, Y.J., Tang, C.S., Tang, A.M., Ta, A.N., 2014. Investigation of soil desiccation cracking using an environmental chamber. Riv. Ital. Geotec. 48, 9–20.
Dekker, L., Bouma, J., 1984. Nitrogen leaching during sprinkler irrigation of a Dutch clay soil. Agric. Water manage. 9 (1), 37–45.
European Commission, 2013. Report from the Commission to the Council and the European Parliament on the Implementation of Council Directive 91/676/EEC Concerning the Protection of Waters Against Pollution Caused by Nitrates from Agricultural Sources based on Member State Reports for the Period 2008–2011, Tech. Rep. European Commission.
Foster, M., Fell, R., Spannagle, M., 2000. A method for assessing the relative likelihood of failure of embankment dams by piping. Can. Geotech. J. 37 (5), 1025–1061. Gens, A., Olivella, S., 2001. Thm phenomena in saturated and unsaturated porous media.
Revue Française de Génie Civil 5 (6), 693–717.
Genuchten, M.T.V., 1980. A closed-form equation for predicting the hydraulic con-ductivity of unsaturated soils. Soil Sci. Soc. Am. J. 44 (5), 892–898.
Gerard, P., Léonard, A., Masekanya, J.P., Charlier, R., Collin, F., 2010. Study of the soi-l–atmosphere moisture exchanges through convective drying tests in non-isothermal conditions. Int. J. Numer. Anal. Methods Geomech. 34 (12), 1297–1320. Gerard, P., Harrington, J., Charlier, R., Collin, F., 2014. Modelling of localised gas
pre-ferential pathways in claystone. Int. J. Rock Mech. Min. Sci. 67, 104–114. Hubert, J., Plougonven, E., Prime, N., Léonard, A., Collin, F., 2017. Comprehensive study
of the drying behavior of boom clay: experimental investigation and numerical modeling. Int. J. Numer. Anal. Methods Geomech. 42 (2), 211–230.
Hubert, J., 2019. Experimental and numerical study of cracking during the desiccation of porous materials: application to thefields of chemical engineering and geomechanics. PhD thesis. University of Liège.
Hueckel, T.A., 1992. Water-mineral interaction in hygromechanics of clays exposed to environmental loads: a mixture-theory approach. Can. Geotech. J. 29 (6), 1071–1086.
Idso, S.B., Reginato, R.J., Jackson, R.D., Kimball, B.A., Nakayama, F.S., 1974. The three stages of drying of afield soil. Soil Sci. Soc. Am. J. 38 (5), 831–837.
Keey, R.B., Suzuki, M., 1974. On the characteristic drying curve. Int. J. Heat Mass Transfer 17 (12), 1455–1464.
Konrad, J.M., Ayad, R., 1997. A idealized framework for the analysis of cohesive soils undergoing desiccation. Can. Geotech. J. 34 (4), 477–488.
Kowalski, S.J., Strumillo, C., 1997. Moisture transport, thermodynamics, and boundary conditions in porous materials in presence of mechanical stresses. Chem. Eng. Sci. 52 (7), 1141–1150.
Kurtzman, D., Baram, S., Dahan, O., 2015. Soil-aquifer phenomena affecting groundwater under vertisols: a review. Hydrol. Earth Syst. Sci. Discuss. 12 (09), 9571–9598. Fig. 11. Map of the horizontal component of the stress at time t = 8 h (a), and evolution with time of the horizontal component of the strain within an element (marked in red) of the fractured zones, located at the top of the sample (positive values correspond to tensile states). (For interpretation of the references to color in thisfigure legend, the reader is referred to the web version of this article.)
Léonard, A., Blacher, S., Marchot, P., Pirard, J.-P., Crine, M., 2005. Convective drying of wastewater sludges: influence of air temperature, superficial velocity, and humidity on the kinetics. Drying Technol. 23 (8), 1667–1679.
Lachenbruch, A.H., 1961. Depth and spacing of tension cracks. J. Geophys. Res. 66 (12), 4273–4292.
Lakshmikantha, M.R., Prat, P., Ledesma, A., 2009. Image analysis for the quantification of a developing crack network on a drying soil. Geotech. Test. J. 32 (11), 505–515. Lakshmikantha, M.R., Prat, P., Ledesma, A., 2018. Boundary effects in the desiccation of
soil layers with controlled environmental conditions. Geotech. Test. J. 41, 675–697. Li, J., Lu, Z., Guo, L., Zhang, L., 2017. Experimental study on soil–water characteristic
curve for silty clay with desiccation cracks. Eng. Geol. 218, 70–76.
Liu, C., Tang, C.S., Shi, B., Suo, W.B., 2013. Automatic quantification of crack patterns by image processing. Comput. Geosci. 57, 77–80.
Lozada, C., Caicedo, B., Thorel, L., 2018. A new climatic chamber for studying soi-l–atmosphere interaction in physical models. Int. J. Phys. Modell. Geotech. 1–31. Mitchell, J.K., Soga, K., 2005. Fundamentals of Soil Behavior, 3rd ed. John Wiley & Sons,
Hoboken, NJ.
Morris, P.H., Graham, J., Williams, D., 1992. Cracking in drying soils. Can. Geotech. J. 29 (04), 263–277.
Mualem, Y., 1976. A new model for predicting the hydraulic conductivity of unsaturated porous media. Water Resour. Res. 12 (3), 513–522.
Nasrallah, S., Perre, P., 1988. Detailed study of a model of heat and mass transfer during convective drying of porous media. Int. J. Heat Mass Transfer 31 (5), 957–967. Nguyen, O., Repetto, E., Ortiz, M., Radovitzky, R., 2001. A cohesive model of fatigue
crack growth. Int. J. Fract. 110, 351–369.
Novák, V.,Šimåunek, J., Genuchten, M.T.V., 2000. Infiltration of water into soil with cracks. J. Irrig. Drain. Eng. 126 (1), 41–47.
Olivella, S., Alonso, E.E., 2008. Gasflow through clay barriers. Géotechnique 58, 157–176.
Peron, H., Hueckel, T., Laloui, L., Hu, L.B., 2009a. Fundamentals of desiccation cracking offine-grained soils: experimental characterisation and mechanisms identification. Can. Geotech. J. 46 (10), 1177–1201.
Peron, H., Delenne, J., Laloui, L., Youssoufi, M.E., 2009b. Discrete element modelling of drying shrinkage and cracking of soils. Comput. Geotech. 36 (1), 61–69. Peters, A., Durner, W., 2008. Simplified evaporation method for determining soil
hy-draulic properties. J. Hydrol. 356 (1), 147–162.
Prime, N., Housni, Z., Fraikin, L., Léonard, A., Charlier, R., Levasseur, S., 2015. On water transfer and hydraulic connection layer during the convective drying of rigid porous
material. Transport in Porous Media 106, 47–72.
Rodríguez, R., Sánchez, M., Ledesma, A., Lloret, A., 2007. Experimental and numerical analysis of desiccation of a mining waste. Can. Geotech. J. 44 (6), 644–658. Sánchez, M., Manzoli, O.L., Guimarães, L.J., 2014. Modeling 3-d desiccation soil crack
networks using a mesh fragmentation technique. Comput. Geotech. 62, 27–39. Sanchez, M., Atique, A., Kim, S., Romero, E., Zielinski, M., 2013. Exploring desiccation
cracks in soils using a 2d profile laser device. Acta Geotech. 8, 583–596. Scott, G.J.T., Webster, R., Nortcliff, S., 1986. An analysis of crack pattern in clay soil: its
density and orientation. J. Soil Sci. 37 (4), 653–668.
Selim, H., Kirkham, D., 1970. Soil temperature and water content changes during drying as influenced by cracks: a laboratory experiment 1. Soil Sci. Soc. Am. J. 34 (4), 565–569.
Silvestri, V., 2000. Performance of shallow foundations on clay deposits in Montréal is-land. Can. Geotech. J. 37 (1), 218–237.
Song, W.K., Cui, Y.J., Tang, A.M., Ding, W.Q., Wang, Q., 2016. Experimental study on water evaporation from compacted clay using environmental chamber. Can. Geotech. J. 53 (8), 1293–1304.
Tang, C.S., Cui, Y.J., Shi, B., Tang, A.M., Liu, C., 2011. Desiccation and cracking beha-viour of clay layer from slurry state under wetting–drying cycles. Geoderma 166 (1), 111–118.
Tang, C.S., Wang, D.Y., Shi, B., Li, J., 2016. Effect of wetting–drying cycles on profile mechanical behavior of soils with different initial conditions. Catena 139, 105–116. Tang, C.S., Wang, D.Y., Zhu, C., Zhou, Q.Y., Xu, S.K., Shi, B., 2018. Characterizing drying-induced clayey soil desiccation cracking process using electrical resistivity method. Appl. Clay Sci. 152, 101–112.
Velde, B., 1999. Structure of surface cracks in soil and muds. Geoderma 93 (1), 101–124. Vervoort, R.W., Radcliffe, D.E., West, L.T., 1999. Soil structure development and
pre-ferential soluteflow. Water Resour. Res. 35 (4), 913–928.
Vo, T.D., Pouya, A., Hemmati, S., Tang, A.M., 2017. Numerical modelling of desiccation cracking of clayey soil using a cohesive fracture method. Comput. Geotech. 85, 15–27.
Vogel, H.J., Hoffmann, H., Roth, K., 2005. Studies of crack dynamics in clay soil: I. ex-perimental methods, results, and morphological quantification. Geoderma 125 (3), 203–211.
Weinberger, R., 1999. Initiation and growth of cracks during desiccation of stratified muddy sediments. J. Struct. Geol. 21 (4), 379–386.
WRB, I.W.G., 2006. World Reference Base for Soil Resources 2006– A Framework for International Classification, Correlation and Communication.