NATURAL VARIABILITY OF PELAGIC AND BENTHIC
CONDITIONS
IN
THE GULF OF ST. LAWRENCE DURING THE
LA
TE
HOLOCENE
THESIS PRESENTED
AS PARTlAL REQUIREMENT FOR
MSc. IN ENVIRONMENTAL SCIENCES
BY
NOUHA DHAHRI
Avertissement
La diffusion de ce mémoire se fait dans le respect des droits de son auteur, qui a signé le formulaire Autorisation de reproduire et de diffuser un travail de recherche de cycles
supérieurs (SDU-522 - Rév.û1-2ûû6). Cette autorisation stipule que «conformément à
l'article 11 du Règlement no 8 des études de cycles supérieurs, [l'auteur] concède à l'Université du Québec à Montréal une licence non exclusive d'utilisation et de publication de la totalité ou d'une partie importante de [son] travail de recherche pour des fins pédagogiques et non commerciales. Plus précisément, [l'auteur] autorise l'Université du Québec à Montréal à reproduire, diffuser, prêter, distribuer ou vendre des copies de [son] travail de recherche à des fins non commerciales sur quelque support que ce soit, y compris l'Internet. Cette licence et cette autorisation n'entraînent pas une renonciation de [la] part [de l'auteur]
à
[ses] droits moraux nià
[ses] droits de propriété intellectuelle. Sauf entente contraire, [l'auteur] conserve la liberté de diffuser et de commercialiser ou non ce travail dont [il] possède un exemplaire.»VARIABILITÉ NATURELLE DES CONDITIONS PÉLAGIQUES ET
BENTHIQUES DANS LE GOLFE DU SAINT-LAURENT
À
L 'HOLOCÈNE SUPÉRIEUR
MÉMOIRE PRÉSENTÉ
COMIVIE EXIGENCE PARIELLE
DE LA MAÎTRISE EN SCIENCES DE L'ENVIRONNENIENT
PAR
NOUHA DHAHRI
AVANT-PROPOS v
LISTE DES FIGURES viii
LISTE DES TABLEAUX x
RÉSITMÉ ix
INTRODUCTION GÉNÉRALE 1
CHAPITRE 1: NATURAL VARIABILITY OF PELAGIC AND BENTHIC CONDITIONS IN THE GULF OF ST. LAWREWNCE DURING THE LATE
HOLOCENE 2
Abstract 6
1.1. Introduction 7
1.2. Study area 9
1.2.1. Topography and bathymetry 9
1.2.2. Water circulation and hydrographical characteristics Il
1.3. Material and Methods Il
1.3.1. Sampling Il 1.3.2. Chronology Il 1.3.3. Geochemical analyses 12 1.3.4. Micropaleontological analyses 14 1.4 Results 15 1.4.1 Chronology 15
1.4.2. Geochemistry of organic matter in sediments 16
1.4.4. Reconstructions of sea-surface conditions and pelagie productivity 18
1.4.5. Benthic foraminiferal assemblages 19
1.4.6. Isotopie composition of benthic foraminiferal shells 21
1.5. Discussion 23
1.5.1. Pelagie productivity and organic carbon flux 23
1.5.2. Bottom water conditions 25
1.6. Conclusion 26
1.7. References 28
ANNEXE A: Résultats des analyses géochimiques et isotopiques dans la carotte
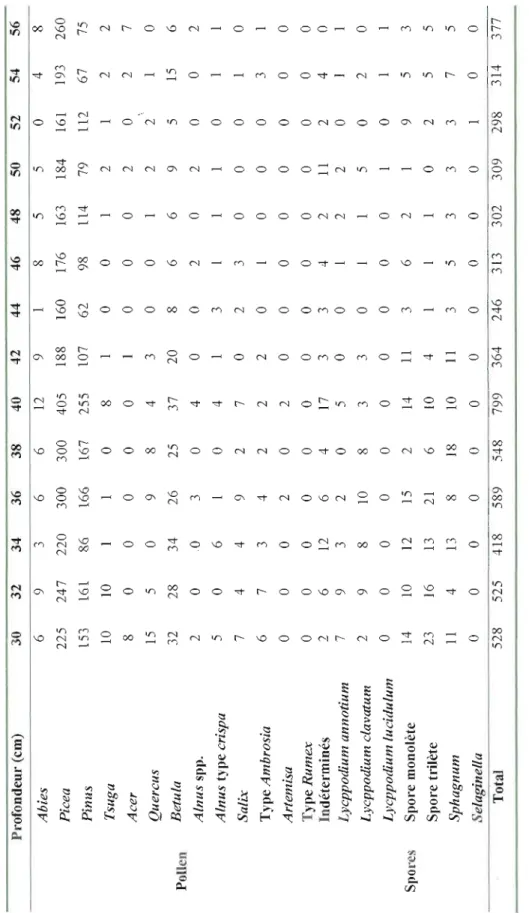
ANNEXE B: Dénombrement et concentrations des palynomorphes marins et
ANNEXE C: Planches photographiques des foraminifères benthiques calcaires dans la carotte CORüSü3-CLüS-37PC prises par microscope électronique à
CONCLUSION GÉNÉRALE 47
BIBLIOGRAPHIE GÉNÉRALE 49
CORü5ü3-CLü5-37PC 56
terrestres dans la carotte CORÜ5Ü3-CLü5-37PC 62
Ce mémoire de maîtrise est présenté sous la forme d'un article scientifique qui sera soumis à la revue Marine Micropaleontology. Pour répondre aux exigences de cette revue, le texte a été écrit dans la langue anglaise et sa mise en forme diffère de celle recommandée par l'Université du Québec à Montréal. Les tableaux et les figures sont placés à la suite des références, alors que les annexes sont présentées à la fin du mémoire. Ma directrice de recherche Mme Anne de Vernal, chercheure et professeure au département des Sciences de la Terre et de l'Atmosphère de l'UQÀM, a participé à la rédaction de cet article.
Je tiens à exprimer mes remerciements à toutes les personnes qUI ont participé, à titre professionnel ou personnel, de près ou de loin, à la réalisation de ce
projet de maîtrise.
Mes plus vifs remerciements vont à ma directrice de maîtrise, Mme Anne de Vernal, qui m'a chaleureusement accueillie dans son équipe de recherche et m'a offert plusieurs opportunités pour mieux connaître le milieu de recherche scientifique au Canada. Je lui suis très reconnaissante pour son bon encadrement, son attention et surtout sa serviabilité malgré les nombreuses tâches qui l'assaillent. Elle m'a constamment aidée avec ses précieux conseils en me faisant profiter de son expérience et de son savoir.
Je dois également remercier Taoufik Radi, pour son aide et ces conseils surtout dans le traitement des données, Maryse Henry, qui m'a initiée au travail dans le laboratoire de micropaléontologie et qui m'a beaucoup aidée dans l'identification des dinokystes, et Julie Leduc pour son aide et ses conseils dans l'identification des foraminifères. J'aimerai remercier également Jean-François Hél ie et Agnieszka Adamowicz pour leur contribution aux analyses géochimiques et isotopiques. Merci à Bassam Ghaleb pour ses conseils et son aide avec la chronologie. Merci à tout le personnel du GEOTOP qui m'a accordé support et assistance. Merci aussi à Sophie, Benoit et Linda qui n'ont pas hésité à partager leurs connaissances avec moi. Je remercie aussi mes amies et compagnons de bureau Sarah, Caro et Nat avec qui j'ai partagé d'agréables moments.
Je tiens à remercier Mr Pierre Drapeau, professeur au département des sciences biologi.ques de l'UQAM, qui m'a offert la chance d'étudier à l'UQAM. Merci à Mme Sylvie De Grosbois, coordonatrice à l'institut des sciences de l'environnement, et
Mr
Daniel Gagnon, professeur au département des sciences biologiques de l'UQAM, pour leur support et leurs conseils.Je remercie mes parents, papa Magtouf et maman Sam ira, et mes sœurs Rima, Hiba et Aya qui m'ont accordé soutien et confiance durant toute la durée de mes. études et qui ont partagé les joies et satisfactions mais aussi les moments difficiles et de découragement. Sans leur soutien, ce travail n'aurait pas vu le jour.
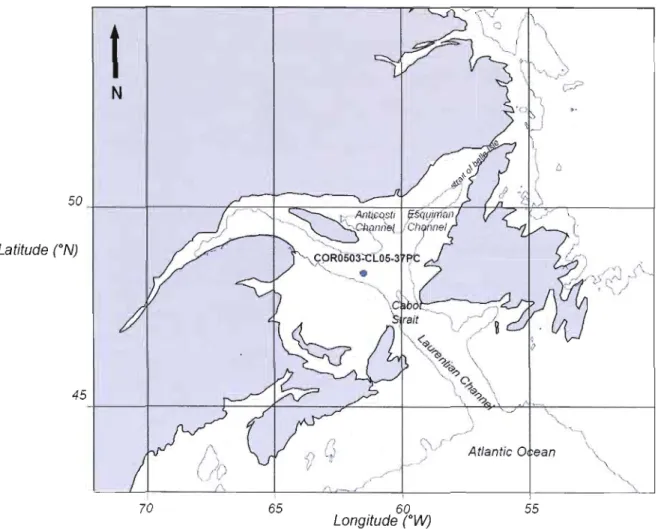
Figure 1: Map of the Gulf of St. Lawrence and location of the coring site; COR503 37PC in the Laurentian Channel. The core location is 48°20.0 l'N, 61°29.99'W, at 408 m water depth. The bathymetric contour represents the 200 m
isobath '" 38
Figure 2: Chronology of COR503-37PC a) Age vs. depth relationship. The five
circles represent calibrated 14C dates from Barletta et al. (2010). The diamond corresponds to 14C date from this study (see Table 1). The dotted grey line represents the interpolation function used by Barletta et al. (2010) to the set the chronology of the core. The dark line represents the linear regression used to calculate sedimentation rates across 14C dates in the upper 400 cm. b) Age vs. depth relationship of the study section of the core. The dark line represents the linear regression used to calculate sedimentation rate across 14C dates at 45 and 375 cm, assuming a 0 cal. years BP age
at the top of the core 39
Figure 3: Geochemical and stable isotope results as function of depth (cm) in core
COR503-37PC: Corg (organic carbon content), CorglN ratio, ()'3Corg and Ol~. The bold curves correspond to 5-points running means. The shaded interval from 90 to 100 cm corresponds to the transition between Unit 1 and Unit 11.. .40
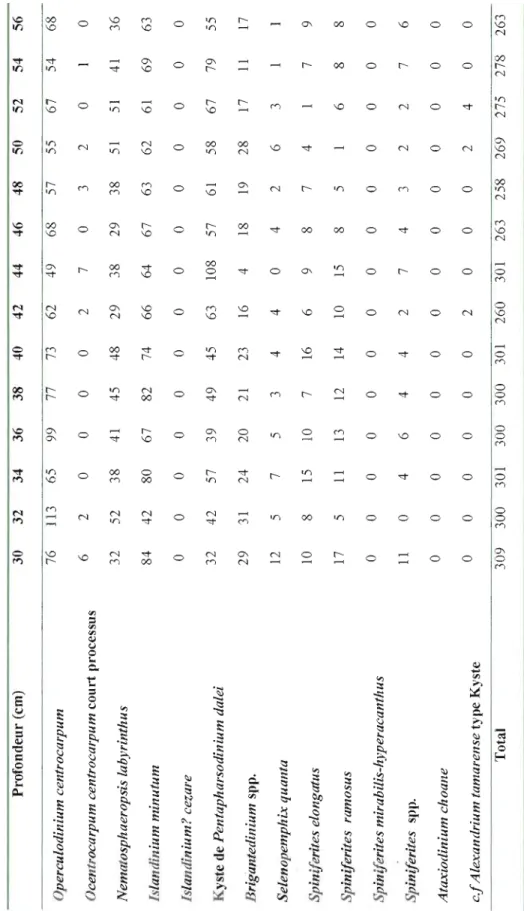
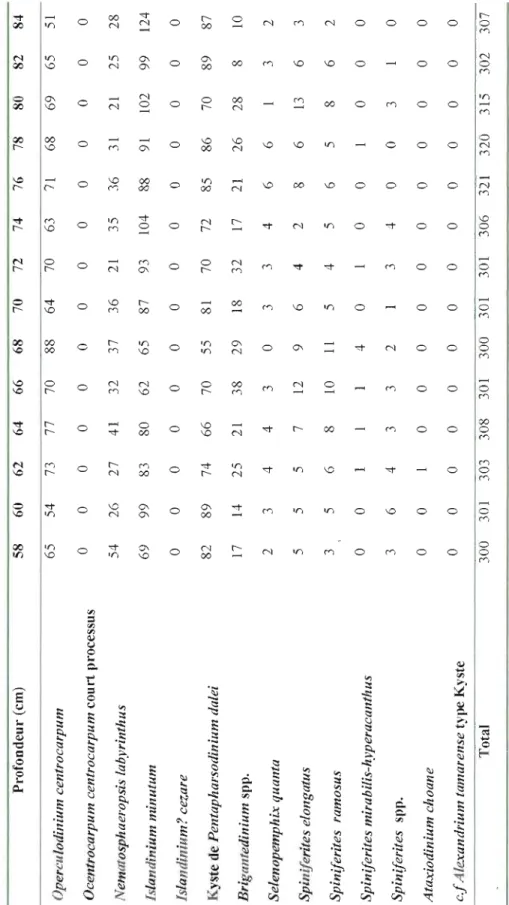
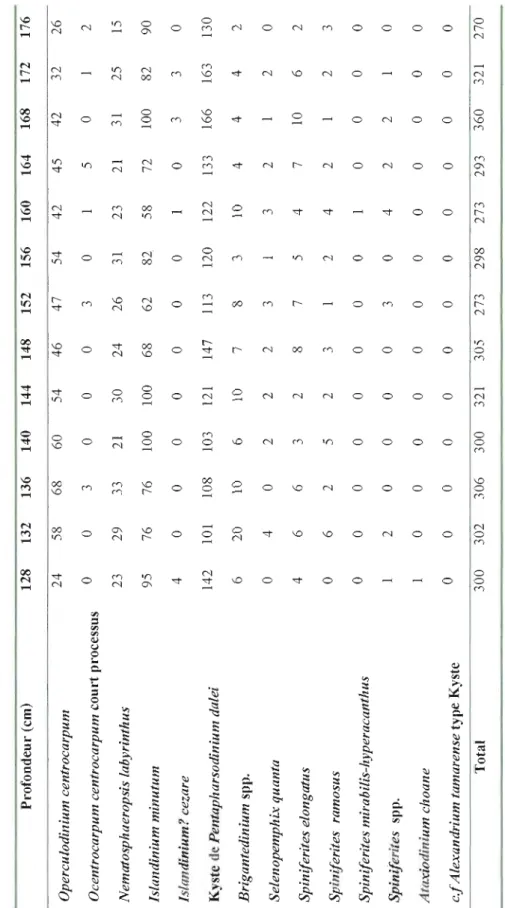
Figure 4: Dinocyst concentration (cysts g-l) and the relative abundance of the main
taxa as function of depth (cm) in core COR503-37PC. For information, the transition zone defined from the geochemical data (cf. Figure 3) is reported here .41
Figure 5: Reconstruction of sea-surface conditions (temperature, salinity and sea-ice
cover) and annual primary production for the last 4000 years using dinocyst data from the core COR503-37PC. The reconstruction was based on the best analogue method (cf. Guiot and de Vernal, 2007) using the n= 1429 dinocyst reference data base and the reference produetivity database MODIS (Behrenfeld and Falkowski, 1997). The bold curves correspond to 3-points running means. The transition zone defined from the geochemical data (cf. Figure 3) is reported here 42
Figure 6: Summary diagram of benthic foraminifer assemblages in core COR503
37PC: concentration (tests go!) and relative abundance of taxa as function of depth (cm). The assemblages 1, 2 and 3 are defined from the occurrence of key species Nonionellina labradorica, Brizalina subaenariensis and Globobulimina
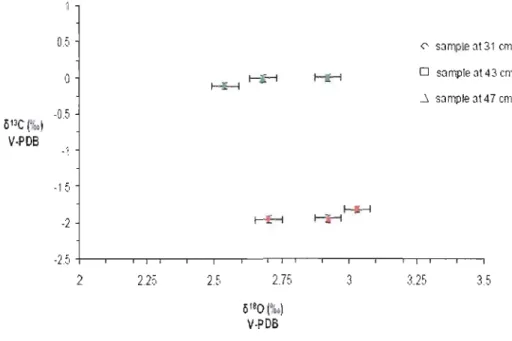
Figure 7: ol3C and 0180 of Bulimina marginata (green) and Bulimina exilis (red) picked in samp1es from COR503-37 PC (at 31, 43 and 47 cm). Analyses were performed in order to verify if we can develop a multispecies record (see Table A.3.
in the supplementary data) 44
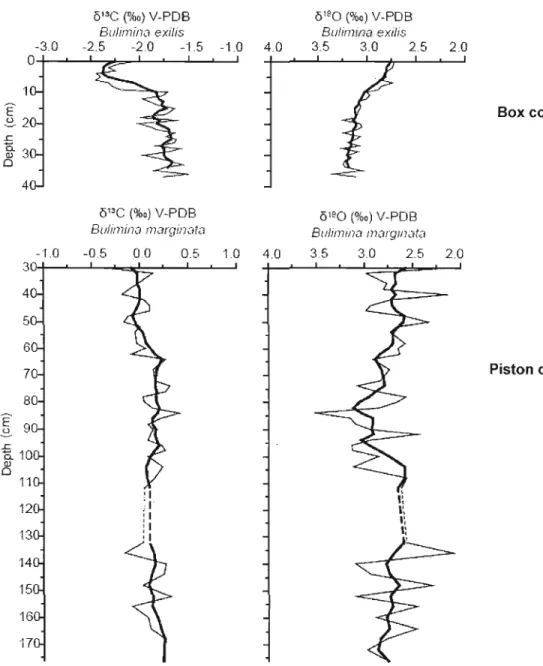
Figure 8: Ol3C and 0180 record of benthic foraminifera Bulimina exifis in box core
COR503-37BC (Genovesi, 2009) and Bulimina marginata in piston core COR503
37PC (this study) as function of depth (cm). The bold curves correspond to 5-points
running mean values. Note the different ol3C scale for Bulimina exilis and Bulimina
marginata. The 2 %0 difference corresponds to the discrepancy calculated [rom
measurements in the same sampIes (cf. Figure 7) .45
Figure 9: Summarized curves of the main proxies used to reconstruct benthic and
pelagic environment in the St. Lawrence Gulf during the last 4000 years (data from
COR503-37PC): a) 0180 record of Bulimina marginata; b) Corg: Organic carbon
content in the sediment; c) relative abundance of Brizalina subaenariensis d) ol3Corg
in the sediment; e) reconstruction of annual primary production from MODIS. The shaded interval, between 90 and 100 cm, corresponds to the transition zone defined from the geochemical data. The interval highlighted in blue (85-105 cm) corresponds
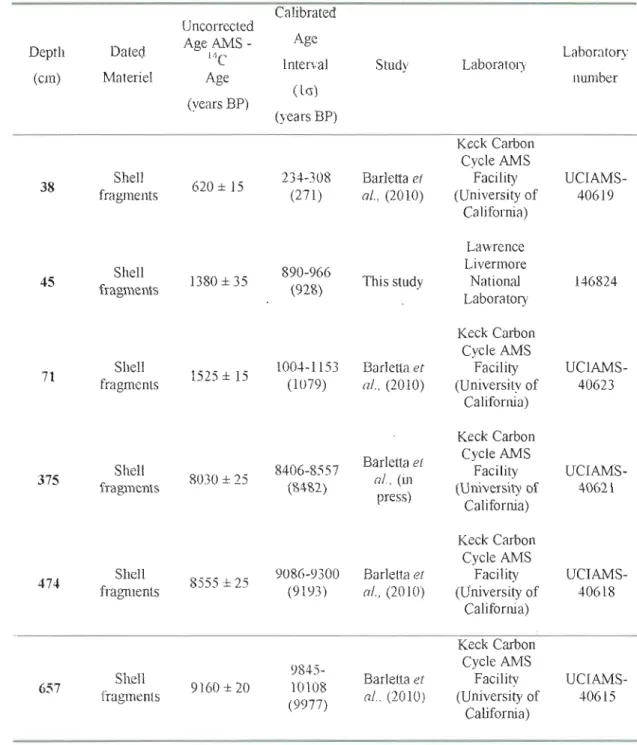
Table 1: Radiocarbon dates in core COR5ü3-37PC .35
Table 2: List of dinocysttaxa recorded in core COR5ü3-37PC .36
La séquence sédimentaire de la carotte COROS03-CLOS-37PC, prélevée dans le chenal Laurentien au centre du Golfe du Saint-Laurent (48°20'N - 6]029'W, à 408 m de profondeur), a fait l'objet de plusieurs analyses géochimiques et micropaléontologiques dans le but de reconstruire les variations de la productivité pélagique et des conditions du milieu benthique dans le golfe du Saint-Laurent pendant les derniers millénaires. Les analyses géochimiques (Corg et CorglN) et isotopiques (ô13Corg et ô'5N) montrent des variations importantes de flux de matière
organique, notamment une augmentation du taux de carbone organique, depuis environ 2300 ans cal. BP, que l'on estime être liée à l'augmentation de l'apport en matière organique d'origine marine. Les kystes des dinoflagellés permettent également de reconstruire une augmentation de la productivité biogénique dans les eaux de surface. Par ailleurs, plusieurs changements ont été enregistrés dans les assemblages de foraminifères benthiques calcaires. Ces changements se manifestent essentiellement par l'augmentation de l'abondance relative, vers 2000 ans cal. BP, de Brizalina subaenariensis, Globobulimina auriculata et Bulimina exilis, des espèces tolérant de faibles taux d'oxygène et des flux de carbone organique élevés. La variation de l'abondance de Nonionellina labradorica indique des changements dans l'apport des eaux du Courant du Labrador. En outre, les analyses isotopiques (8 180) sur les tests de foraminifères benthiques Bulimina marginata, montrent des variations de la température et/ou de l'origine des eaux profondes qui sont indépendantes de la variation de la productivité pélagique et de l'augmentation de l'apport en matière organique.
Mots clés:
Golfe du Saint-Laurent; hypoxie; dinokystes, productivité, foraminifères benthiques, géochimie, isotopes stables, Holocène.
L'état de l'hypoxie, lorsque la concentration en oxygène dissous dans l'eau
chute au-dessous d'un seuil létal de 2 mg L-1 (ou 62,5 /lmol L-1), est un problème
alarmant dans plusieurs milieux côtiers, estuariens (Diaz et Rosenberg, 1995; 2008)
et océaniques profonds (Keeling et Garcia, 2002; Gilbert et al., 2010). Le nombre de
régions affectées par ce problème ne cesse d'augmenter (Verity et al., 2006).
L'hypoxie a des conséquences graves sur la vie et 1'équilibre des écosystèmes
aquatiques (Diaz et Rosenberg, 1995; Wu, 2002). Elle peut affecter et menacer le
métabolisme et la survie des animaux aquatiques, compromettre la capacité natatoire, influer sur la digestion, la croissance et la reproduction. Plusieurs espèces sont affectées par ce phénomène incluant des poissons d'intérêt commercial telle la morue
(Chabot et Dutil, 1999; Wu, 2002) En outre, dans des conditions d'hypoxie sévère
(moins de 30% de saturation en oxygène dissous), il peut se produire une mortalité massive de cel1aines espèces de poisson, la migration d'autres espèces ainsi que des changements de communautés favorisant l'installation des espèces les plus tolérantes
(Diaz et Rosenberg, 1995; Wu, 2002). L'hypoxie influence donc indirectement
l'abondance et la distribution de plusieurs animaux aquatiques notamment celles des espèces de grande taille, tels les tortues marines et des mammifères manns, en
modifiant la disponibilité de leurs proies (Craig et al., 2001)
Des études réalisées dans l'estuaire maritime du Saint-Laurent (EMSL) ainsi que dans le golfe du Saint-Laurent (GSL) mettent en évidence des changements récents de la composition physico-chimique des eaux profondes depuis le début du
dernier siècle (Budgen, 1991; Gilbert et al., 2005, 2007). Ces changements se
manifestent par une baisse des teneurs en oxygène dissous et par l'augmentation de la
température des eaux profondes le long du Chenal Laurentien (Gilbert et al., 2005) Il
qu'il y a eu un réchauffement des masses d'eau de 1,7°C depuis 1930 ainsi qu'une diminution des teneurs en oxygène dissous de près de 50 %, soit de 125 flmol L-1 dans les années 1930 à 65 flmol L-1 à la fin du 20éme siècle (Gilbert et al., 2005, 2007). En outre, les analyses de quelques séquences sédimentaires prélevées de l'EMSL suggèrent que la diminution des concentrations en oxygène dissous a commencé à se manifester de façon sévère dans les années 1960 (Thibodeau et al., 2006). De même, dans le GSL, les observations et les données sédimentaires montrent une diminution récente de la concentration d'oxygène dissous ainsi qu'une augmentation de près de 1,9°C de la température des eaux profondes (Gilbert al., 2005; Genovesi, 2009).
L'origine de l'hypoxie dans l'EMSL et le GSL peut avoir plusieurs causes. Dans le cas de l'EMSL, Thibodeau et al. (2006) expliquent la diminution du niveau d'oxygène dissous par l'augmentation des flux de carbone liés à l'eutrophisation anthropogénique. Les activités humaines autour du système Saint-Laurent seraient responsables de l'accroissement des décharges de nutriments issus de l'érosion et du lessivage des sols agricoles riches en fertilisants ainsi qu'aux décharges de matière organique terrigène provenant de l'industrie du papier (Thibodeau et al., 2006) Ces décharges augmentent le flux de carbone et la productivité biologique dans l'eau et ont pour résultat la consommation accrue d'oxygène dissous lors de la dégradation de la matière organique dans les eaux profondes (Gilbert et al., 2007; Thibodeau et al., 2006). Par ailleurs, Gilbert el al. (2005) ont montré que la diminution du niveau d'oxygène dissous ne résulte pas uniquement de l'augmentation des flux de carbone mais qu'elle a aussi un lien avec l'augmentation de la température des eaux. Le réchauffement de l'eau a été attribué au changement des proportions relatives des eaux froides du courant du Labrador et des eaux chaudes du courant Nord Atlantique. Dans la partie centrale du GSL, Genovesi (2009) n'a pas noté d'indice probant de l'augmentation dela productivité primaire, mais ses résultats mettent en évidence un réchauffement des eaux profondes au cours des dernières décennies. Cela laisse supposer que la diminution des niveaux d'oxygène dans le GSL n'y serait pas due à
l'eutrophisation malS plutôt au changement des propriétés physiques des eaux profondes.
L'élévation de la température des eaux profondes de l'EMSL et du GSL semble être une caractéristique régionale (Thibodeau et al., 2010) Elle pourrait résulter de proportions de mélange variables des eaux nord atlantiques et du Labrador à l'entrée du Chenal Laurentien (cf Gilbert et al., 200S) et être une réponse à une variabilité naturelle des conditions de circulation océanique. Il pourrait également s'agir d'une manifestation du réchauffement climatique lié aux activités anthropiques. Il est ainsi nécessaire d'étudier des séquences temporelles couvrant les derniers millénaires pour déterminer les influences respectives de la composante naturelle et du forçage anthropique. C'est dans ce contexte que nous pouvons inscrire cette étude.
Pour répondre à la question sur l'influence de la variabilité naturelle et de
l'effet anthropique sur les conditions environnementales dans le GSL, nous avons essayé de reconstruire les conditions hydrographiques et la productivité des eaux profondes. Nous avons analysé le contenu d'une carotte sédimentaire COROS03 CLOS-37PC prélevée dans le chenal Laurentien, au centre du golfe au même site que la carotte boîte COROS03-CLOS-37BC (Genovesi, 2009), qui couvre environ deux
siècles de sédimentations.
À
l'instar de ce qui a été fait par Genovesi (2009), nousavons utilisé une approche basée sur plusieurs traceurs pour reconstruire ies
conditions environnementales des derniers millénaires. Les traceurs
micropaléontologiques et géochimiques ont permis d'évaluer les changements de la productivité primaire et des conditions dans les eaux profondes. Pour retracer la productivité primaire pélagique et les conditions de surface (température, salinité, couvert de glace), nous nous sommes basés sur les assemblages de dinokystes (e.g., de Vernal et al., 1993, 1997,2005; Radi et de Vernal, 2007, 2008). Les foraminifères benthiques ont été utilisés comme traceurs des conditions des eaux profondes (Murray, 2001; Jorissen et al., 2007). Les assemblages et l'abondance des foraminifères benthiques sont utilisés comme indicateurs de la productivité benthique, des flux de carbone organique et de concentration en oxygène dissous
(e.g., den Dulk et al., 2000; Osterman, 2003; Osterman et al., 2009). Par ailleurs, la
18
0
composition isotopique (0 and ol3C) des tests de foraminifères benthiques est
utilisée pour retracer les caractéristiques des eaux dans lesquelles leurs tests carbonatés se sont précipités. La composition isotopique fournit en effet des informations sur les conditions de température et de salinité des eaux (e.g.,
Waelbroeck et al., 2002; Ravelo et Hillaire-Marcel, 2007). Pour déterminer l'origine
de la matière organique piégée dans les sédiments, nous avons par ailleurs effectué
diverses analyses géochimiques (teneur en carbone organique et le rapport
CorglN)
etisotopiques (O l3C et 015N ) (e.g., Meyers, 1994, 1997; Muzuka et Hillaire-Marcel,
NATURAL VARIABILITY OF PELAGIC AND BENTIDC
CONDITIONS IN THE GULF OF ST. LAWRENCE DURING THE
LATE HOLOCENE
Nouha Dhahri l,*, Anne de Vernal 1
GEOTOP: Centre de recherche en Géochimie Isotopique et en Géochronologie, Université du Québec à Montréal, c.P. 8888, Suce. Centre-Ville, Montréal, Québec, Canada, H3C 3P8. Tel: + 1-514-987-4080; Fax: +1-514-987-3635
*Corresponding author: E-mail: [email protected]
Abstract
A sedimentary section from core COROS03-CLOS-37PC, collected in the Laurentian Channel in the central part of the GulfofSt. Lawrence (48°20'N - 61°29'W, at 408 water depth), was analyzed for its geochemical and micropaleontological content in order to reconstruct variations in pelagie productivity and bottom water conditions in
the Gulf of St. Lawrence during the last millennia. Geochemical (Corgand COI·glN) and
isotopie results (8 13Corg and 815N) reveal important variations of organic matter flux
and an increase of organic carbon content since 2300 cal. years BP, which could be related to the increase of marine organic matter input. Similarly, the dinocyst assemblages suggest also a significant increase of biogenic productivity since about 2300 cal. years BP in the upper water mass. Moreover, changes are recorded in benthic foraminiferal assemblages. An increase, since 2000 cal. years BP, of the abundances of Brizalina subaenariensis, Globobulimina auriculata and Bulimina exilis in the upper part of the studied sector reveals a trend toward a low oxygen level and high organic input. The variation of the relative abundance of Nonionellina labradorica also suggests concomitant decrease in the contribution of Labrador Current Water. The isotopie analyses performed on Bulimina marginata shells also suggest variations of bottom water temperatures. The results show that important changes of environmental conditions occurred at a millennial scale as part of natural variation in a complex ecosystem.
Key Words: Gulf of St. Lawrence; hypoxia; dinocyst, productivity, benthic foraminifera; geochemistry, stable isotopes, Holocene.
1.1. Introduction
Hypoxia, defined as the dissolved oxygen concentration below 62.5 )1mol L-1,
is an alarming problem that occurs in many coastal and estuarine environments (Diaz and Rosenberg, 1995; 2008) It is suggested that the recent decrease of dissolved oxygen concentrations also occurs in the deep ocean (Keeling and Garcia, 2002; Gilbert el al., 2010). The number of hypoxic zones has been increasing around the world (Verity el al., 2006). Hypoxia has many impacts on aquatic organisms and causes severe ecosystem disturbance (Diaz and Rosenberg, 1995, Wu, 2002). It affects the growth, reproduction and digestion of many organisms (Wu, 2002) inc1uding species of commercial fisheries importance such as Atlantic cod (Chabot and Dutil, 1999). Moreover, hypoxia has an effect on the distribution and abundance of large aquatic animais such as sea turtles· and marine mammals by changing the availability oftheir prey (Craig et al., 2001).
Since the beginning of the last century, changes in the physical and chemical composition of the bottom waters have been recorded in the Lower St. Lawrence Estuary (LSLE) and the Gulf of St. Lawrence (GSL) (Budgen, 1991; Gilbert et al., 2005, 2007). It was observed that about 1300 km2 of Laurentian Channel (LC) are bathed by hypoxic and warmer bottom waters (Gilbert et al., 2005). Direct measurements of the bottom waters of the LSLE have shown a significant warming of about 1. 7°C since the 1930s and a remarkable decrease of dissolved oxygen concentration from 125 Ilmol L-1 in the 1930s to 65 Ilmol L-I at the end of the 20lh century (Gilbert el al., 2005, 2007). Analyses of sedimentary sequences from the LSLE suggest that the decrease of dissolved oxygen concentrations have started since the 1960s (Thibodeau et al., 2006). Similarly, in the GSL, both observation and sedimentary data suggest recent diminution of the dissolved oxygen concentration and about 1.9°C warming (Gilbert al., 2005; Genovesi, 2009).
There are several factors that may be contributing to the hypoxic conditions in the L LE and in the GSL. In the case of the LSLE, Thibodeau et al. (2006) explained
the decrease of the dissolved oxygen concentration by the increase of carbon flux related to anthropogenic eutrophication. Human activity in the St. Lawrence watershed enhanced nutrient discharges with agriculture fertilizers and terrigenous organic carbon related to waste produced by the paper mi]] industry. These anthropogenic discharges caused an increase in biological productivity, carbon fluxes to the sea floor and consumption of dissolved oxygen in the bottom water through organic matter degradation (Gilbert et al., 2007; Thibodeau et al., 2006). However, Gilbert et al. (2005, 2007) have shown that the increase in carbon flux cannot entirely explain the decrease in the dissolved oxygen concentrations and that hypoxia is also related to the increase in bottom water temperatures. Bottom water warming has been attributed to changes in relative proportions of the Labrador Current Water (LCW) and the North Atlantic Central Water (NACW) However in the central part of the GSL, Genovesi (2009) found no evidence of an increase in primary production, whereas increased bottom water temperature close to 2°C seems to be a significant feature of the last century. This led to the conclusion thatthe recent decrease in dissolved oxygen concentration in the GSL cannot be explained by eutrophication but rather by changes in the properties of bottom water masses.
The warming in bottom waters of the LSLE and GSL seems to be a
conspicuous feature on a regional scale (cf. Thibodeau et al., 2010). It could be
related to changes in temperature due to variations in the proportion of Atlantic versus Labrador Sea waters that enter the Laurentian Channel through Cabot Strait as suggested by Gilbert et al. (2005). Such variations could be a resp6nse to natural variability, but the recent change could also be considered as a manifestation of the anthropogenically driven climate warming. In order to determine the respective influence of the natural variability and anthropogenic forcing, the study oftime series that covers several millennia is needed. This is the main purpose of this study.
In this paper, we reconstruct hydrographical conditions and productivity of bottom waters from the analysis of sediment recovered in the piston core COR0503 CL05-37PC (hereafter COR503-37PC). This core was collected in the Laurentian
Channel, in the central part of the GSL, at the same location as box core COR0503 CL05-37BC (hereafter COR503-37BC) studied by Genovesi (2009; Genovesi et al., submitted) that encompasses the last two centuries. This study is thus complementary to the work undertaken by Genovesi (2009) as it focuses on longer time series. A multi-proxy approach has been used in order to reconstruct the environmental conditions in the GSL during the last millennia fol1owing the same procedures described by Genovesi (2009). Micropaleontological and geochemical proxies have been used to evaluate changes in primary productivity and hydrographical conditions ofbottom water in the GSL. To reconstruct the primary pelagie productivity, we used dinoflagellate cysts assemblages as indicators of sea surface conditions such as temperature, salinity and sea-ice coyer (e.g., de Vernal et al., 1993, 1997,2005; Radi and de Vernal, 2007, 2008). Benthic foraminifera were used as proxies of the bottom water conditions (Murray, 2001; Jorissen et al., 2007). The assemblages and abundances of benthic foraminifera were used to document the dissolved oxygen concentration and organic carbon fluxes as they are tracers of the benthic productivity of their ecosystem (e.g., den Dulk et al., 2000; Osterman, 2003; Osterman et al.,
2009). The isotopie compositions of their shells (0180 and Ol3C) were also used to
document physical conditions in the waters in which they calcified, notably to provide an indication of deep water temperature and salinity (e.g., Waelbroeck et al., 2002; Ravelo and Hillaire-Marcel, 2007). Geochemical measurements (organic
carbon Corg and the ratio Corg/N) and isotopie measurements (o l3Corg and 015N) were
used to identify the origin of organic matter preserved in the sediment (e.g., Meyers, 1994, 1997; Muzuka and Hillaire-Marcel, 1997; McKay et al., 2004).
1.2. Study area
1.2.1. Topography and bathymetry
The Gulf of St-Lawrence is a highly stratified 226 000 km2 semi-enclosed sea
water depth of approximately 152 m (Dickie and Trites, 1983). It has two connections with the North Atlantic Ocean Cabot Strait to the South and the Strait of Belle Isle to the East (Fig.1). The main passage that allows major water exchanges with the North Atlantic is Cabot Strait, along the LC, which has a maximum depth of 480 m and a width of 104 km (Dickie and Trites, 1983). The Strait of Belle Isle, in northeastern the GSL, is a small passage, 16 km wide and 60 m deep (Dickie and Trites, 1983; Bugden, 1991).
The bathymetry of the GSL is marked by the LC as the dominant topographic
feature of the maritime and estuarine systems in the GSL. It is a deep central trough
that maintains a depth of over 300 m through the most of its 1100 km length, which extends from the continental shelf off Cabot Strait in the North Atlantic to Tadoussac
in the St. Lawrence Estuary (Bugden, 1991).
In
the North of the GSL, the LC isramified into two secondary branches: the Esquimans Channel and Anticosti Channel with a maximum depth of 345 m and 296 m respectively (Loring and Nota, 1973) (Fig.1).
1.2.2. Water circulation and hydrographical characteristics
The surface waters in the GSL are fed by freshwater runoff of the St. Lawrence River that drains a large watershed including that of the Great Lakes (Dickie and Trites, 1983). This freshwater discharge mixes partially with oceanic waters and flows seaward to finally exits towards the Atlantic Ocean. The surface circulation also follows the dominant wind patterns that are controlled by general cyclonic circulation (EI-Sabh, 1973). The Cabot Strait allows important exchanges between the GSL and the Atlantic Ocean and thus serves as the exit for nutrient rich freshwaters. Cabot Strait also allows the input of deep oceanic waters along the LC
(Saucier et al., 2003). Thus the water column of the LC is divided into three layers
(Dickie and Trites, 1983). A thin surface layer (approximately 50 m) characterized by low salinity (27 to 32 psu) shows a large seasonal variation in temperatures (Dickie and Trites, 1983). This layer is influenced by the vernal changes in surface flux and
freshwater discharge (Bugden, 1991). An intermediate layer extending down ta ISO
mis characterized by moderate salinity (31.S to 33 psu) and very cold water (-OS ta
1°C). This cold intermediate layer originates from winter cooling and water density increase in addition to brine release during sea-ice formation (e.g., Gilbert and Pettigrew, 1997). The bottom water layer is warmer (4 to 6°C) and saltier (-34.6 psu) than the cold intermediate layer (Dickie and Trites, 1983). The bottom water penetrates into the Gulf through Cabot Strait and results from mixing Labrador Current Water (LCW) and North Atlantic Central Water (NACW) (Gilbert et al., 200S). This dense bottom water layer circulates landward. From Cabot Strait to the head of the Laurentian Channel, this layer is marked by the decrease in dissolved oxygen concentrations related to the decomposition of organic matter within the deep layer (Savenkoff et al, 1996; Gilbert et al., 200S).
1.3. Material and Methods
1.3.1. Sampling
The core COR503-37PC was recovered in 2005 on the Coriolis II using a
modified version of a Benthos™ piston corer that allows collecting cores up to 9 min
length and 10 cm
in
diameter. CORS03-37PC is 7.90 m long. It was retrieved from408 m water depth in the Laurentian Channel (48°20.0110'N - 61°29.99S0'W). Core handling caused a disturbance of approximately 30 cm of sediment in the upper part of the core. Subsampling was done from 30 cm to 100 cm at 2-cm interval, and at 4 cm interval down to the base of the studied section (176 cm) of the core.
1.3.2. Chronology
The stratigraphie framework of core CORS03-37PC has been established by
Barletta et al. (2010). It was based on S AMS (Accelator Mass Spectrometry) 14C
measurements of shell fragments and paleomagnetic intensity measurements. In addition, we sampled and dated bivalve shell fragments at 45 cm. This provides a
total of 6 radiocarbon ages (Table 1). In order to convert the 14C conventional age to
calendar years, Barletta et al. (2010) calibrated the dates with the CALIB 5.0.2 software (Stuiver et al., 2005) after a normaJization for a 8]]C of --25%0 PDB and assuming a standard reservoir correction of 400 years (Hughen, et al., 2004). We followed the same procedure with the sixth radiocarbon date.
1.3.3. Geochemical analyses
1.3.3.1. Sediment Carbon and Nitrogen analyses (%Corg, COI.gIN, Ôl3C,
Approximately 8 g of dried and crushed sediments from each sample was placed in tin cups and analysed with a Carlo Erba™ NC 2500 elemental analyzer to determine the weight percent total carbon (CTot) and total nitrogen (NTot) contents. The organic carbon content (Corg) was measured from sediments acidified by the
fumigation method (Hélie, 2009). Subsamples were weighed into silver cups and placed carefully in a c1ean Teflon tray. The tray was put in a closed glass container with a beaker of concentrated HCI for 24 hours. During this interval, the HCI that saturated the air in the container reacted with the carbonate minerais. After fumigation, the silver cups were closed, wrapped in tin cups and then analyzed with Carlo Erba™ NC 2500 elemental analyzer. The results are given in percent (%) of the total weight. Replicate measurements of organic analytical reference materials determined the analytical precision which is estimated at ± 0.1 % for Corg and ± 0.3%
forN.
The isotopie analyses of organic carbon (Corg), were measured on subsamples
prepared fol1owing the same method used for organic carbon content (Corg). For
isotopie analysis of total nitrogen (81SJ'hot), we placed sediments in tin cups to be analysed. The measurements were performed with a Micromass Isoprime™ mass spectrometer coupled with a Carlo Erba™ elemental analyzer. The results are reported in 8 notation (%0) with reference to V-PDB (Vienna Pee Dee Belemnitella)
for bDC (Coplen, 1995) and air for b15N. The analytical uncertainty is 0.1 %0 for [3C
and 0.2 %~ for bl5N as determined from replicate measurements of standard materials
during analytical runs.
1.3.3.2. Oxygen and carbon isotopes analyses in benthic foraminiferaJ shells (ô180 , Ô13 C)
A preliminary assessment suggested that Bulimina margina/a and Bulimina exilis are the most abundant and frequent species of calcareous benthic foraminifera within our samples. Tests were conducted to determine which species was most
suitable for oxygen and carbon isotope analysis (b I80, b13 C). As presented in the
results section, both species yield comparable isotope compositions with respect to
b18 0 but differ in their b13 C, likely due to depth habitat in the sediment (Corliss,
1985). Bulimina marginata is described as an intermediate infaunal species that lives near the sediment-water interface (Jorissen et al., 1998), whereas Bulimina exilis is a
deep dwelling infaunal species (Jorissen, 1999). Thus,
in
order to produce results thatreflect better the isotopie composition of the bottom waters, in which benthic
foraminifera tests are calcified, we chose to analyse bl80 and bl3C of Bulimina
marginata.
Approximately one dozen calcareous tests of Bulimina margina/a were hand
picked from the 125-250 Ilm fraction of each subsample. The tests were roasted under
vacuum at 250°C for approximately one hour. They were th en analyzed with a Micromass Isoprime™ isotope ratio mass spectrometer in dual inlet mode coupled
with a MultiCarb™ preparation system. To extract the CO2 , samples were acidified
with pure H3P04 at 90°C. Measurements were corrected to an internai reference
carbonate material calibrated against the V-PDB scale. The analytical reproducibility determined by replicate measurements of the internai reference material is regularly better than 0.05 %0.
1.3.4. MicropaleontologicaJ analyses
Prior to analysing the micropaleontological content of the sediment, subsamples were treated according to the method described by de Vernal et al.
(1996).
For each subsample, a volume of 5 cm3 of wet sediment was sieved on 106
Ilm and 10 Ilm mesh sieves to eliminate coarse sand, clay and fine silt particles. To dissolve carbonate and silica particles, the fraction between 10 and 106 Ilm was treated with warm hydrochloric acid (HCI 10%) and warm hydrofluoric acid (HF 49%). The residue was washed on a 10 Ilm sieve to eliminate remaining particles after the chemical treatments. The residue was mounted between slide and cover-slide in glycerine gel for optical microscopie analysis at 400x magnification. AIl the palynomorphs (dinocysts, pollen grains, spores and organic linings) were identified and counted. On average, 300 dinocyst specimens were identified and counted following the taxonomical nomenclature of Rochon et al. (1999). Concentrations of dinocysts (cysts g'l) and other palynomorphs were calculated using the marker grain method (Matthews, 1969). In this paper, we only report dinocyst concentrations and the relative abundance of the most abundant dinocyt taxa. Detailed palynological data arereported in Dhahri (2010)
To quantitatively reconstruct sea-surface conditions (temperature, salinity and ice cover) and productivi.ty, we applied the best analogue technique (Guiot and de
,
Vernal, 2007) using the n= 1429 dinocyst reference data base and the MODerate resolution Imaging Spectroradiometer (MODIS) database (http./idaac.g fc.nasa.gov ; Behrenfeld and Falkowski, 1997) as a reference of the modern productivity. The validation exercise indicates an accuracy of reconstruction of ± 54.97 gC m'2 Details about the approach can be found in Radi and de Vernal (2008).
In order to obtain sufficient quantities of benthic foraminiferal specimens for the analyses of population and isotopie measurements, a volume averaging 15 cm3 of wet sediment was dried at room temperature. This volume was weighed and washed on 106 Ilm mesh sieves. The fraction >106 Ilm was dried, weighed and examined
with a binocular microscope (x40). Ali the benthic foraminiferal tests were hand
picked from the> 125 ~m size fraction, identified and counted in order to obtain
sufficient numbers of specimens for our analyses. An average of 53 shells was collected pel' sample. The identification of benthic foraminifera was based on the taxonomy established by Rodrigues (1980). Here, we illustrate benthic foraminiferaJ
concentrations (tests il) and relative abundances of ail the taxa.
1.4 Results
1.4.1 Chronology
An interpolation function, based on 5 AMS 14C dates, was used by Barletta el
al, (2010) to 'make up the age vs. depth relationship. According to this relationship,
the sedimentation rate changes from ~ 190 cm ky(l to ~40 cm ky(l at about 8500 cal.
years BP (i.e. ~ 375 cm) (Fig.2a). As shown in Figure 2a, the additional date obtained
at 45 cm seems inconsistent with the uppermost age from shells collected at 38 cm
and offset with respect to the age-depth relationship established by Barletta el al.
(2010). Due to the disturbance in the upper part of the core and the unknown identity (habitat depth) of shells dated, we decided to use a linear regression across the few
data points to estimate sedimentation rates. After adding the AMS 14C date from
shells collected at 45 cm (this study), we estimated that sedimentation rates in the upper part of the core average 41cm ky(l However, according to this relationship, the upper 18 cm of the core would have unrealistic ages in the future.
In order to obtain an age-depth relationship with realistic ages, we applied across the data points linear regression in 4 different ways. First, we established an
age-depth relationship based on the linear regression using the Ai\1S 14C dates at 45
and at 375 cm and by assuming a surface age of 0 cal. years BP (Fig.2b). According to this regression, we estimated an average sedimentati<:m rate of 44.3 cm ky(l In order to verify the validity of the age vs. depth relationship, we applied a second linear regression using the same data points without assuming an age of 0 cal yI' BP at
the surface. The results showed an average sedimentation rate of 43.7 cm ky(l almost identical to our first estimation. Furthermore, we used the AMS 14C dates at 38, 45,
71 and 375 cm in order to establish a linear regression by assuming a surface age of 0 cal. years BP. The calculated sedimentation rate was about 44.7 cm ky(l Finally, we applied the linear regression through the 4 data points without assuming an age of 0 cal. years BP at the surface. The regression yielded an average sedimentation rate of 41.8 cm ky(l.
In conclusion, the variation in calculated ages possible for the age vs. depth relationships used for this core, is relatively small and we estimated the maximum variation at 6 % which do es not affect the interpretation of our work. However, in the cases of omitting the surface age of 0 cal. years BP, we obtained an unrealistic age in the future at the top of the core. Thus the final age-depth relationship used for this core is based on thefirst assumption which considers a tinear regression between a surface age of
a
cal. years BP and calihrated 14C dates at 45 and 375 cm.1.4.2. Geochemistry of organic matter in sediments
The geochemical and isotopie analyses of organic matter in the sediment show important variations in
C
org content,CIN
ratio,cPCorg
and 015N values (Fig.3). Thevariations occurred simultaneously for ail parameters and demonstrated two different trends in the upper and lower part of the analysed sequence. Hence, the sediment sequence can be divided in to two units: Unit II which extends from 176 to 100 cm (between ~ 4000 and ~ 2300 cal. years BP) and Unit 1 which covers the upper part of the sedimentary sequence (i.e. from 90 to 30 cm).
Unit JI
The Corg content was relatively uniform throughout unit II and averaged
1.22% The CorgiN ratio varied slightly between 10.2 and 10.9 and averaged 10.59
remained close to 5.53 %0 (Fig.3d). The values of CorgiN ratio, 813 Corg and
8
1SN
are within the range commonly reported for marine organic matter (Meyers, 1994). This shows that marine productivity was the main source of organic matter, although the contribution of terrestrial input was significant (e.g., Muzuka and Hillaire Marcel, 1999).Unit 1
Higher values of Corg content characterized unit 1. They increased up to 1.62%
at 30 cm (Fig.3a). The trend ofincreasing values towards the top of the sequence may have resulted from enhanced flux of organic matter related to higher marine productivity (Meyers, 1994), as suggested by the decreasing CorglN ratio values from
10.9 to 9.9 (Fig.3b) and the increasing
8
13 Corg from -23.19 to -22.87%0. However,the increase in
8
1SN
values from 5.42 to 6.11 %0 suggests increased continental inputs.The transition between the two units occurred between 100 and 90 cm. This may represent a graduai transition but may also reflect smoothing due to bioturbation.
The increase in Corg content at 100 cm corresponded to ~2300 cal. years BP.
1.4.3. Dinocyst assemblages
Dinocyst concentrations show large amplitude fluctuations over the last millennia but no clear trend. The density ranged between 10000 cysts g-I and 33000
cysts g-l and averaged 18271 cysts g-l A total of 14 dinocyst taxa were identified
(FigA). Four taxa are heterotrophic (see Table 2). The dinocyst assemblages are
dominated by cysts of Pentapharsodinium dalei and lslandinium minutum, which
respectively averaged -32% and ~28% of the assemblage. These two species are
followed by Operculodinium centroccapum (~19%) and Nematosphaeropsis
labyrinthus (-10%), in addition to Brigantedinium spp. (-5%). The assemblages also
include Sel'enopemphix quanta, lslandinium? cezare, Spin~lerites elongatus,
Ataxiodinium choane and the cysts of Alexandrium tamarense, which together accounted for less than 6%.
The variations in the composition of the assemblages were mostly driven by changes in the relative abundances of Pentapharsodinium dalei, which decreases from ~5 7 to ~ Il% relative to increase in Operculodinium centrocarpum (~1 0 to
~38%) and Nematosphaeropsis lahyrinthus (~6 to ~18%). The fluctuations of the
relative abundances of these taxa are difficult to interpret as they have a ubiquitous distribution in the northern North Atlantic and adjacent seas (Rochon et al., 1999). Nevertheless, the increase of Nematosphaeropsis labyrinthus and Spiniferites spp., related to the decrease of Pentapharsodinillm dalei, may reflect a trend toward warmer sea-surface conditions (Rochon et a!., 1999; de Vernal and Marret, 2007).
The other dominant taxon lslandinium minutum, and most of the secondary species showed high frequency oscillation but no clear trend. However, the relative abundances of the heterotrophic taxa Brigantedinillm spp. and Selenopemphix quanta increased above 100 cm (~2300 cal. years BP) from ~O. 7 to ~ 13% and from 0 to
~4%, respectively. This could be explained by changes in the trophic conditions
reflecting increased productivity (e.g., de Vernal et al., 2001; de Vernal and Marret, 2007; Radi and de Vernal, 2008).
1.4.4. Reconstructions of sea-surface conditions and pelagie productivity
The reconstructions show important variations in sea-surface temperature in summer (SST) and salinity (SSS) in summer in addition to sea-ice cover (Fig.5). Two different intervals can be distinguished. From 176 to 85 cm, the SST and SSS recorded high frequency oscillations of large amplitude (3.2 to 12.9°C and 29 to 32 respectively). The sea-ice cover also recorded large amplitude variations, from 3 to 6 months yr"J. Between 105 and 85 cm, minimum SST and maximum sea-ice are recorded. This cold interval is centered around ~2100 cal. years BP. Above 85 cm, there was a trend of increasing SST from 6.3 to 12.4°C, concomitant with decreasing
sea-ice coyer from 6 to 3 months y(l, and SSS that decreased up to 30. The upper part of the sequence, above 68 cm, recorded relatively stable conditions.
In order to reconstruct productivity, we used the modern analogue technique (Guiot and de Vernal, 2007) with reference to the MODIS database (http://daac.g fc.nasa.gov). As shown by Radi and de Vernal (2008) such an approach permits reconstruction with an accuracy of± 18%. The results suggest annual primary production of 2S0 gC m-2 y(l and show large amplitude oscillations with depth (Fig.S). In the lower part of the section, from 176 to 100 cm, the estimated productivity varied between 144 and 306 gC mo2 y(l and averaged 291gC m-2 y(l Two minimum values were recorded in the interval between 100 and 88 cm; one at 94 cm (12S gC m-2 y(l) and the other at 90 cm (128 gC m-2 y_l) In the upper part of the core, above 90 cm, the primary productivity reconstructions estimate particularly high values averaging 300 gC m-2 y(l Therefore, the reconstructions suggest variations in
productivity with a significant increase after - 1900 cal. years BP.
1.4.5. Benthic foraminiferal assemblages
Agglutinated benthic foraminifera are absent in the studied section of core CORS03-37PC. However, the previous study of Genovesi (2009) reported their occurrence in the upper part of the box core CORS03-37BC (O-S cm). Their distribution and exclusive occurrence in surface sediment is likely due to poor preservation with increasing sediment depth (cf Murray, 1991; Murray and Alve, 1999).
Calcareous benthic foraminifera were recorded in ail samples Their concentrations varied between lA and 26.6 tests g-' and averaged 7.2 tests g-' (Fig.S). The abundance remained relatively low (~ 7 tests g-I) in the lower part of the section, especially below 104 cm. They were slightly higher in the upper part of the core and varied between 3 and 26.6 tests g-l
Of the 21 identified benthic calcareous foraminiferal species (see Table 3), 4 dominate the assemblages The dominant species' include Blilimina marginata,
Bulimina exilis, Elphidium exeavatum and Nonioneffina labradoriea. The secondary species are Brizafina subaenariensis, Bueeella frigida, Glandulina laeviga/a, Globobufimina aurieulala, Lagena sp. and Islandieffa norerossi. The remammg species that were occasionally present are Bolivina inflata, Cassidulina reni/orme, Cibieides loba/ulus, Cibicides pseudoungerianus, Den/alina sp., Fissurina sp., Lentieufina sp., Nonioneffina turgida, Oofina hexagona, Oridorsafis umbonatus and Quinqueloeulina seminulum.
Major changes characterized the benthic foraminiferal assemblages, which led to distinguish three assemblages with different patterns throughout the core. The first one was recorded between 176 and 128 cm (i.e. 4000 - 2900 years BP) and is
characterized by the dominance of B. exifis followed by B. marginata which averaged
49% and 28%, respectively. The relative abundance of N labradoriea and E. exeavatum was relatively low (averaged 3 and 7%, respectively) and started
increasing slightly at the top of the interval. The relative abundances of
G.
al/rieulataand 1. norerossi remained low throughout the sequence.
The second assemblage, between 128 and 88 cm (2900 - 2000 cal. year BP),
was characterized by the disappearance of B. subaenariensis,
G.
laevigata andQ.
seminulum and the appearance of
G.
aurieulata and 1. norerossi. The maximumrelative abundances of N labradoriea and E. exeavatum was recorded at the
beginning of this interval (up to 37% and 39%, respectively). This interval was also characterised by the decrease of the relative abundance of B. exilis from 49 to 28%. This cou Id be explained by the decrease of the fresh and unaltered organic matter input (Jorissen et a!., 2007).
The upper assemblage, recorded from 88 to 30 cm, was characterised by the
appearance of B. frigida and the reappearance of G.laevigata, Q. seminulum and B.
subaenariensis, which recorded a peak at 70 cm th en decreased towards the top of the zone. The percentage of N labradoriea increased to 14% in the upper part of the
sequence. The increase in the relative abundance of B. subaenariensis, G. aurieula/a,
bottom water at the GSL during the last centuries. This trend suggest also a decrease in the dissolved oxygen concentrations, as these taxa are reported from low level
oxygen environments (Sen Gupta Machain-Castillo, 1993; Fontanier el al, 2002;
Murray, 2001; Jorissen el al., 2007).
1.4.6. Isotopie composition of benthic foraminiferal shells
As mentioned in the method section, isotopie analyses were performed on two species of benthic foraminifers, Bulimina exilis and Bulimina margina/a, in order to verify if we cou Id develop a multispecies record. The results (Fig.7) show that the
0
180
of B. marginata was slightly depleted relative to B. exilis. However, the values can be comparable when taking into account the analytical reproducibility, and the fact that the two species do not occupy exactly the same depth in the sediment. TheO
l3C results, on the other hand, strongly differed. B. exilis had values significantlylower (-2 %0) relative to B. marginata. This could be explained by the fact that B.
margina/a is a shallow infaunal species living close to the sediment-water interface whereas B. exilis is a deep infaunal species (Jorissen, 1999; Jorissen et al., 1998).
Thus, the
o
l3C of B. exilis reflects the depletion of 013C pore waters after oxidation oforganic matter in the sediment (e.g., Corliss, 1985) Here, we chose to analyse B.
marginata since it better reflects the isotopie composition of bottom waters.
The difference in the
o
l3C values between the two species is also enhanced bythe comparison of the results obtained from B. marginata in the upper part of the piston core (this study) and from B. exilis in the box core CORS03-37BC (Genovesi,
2009) (Fig.8). The results show similar 018
0
values for both species but very differentO
l3C values. B. marginala values ranged between -0.32 to 0.25 %0, which is notablyheavier than those ofB. exilis, which ranged between -2.37 %0 and -1.63 %0.
l3
C
In core CORS03-37PC, the
O
values of B. marginata showed littlevariation. Nevertheless, a slight diminution of
O
l3 C values from 0.06 ± 0.05 %0 to The 018 0 profile of
B.
marginata shows variations rangmg from 2.08 to 3.09%0. A decrease from ~2.75 %0 to ~2.58 %0 was recorded from the base of the section to 132 cm. In the upper part of the core, 0180 values increased from ~ 2.56 to 2.91 %0 between 112 and 64 cm (i.e. from ~2500 to ~1500years BP) and decreased to~ 2.57 %0 at the top of the sedimentary sequence. Such variations are significant and may refiect changes in the isotopie composition of sea-water or changes in temperature.
If we make the assumption of quasi-uniform (5 180 of sea water (cf. Thibodeau et al., 2010; Genovesi et al., submitted.) we can estimate the bottom water temperature by applying the paleotemperature equation of Skackleton (1974) to the 0180 data from
B marginata. The equation is as follows:
where t represents the temperature (in OC) of the ambient water in which calcite is Ô180 c
precipitated, is the isotopie composition of the calcite (measured in B.
marginata) (versus V-PDB), Ô180 w is the isotopie composition of the ambient water
(versus V-SMOW). For the Ô180 w , we used a value of 0.07%0 as did Genovesi (2009).
of 018
0
This value corresponds to an average measurements in the Gulf of St. Lawrence collected between 350 and 450 m (cf. Schmidt et al., 1999).
The estimation of temperature indicates important variation in the properties of the deep water in the Laurentian Channel. The temperature estimation ranged from 2°C to 7°C, with an average temperature of± 4.8°C (Fig.9a) According to 018
0
data, the temperature corresponds to present day values. Minimum temperatures were recorded between 112 and 84 cm, which corresponds to ~ 2500-1900 cal. years BP. The top of the record is marked by a trend toward higher values and therefore warmer conditions.1.5. Discussion
1.5.1. Pelagie productivity and organic carbon flux
The Corg and Corg/N contents in the upper 10 cm (i.e. 30-40 cm) ofCORS03 37PC averaged 1.6 % and 9.9 respectively. Such values are higher tnan what was
measured in core CORS03-37BC (ayerage Corg of 1 % and
CIN
of 6.3; cf. Genovesi,2009), yet, they are within the lower range of those recorded in the Laurentian
Channel (Muzuka and Biliaire Marcel, 1999) and in Cabot Strait (Mucci el al., 2000).
The difference in Coro content in the two data sets cou Id result from the use of two "'
different analytical methods to determine the bul k Corg concentrations in the sediment. For this study, we used the fumigation method (Bélie, 200S), whereas Genovesi (2009) used an acidification technique, which is a method that can lead to underestimation of the Corg content due to imperfect dissolution of non organic remains (Hélie, 200S). In order to verify this assumption, several tests were made using aliquots of both cores. Results confirm the systematic difference between the two approaches, with fumigation yielding higher organic carbon values and more reliable data.
The Corg content in the core ranged from 1.1S to 1.6%, and between 176 and
106 cm values were relatively uniform at 1.2 ± 0.1 %. The Corg content had a sharp
increase from 1.2 to 14S% at about 100 cm. In the upper part of the core, Corg values increased gradually to reach up to 1.62% at 30 cm. The increase in the relative
organic content in the sediment occurred at ~2300 cal. years BP. It could have
resulted from higher organic fluxes or lesser dilution with inorganic particles. In the latter case, it could be related to increased marine productivity or to increased terrestrial organic matter input (Meyers, 1994). Alternatively, the higher organic carbon in the upper part of the core could be due to better preservation of organic matter, notably because of low dissolved oxygen levels (Meyers, 1994).
The marked change in orgamc carbon content at ~2300 years BP was
accompanied by changes in the
CorgiN
ratio and û13Corg, which suggests an increase inthe marine inputs relative to terrestrial organic matter (e.g., Muzuka and Hillaire Marcel, 1999). Therefore, both the Corg/N ratio and the isotopic composition of organic carbon suggest increased organic carbon fluxes of marine origin during the last two millennia.
In
contrast, Ûl5N follows an opposite trend and drifts slightly towards highervalues to reach values recorded in COR503-37BC. This could be explained by the increase in terrestrial organic matter (Montoya, 1994), but appears unlikely ifwe rely
on the Corg/N ratio and û13Corg values. Alternatively, the trend could result from an
increase in nitrate uptake by changing phytoplanktonic populations (e.g., Muzuka and Hillaire Marcel, 1999; McKay, 2004) as observed in the Southern Ocean, where
higher 815N values indicated high efficiency and utilization rate of surface nitrate by
phytoplankton (François et al., 1994).
Independently from the geochemical and isotopic data, the palynological
record suggests an important change in the pelagie productivity since ~ 2300 cal.
years BP, which is probably related to a change in the hydrography that is marked by lower salinities suggesting enhanced freshwater input and more estuarine conditions. The dinocyst concentrations remained high throughout the sequence (averaged
~20000 cyst g-I), but important changes in dinocyst assemblages were observed with
a significant increase in the proportion of the heterotrophic taxa Brigantedinium spp. and Se/enopemphix quanta. Such a transition reflects changes in trop hic conditions and increase in productivity (e.g., de Vernal et al., 2001; de Vernal and Marret 2007, Radi and de Vernal, 2008). The reconstruction of sea-surface conditions indicate warmer SSTs during the last 1500 years, as suggested by the increase of Nematosphaeropsis labyrinthus and Spiniferites spp. and the decrease of Pentapharsodinium da/ei. The reconstruction of the annual primary production based
significantly higher values in the upper part of the core, above 90 cm which corresponds to the last 2000 years. The reconstructed primary productivity between 60 and 30 cm averaged 302 ± 54 gC m-2y(!, which is consistent with estimates from the analyses of the box core that spans the last two centuries (Genovesi 2009; Genovesi et al., submitted).
1.5.2. Bottom water conditions
The abundance and distribution of benthic foraminifera can be controlled by changes in physical and chemicaJ parameters such as temperature, sali nity, dissolved oxygen concentration, light and turbidity (Murray, 1991; 2001). Many studies used foraminifera as indicators of hypoxic water (e.g., Osterman, 2003; Osterman et al., 2009; Kaiho; 1994) and changes in productivity (e.g., Mojtahid et al., 2008).
Therefore, the variation observed in the benthic foraminiferal assemblages can reflect significant changes in environmental and oceanographie conditions in the GSL during the last millennia. The analysis of core COR503-37PC reveals an increase of the benthic foraminiferal concentrations toward the surface, which roughly corresponds with the increase in pelagie productivity and higher Corg content. The higher concentration of benthic foraminifera could be a response to the higher fluxes of organic matter (Leckie and Oison, 2003). That is also confirmed by the dominance of
B. exilis, a benthic foraminifer generally associated with high organic matter inputs (Jorissen et al., 2007). The increase of the relative abundances of
B.
subaenariensis andG.
auriculata in the upper part of the sedimentary sequence may also be an indication of a decrease in the dissolved oxygen (Sen Gupta and Machain-Castillo, 1993; Murray, 2001; Jorissen et al., 2007). Moreover, the variations of the relative abundances ofN.
labradorica, which is a characteristic species of the Labrador Sea (Bilodeau et al., 1994), can reflect the changes in the contribution of the LCW relative to NACW in the bottom water of the GSL. In the study carried out by Genovesi et al. (submitted), the recent decrease in the relative abundance ofN.
labradorica matches the increase in bottom water temperature as estimated from 8180 in foraminiferal tests. This recent trend has been associated with the decrease in the contribution of the cold and highly oxygenated LCW as observed since the 1930s (cf Gilbert et al., 200S). In our study, we noted variations of the abundance
N.
labradorica but the relationship with the estimated temperature based on 8180 are not unequivocal.
The maximum of
N.
labradorica between 120 and 90 cm would suggest a maximum contribution ofLWC at ~2700- 2000 cal. years BP, whereas the upper part of the core marked by the co-occurrence of B. subaenariensis, B. fhgida and Globobulimina auriculata shows estuarine characteristics (Jorissen et al., 2007)The 8180 in benthic foraminifera provides additional information on bottom water properties. Although difficult to interpret precisely without data on the isotopic composition of bottom waters, the 8180 signal shows millennial scale oscillations (Fig.9a).
The benthic foraminiferal assemblages and their isotopic composition, therefore, illustrate changes in the properties of bottom waters that are related to several parameters, which likely include temperature, sea-surface conditions, pelagic productivity and biogenic fluxes to the sea-floor and oxygen concentration.
1.6. Conclusion
Micropaleontological, geochemical and isotopic analyses of sediments from core COROS03-CLOS-37PC collected in the Laurentian Channel in the central part of the Gulf of St. Lawrence show important environmental changes over the last millennia. These changes are related to variation in the biogenic productivity in the upperwater mass and subsequent flux of organic matter. They are also related to variations in bottom water temperatures. These parameters are however decoupled in our records. The data suggest a major change in productivity and organic fluxes after
~2300 years BP, whereas the estimated bottom water temperatures suggest millennial oscillations with colder conditions being recorded prior to 2800 cal. years BP and at
~ 1800 cal. years BP.
The variations recorded here differ from those documented during recent centuries in the St. Lawrence Estuary (Thibodeau et al.; 2006, 2010) and in the Gulf
of St. Lawrence (Genovesi, 2009; Genovesi el a!., submitted). In the Estuary, there
has been a recent decrease in bottom water oxygen content corresponding to both
increased productivity, organic fluxes (Thibodeau el Cl!., 2006) and warming in
bottom waters since the turn of the last century (Thibodeau el a!., 2010). In the Gulf,
where there is high productivity with no significant changes at the scale of the last centuries, the trend towards hypoxia seems rather related to warming of bottom
waters (Genovesi el a!., submitted). Our data that extend back in time, much prior to
the period of human occupation, show complex variations of productivity and bottom water conditions that are related to natural variations. They illustrate forcing at millennial scales to which centennial variations such as those observed by Thibodeau et a!. (2006; 2010) and (Genovesi, 2009) are superimposed. They demonstrate the sensitivity of the St. Lawrence Estuary and Gulf ecosystems. The data also suggest that the general conditions that prevail since in the last few centuries in the Gulf of St. Lawrence, with relatively warm bottom temperature and high pelagie productivity, lead to enhanced sensitivity of the system towards hypoxia.