HAL Id: hal-01667187
https://hal.archives-ouvertes.fr/hal-01667187
Submitted on 15 Mar 2019
HAL is a multi-disciplinary open access
archive for the deposit and dissemination of
sci-entific research documents, whether they are
pub-lished or not. The documents may come from
teaching and research institutions in France or
abroad, or from public or private research centers.
L’archive ouverte pluridisciplinaire HAL, est
destinée au dépôt et à la diffusion de documents
scientifiques de niveau recherche, publiés ou non,
émanant des établissements d’enseignement et de
recherche français ou étrangers, des laboratoires
publics ou privés.
Dry coating characterization of coverage by image
analysis: methodology
Olivier Lecoq, Fredj Kaouach, Alain Chamayou
To cite this version:
Olivier Lecoq, Fredj Kaouach, Alain Chamayou. Dry coating characterization of coverage by image
analysis: methodology. 7th World Congress on Particle Technology (WCPT 7), May 2014, Pékin,
China. pp.81-88. �hal-01667187�
Procedia Engineering 102 ( 2015 ) 81 – 88
1877-7058 © 2015 The Authors. Published by Elsevier Ltd. This is an open access article under the CC BY-NC-ND license (http://creativecommons.org/licenses/by-nc-nd/4.0/).
Selection and peer-review under responsibility of Chinese Society of Particuology, Institute of Process Engineering, Chinese Academy of Sciences (CAS) doi: 10.1016/j.proeng.2015.01.114
ScienceDirect
The 7th World Congress on Particle Technology (WCPT7)
Dry coating characterization of coverage by image analysis:
methodology
Olivier Lecoq*, Fredj Kaouach, Alain Chamayou
School of Mines of Albi, RAPSODEE, Albi, France
Abstract
Dry coating is an interesting process for creating added value binary powders composites. The principle is to mix 'host' particles with 'guest' particles with 10 to 100 times smaller size. But, behind the apparent simplicity of the process, the implied mechanisms are very complex. As a result, it is not possible so far to predict the resulting end-use properties of the produced composite powder, even if we know the properties of the host and guest powders. This papers aims at illustrating a first step to characterize more precisely the process itself and the result of the coating, i.e. coverage, homogeneity or thickness… In this work we describe the methodology to characterize the dry coating coverage through image analysis by using Environmental Scanning Electron Microscopy. A first part of this paper gives the technical and statistical aspects of the image acquisition in the electron microscope (Philips XL 30). A second part develops the image processing methodology with Matlab Image Processing Toolbox. A third part describes a validation step of the methodology by comparing the automated procedure to a 'manual' derivation of the coverage. The presented results imply the coverage of 'model' powders: host particles of ca. 100μm and guest particles of ca. 10μm. This work illustrates the assets of the image analysis to quantitatively characterize the average coverage and its homogeneity in dry coating application, for example when partial breakage or attrition occurs. Further results with the application of this methodology will be published in a further paper.
© 2014 The Authors. Published by Elsevier Ltd.
Selection and peer-review under responsibility of Chinese Society of Particuology, Institute of Process Engineering, Chinese Academy of Sciences (CAS).
Keywords : Dry coating; Coverage; Homogeneity; Image Analysis; Hybridizer
* Corresponding author. Tel.: +33 5 63 49 30 69; fax: +33 5 63 49 30 25. E-mail address: [email protected]
© 2015 The Authors. Published by Elsevier Ltd. This is an open access article under the CC BY-NC-ND license (http://creativecommons.org/licenses/by-nc-nd/4.0/).
Selection and peer-review under responsibility of Chinese Society of Particuology, Institute of Process Engineering, Chinese Academy of Sciences (CAS)
82 Olivier Lecoq et al. / Procedia Engineering 102 ( 2015 ) 81 – 88 1. Introduction
Dry coating is an interesting alternative to wet coating, to avoid the use of organic solvent or to avoid the use of a drying step. The process can hence be seen as sustainable process. It is also interesting when the industrial aim is to change or obtain one given end use property but at the same time when the coverage aim is to keep some surface of the initial particle available. For example for improving humidity resistance [1] or for cohesive powders [2].
For process modeling or numerical simulation purpose, we present here the methodology based on Environmental Scanning Electron Microscopy (E.S.E.M.) visualization and image analysis to derive quantitative information on the coverage of large particles (ca. 100μm) dry-coated by small particles (ca. 10 μm).
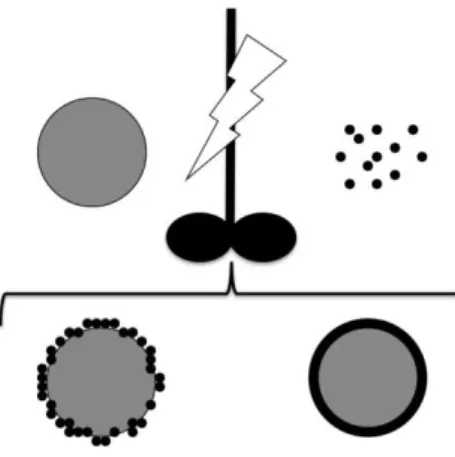
Fig. 1. Dry coating leading discrete coating or filming
2. Description of the dry coating process
Dry coating consists in mixing a couple of powders in adapted processes [2]: the largest powder (a few hundreds of μm) is called host and the smallest (generally 10-100 times smaller) guest (Figure 1). Due to strong mechanical interactions in the mixing process, the small particles (generally a few mass % of the host particles) tend to de-agglomerate and to come into contact with the surface of the large particles. Then due to the mechanical and physico-chemical properties of the different materials 'adhesion' can eventually occur, leading to the creation of composite assemblies with new or improved properties. The coverage layer can be discrete, continuous (porous) or a film [3]. When the quantity of guest is very small: the guests are spread on the host surface and almost never touch. When the guest quantity increases, the coverage is expected to increase. The ideal perfect monolayer coverage is a theoretical situation that serves for comparison.
Surface coverage model
When the small guest particles are mixed with the large host particles, complex phenomena occur that eventually lead to the deposition of the guest onto the surface of the host. But the coverage is not likely to be uniform [4]. On a theoretical point of view (Figure 2), we can consider at least two simple different situations: the complete coverage in a monolayer (e.g. hexagonal close packing, [5]) or an incomplete coverage (random packing or ideal random packing, [6]). In every situation, reality is simplified: monosized spherical powders, geometrical structuration (hexagonal or square packing), no overlapping or guest-guest adhesion [7]...
Fig. 2. Monolayer coverage types: complete (left), incomplete random (center), incomplete ideal (right)
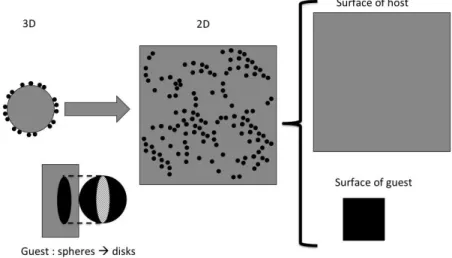
Figure 3 shows the model we consider to transforms '3D reality' (guest spheres covering randomly one host sphere, coating thickness limited to one layer only) into a '2D system' (disks covering a square of same area than the initial host sphere) for one host particle: the spheres are projected in disks.
Fig. 3. 2D packing model for one host particle coated with guest particles
In this model, the surface coverage S of the host particle by the guest particles is: S =Sguest
Shost =
black surface
grey surface (1)
84 Olivier Lecoq et al. / Procedia Engineering 102 ( 2015 ) 81 – 88 3. Materials and methods
3.1. Materials and Processes
Two different powders have been used in this paper: PMMA as host particles, and Talc as guest particles (Figure 4). Table 1 recalls the properties of these materials. Three different processes have been used to produce the composite particles: Nara Hybridizer NHS-0 of half a liter, Hosokawa Cyclomix of one liter, and Hand Mixing. All the details can be found in [3].
Table 1. Used materials properties.
Powder Mean size (Laser granulometer) Density (kg/m3)
PMMA d50 = 130 μm 1240
Talc d50 = 8 μm 2800
3.2. Visualization technique
In this paper, we used the versatile Environmental Scanning Electron Microscopy (E.S.E.M.) XL30 from Philips as our primary visualization technique. Two major modes are possible based on backscattered electrons (contrast depends on atomic number, large number leads to brighter pixel in image) or secondary electrons (contrast depends on topography, sharp edges leads to brighter pixel in image). The environmental mode doesn't require any metallization of the sample surface.
The images of this paper have been obtained mainly with the backscattered electron mode (B.S.E). They show the guest particles in light grey on the host particles in dark grey (Figure 5). Indeed, it is the pre-requisite to be able to calculate the surface coverage. If the contrast is not adapted, we may underestimate the quantity of guest particles on the surface of the host particles. If the E.S.E.M. apparatus isn't providing for enough contrast, other techniques are available such as RAMAN or IR spectroscopy. The generalization of our methodology to other imaging techniques is possible.
The visualization operating conditions have been optimized in order to increase the contrast between the two different powders, so facilitating the following step of image analysis (see the study in §4).
3.3. Statistical considerations
In this work it is important to select the adapted number of images that are characteristic to the coating process we want to study. Specific statistical considerations should be taken into account at three levels. First, the coating experiments should be replicated at least three times. Second, at least three samples should be taken from every experiment. Third, for every sample, a random methodology should be applied for the final selections of the images in the E.S.E.M. chamber. Finally, the minimum number of images should be determined for every sample, based on an arbitrary level of error (e.g. maximum 'accepted' variation of the average of the coverage or the standard deviation of the coverage).
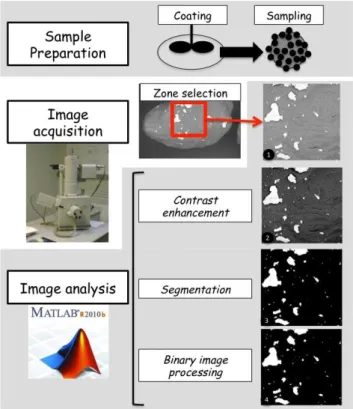
Fig. 5. Image analysis methodology developed in this paper
3.4. Image analysis methodology
The general methodology is represented in Figure 5. It is comprised of 6 mains steps: sample preparation, image acquisition, zone selection, image contrast enhancement, image segmentation, binary image processing. The image analysis routines were developed with Matlab Image Analysis Toolbox. The final binary image is composed of white pixels (guest particles) on a black background (host particle). The coverage surface ratio is calculated from the ratio of the number of the white pixels to the total number of pixels in the selected zone.
The definitions of the coverage descriptors used in this paper are given in Table 2
Table 2. Used coverage descriptors.
Name Definition Comments
Coverage surface ratio S = Sguest Shost 0 < S < 1 Average of S S = Si n n = number of images Standard deviation of S S = Si S
(
)
2 n Coverage inhomogeneity86 Olivier Lecoq et al. / Procedia Engineering 102 ( 2015 ) 81 – 88
The average surface ratio, or coverage S, is a global parameter that can be compared to different model. The standard deviation Sof the coverage provides for global information on the coverage homogeneity from one particle to another. A large S would mean that all the particles do not have the same coverage. S=0 would mean that all the particles have the same coverage.
The artifact of the 3D curvature of the host particles biases the derivation of the coverage. In order to limit the shrinking of the surfaces phenomenon, we limited our angle of observation below 25° when selecting the analysis zones.
4. Influence of the ESEM visualization operating conditions
In order to derive the particle coverage, the E.S.E.M. has to generate high contrasted images. So, it has been chosen to work with the B.S.E. mode (Back Scattered Electron mode or chemical contrast mode). Figure 6 shows on the same sample the importance of the working mode on the final resulting image. In S.E. mode (Secondary Electron mode or topography mode) it is impossible to discriminate on the surface of the host particles the guest particles from fragments of host particles. In B.S.E. mode, there is a strong contrast between the two materials, coming from a large difference in mean atomic number, which is adapted for further image analysis routines.
Fig. 6. Comparison of the B.S.E. (left) and S.E. (right) modes in E.S.E.M. technique for PMMA coated with 1%Talc
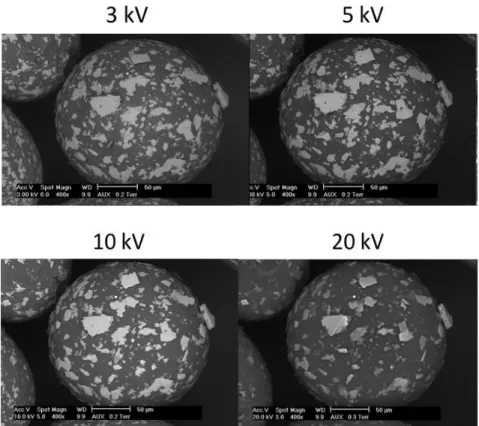
The importance of the operating observation conditions of the E.S.E.M. was also studied. One of the most important parameter is probably the Accelerating Voltage. If it is chosen too small, the image will have poor quality (weak signal). If it is chosen to high, the signal coming from the surface will be higher, but the penetration depth of the electron beam will also be larger. If the energy of the electrons is too high, the resulting image may only be representative of the host particles, as the guest particle signal may be masked. Figure 7 shows the variation of the images when the voltage is increased. From voltage between 10 and 20kV, there is a strong modification of the contrast in the resulting image: the white guest particles are becoming greyer. Between 3 and 5 kV, the resulting image is the same. The optimum Acceleration Voltage has been chosen arbitrarily for our materials at 5 kV.
Fig. 7. Evolution of the E.S.E.M. images with increasing Acceleration Voltage, PMMA coated with 1%Talc
Fig. 8. Comparison of the automatic methodology (from Image 1 to Binary image 1a) and the 'manual' methodology (from Manual contour to Binary image 1b)
88 Olivier Lecoq et al. / Procedia Engineering 102 ( 2015 ) 81 – 88 5. Methodology error estimation
The estimation of the methodology error was performed by 'manual' comparison. The same set of images was analyzed by our automated procedure and compared to a 'manual' selection of the guest particles on tracing paper. Figure 8 illustrates the results for one image: Image 1 (the initial E.S.E.M. image), Binary image 1a (the final image obtained from the automated image analysis routine), Manual contour (the result of the 'manual' selection of the guest particles) and Binary image 1b (the final image obtained after hole filling and segmentation operations). On a qualitative point of view, Figure 8 shows that the final images are very similar. On a quantitative point of view: the calculated coverages are 3.1% (automated way) and 3.6% ('manual' way).
This arbitrary comparison procedure, in the limit of our studied set of images, allows us to estimate that the difference of methodology brings differences in average and standard deviation of about 1-2%.
6. Conclusion and prospects
In this paper, we developed a new methodology to derive quantitative fine description of the coverage in dry coating, based on E.S.E.M. visualization and image analysis routines. The coating is characterized not only with the average coverage but also with the homogeneity of the coverage, with the help of the standard deviation of the coverage. The presented tools allow one to obtain quantitative information, which is crucial for a better understanding of the process, and adapted for further dry coating modeling.
This corresponds to a first step of a more complete set of experiments that will be presented in a future paper. Keeping in mind that the acquisition part is still very time consuming!
Acknowledgements
This work was supported by the POWTECH Marie Curie initial training network, funded through the People Programme (Marie Curie Actions) of the European Union’s Seventh Framework Programme FP7 under grant agreement No. 264722
References
[1] Mujumdar, A., D. Wei, R. N. Dave, R. Pfeffer, & C.-Y. Wu. Improvement of humidity resistance of magnesium powder using dry particle coating, Powder Technol. 140 (2004) 86–97.
[2] Pfeffer, R., R. Dave, D. Wei, & M. Ramlakhan. Synthesis of engineered particulates with tailored properties using dry particle coating. Powder Technology 117 (2001) 40-67
[3] Ötles, S., Lecoq, O., Dodds, J. A. Dry Particle High Coating of Biopowders: an energy approach. Powder Technology 208 (2010) 378-382 [4] J.A. Hersey, Ordered mixing: a new concept in powder mixing, Powder Technology 11 (1975) 41-44
[5] Jones T.M., Pilpel N., Some physical properties of lactose and magnesia. J. Pharm. Pharmacol. 17 (1965) 440-448
[6] M. Alonso, M. Satoh, K. Myanami, The effect of random positioning on the packing of particles adhering to the surface of a central particle. Powder Technology 62 (1990) 35-40
[7] Feder Jens, Random sequential adsorption. J. theor. Biol. 87 (1980) 237-254
[8] Ötles, S., Lecoq, O. and Dodds, J. A. Dry Particle High-Impact Coating of Biopowders: Coating Strength Particulate Science and Technology, 27 (2009) 352-361
[9] Kaouach F., Chamayou A., Lecoq O. Dry coating process characterization, International Congress on Particle Technology PARTEC2013, 23-25 April 2013, Nuremberg, Germany.