HAL Id: hal-01235142
https://hal.archives-ouvertes.fr/hal-01235142
Submitted on 11 Mar 2016HAL is a multi-disciplinary open access archive for the deposit and dissemination of sci-entific research documents, whether they are pub-lished or not. The documents may come from teaching and research institutions in France or abroad, or from public or private research centers.
L’archive ouverte pluridisciplinaire HAL, est destinée au dépôt et à la diffusion de documents scientifiques de niveau recherche, publiés ou non, émanant des établissements d’enseignement et de recherche français ou étrangers, des laboratoires publics ou privés.
Topological modeling of methane hydrate crystallization
from low to high water cut emulsion systems
Aline Melchuna, Ana Cameirão, Jean-Michel Herri, Philippe Glénat
To cite this version:
Aline Melchuna, Ana Cameirão, Jean-Michel Herri, Philippe Glénat. Topological modeling of methane hydrate crystallization from low to high water cut emulsion systems. Fluid Phase Equilibria, Elsevier, 2016, 413, pp.158-169. �10.1016/j.fluid.2015.11.023�. �hal-01235142�
Topological modeling of methane hydrate crystallization
from low to high water cut emulsion systems
Aline Melchunaa, Ana Cameiraoa,1, Jean-Michel Herria, Philippe Glenatb a
Ecole Nationale Supérieure des Mines de Saint-Etienne, SPIN Division, Propice Department, Gas Hydrate Dynamics Team, LGF CNRS-UMR 5307, 158 Cours Fauriel, Saint-Etienne 42023, CS 62362 France
b
TOTAL – CSTJF, Avenue Larribau, PAU Cedex 64018, France
ABSTRACT
Hydrate formation and remediation in oil flowlines facilities represent a major concern for oil industry in respect of capital and operational costs. It is necessary to have a better understanding on the hydrate formation process to be more efficient in hydrate prevention, especially in respect to additive dosage. This work is a contribution to enhance the knowledge of hydrate formation at high water cuts, by introducing new techniques of analysis in the Archimede flow loop: a Focus Beam Reflectance Measurement (FBRM) probe and a Particle Video Microscope (PVM) probe. These results will be supported by Pressure Drop, Flow Rate, Density and Temperature probes. From experimental observations, a method to determine the continuous phase (water or oil) of the system under flowing is proposed. It is based on the time evolution of the most representative chord class measured by the FBRM. In order to predict morphology and size of hydrates, a topological model was developed. It represents hydrate crystallization from different emulsion systems with and without low dosage of hydrate inhibitor additive (anti-agglomerant type). The key parameters are the gas transfer rate at the gas/liquid interface and at the hydrocarbon/water interface, and the role of the hydrocarbon as gas transfer phase. Gas/liquid transfer is low as water phase remains the continuous phase, but is enhanced as hydrocarbon content is increased. Hydrocarbon gas transfer property is depleted as continuous and rigid crust is formed around droplets, especially in well dispersed emulsions. This behavior is highlighted for experiments without anti-agglomerant additive (AA-LDHI) and at high water cut, as a small fraction of hydrocarbon is well dispersed in the water continuous phase. The maximum hydrate plugging risk is in between 70% and 30% water cut (intermediate and low water cut). In this work, experiments at high water cuts (more than 80%) never plug. In order to prevent agglomeration, the AA-LDHI works better if it shows a secondary surfactant benefit, well-dispersing the droplets (and later the formed hydrates) in the continuous phase, which was identified as being preferentially the hydrocarbon phase.
Keywords: crystallization; hydrates; flow assurance; FBRM; AA-LDHI.
1. Introduction
Gas clathrates hydrates, also called gas hydrates, are ice-like structures formed by crystallization process. Hydrogen-bonded water molecules cage a guest molecule, small enough to fit in different types of cavities and typically belonging to the lightest hydrocarbon group. Usually, methane, ethane, propane, butane, carbon dioxide and di-hydrogen sulfide act as guest molecule in hydrate formation. Gas hydrates can form during oil extraction in required conditions: low temperature and high pressure. These conditions are commonly found in subsea pipelines cases. After hydrate formation and agglomeration, pressure drop increase is observed and, in some cases, formation of impermeable plug can occur [1].
Methods to prevent hydrates formation and agglomeration are numerous but expensive, such as, maintaining the pipeline in a secure temperature zone by insulating the pipe, removing water from the system (dehydration), using additives as thermodynamic hydrate inhibitors (THIs) or, most recently, using low dosage hydrate inhibitors (LDHIs), including: kinetic hydrate inhibitors (KHIs) and anti-agglomerants (AAs).
As oil field matures, the water fraction usually increases. Therefore, industry is facing systems where the emulsion continuous phase (oil or water) is unknown [2]. Since the last decade, this area became the focus of research because there is a clear interest on studying it to provide a better management of hydrate formation.
Emulsion is formed from two immiscible liquids, at least, where one liquid is dispersed in another which is called continuous phase. In this work, the determination of the continuous phase before and during crystallization will support our understanding of hydrate formation.
Experiments were performed in the Archimede flow loop equipped with several probes, among them a Focused Beam Reflectance Measurements probe (FBRM) and a Particle Video Microscope probe (PVM). The hydrate formation process in flow lines was investigated by evaluating the influence of different water cuts and varying flow rate. Sets of experiments were performed with and without the presence of a commercial AA-LDHI.
The FBRM probe has been already used to follow hydrate crystallization. Clarke and Bishnoi [3] used this tool to determine the intrinsic kinetic rate of CO2 hydrate formation at different
temperatures. In 2009, Turner et al. [4] used it to follow the hydrate growth at high water cut in crude oil without additive. During crystallization, they detected that water droplets behave as individual reactors to form hydrates; two different mechanisms of formation were identified: hydrate shell formation and water coating hydrate particle. In 2010, Leba et al. [5] proposed an algorithm to calculate the CLD (Chord Length Distribution) from a random and fractal aggregate in order to interpret experimental results in terms of primary particles number and fractal dimension. Their developed model was validated against experimental results from the Archimede flow loop.
The FBRM probe is often coupled with a PVM probe, providing more accurate results. Greaves et
al. [6] found out that sizes obtained with the FBRM are larger than sizes from the PVM for glass
particles in water, however, smaller when measuring droplets in an emulsion. This means that the FBRM probe has to be calibrated for different types of system. Following this study, Boxall et al. [7] proposed a correlation relating the measurements from the PVM and the FBRM. In this work, this correlation is not used, firstly, because it seems not to fit in the studied system. Secondly, it is hereafter proposed an analysis based on the PVM images and FBRM measurements, without numeric treatment.
The focus of this work is to monitor the hydrate formation mechanisms (mainly agglomeration) depending on the water cut (i.e., the water volume fraction) and depending on the continuous phase, in absence and presence of anti-agglomerant (AA-LDHI).
For the performed experiments, the pipeline plugging was stated when no, or very irregular flow was observed. In regards to the additive dosage, the AA-LDHI is used at very low concentration, far below their real dosage in industrial facilities, where their concentration is sufficient to prevent agglomeration, whereas our objective is to observe it, and also other steps of the crystallization. If AA-LDHI concentration is too high, there is no more time evolution in the FBRM, PVM, Pressure drop, Density and Temperature data.
2. Experimental Method 2.1. Materials
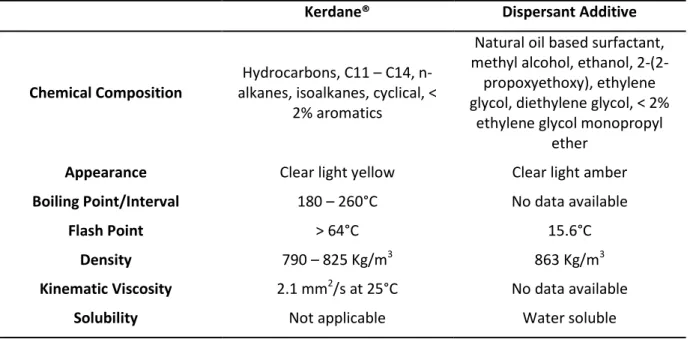
Experiments are performed with pure water, Kerdane®, methane and dispersant additive. Water is Ultra-pure-water (Type 1). The Kerdane® (organic liquid phase material) and the dispersant
additive (commercial anti-agglomerant) are supplied by TOTAL Fluides®; more information is given in Table 1. Pure methane (99.99%) is supplied by AIR LIQUIDE.
Table 1 – Kerdane® and Dispersant Additive characteristics.
Kerdane® Dispersant Additive
Chemical Composition
Hydrocarbons, C11 – C14, n-alkanes, ison-alkanes, cyclical, <
2% aromatics
Natural oil based surfactant, methyl alcohol, ethanol, 2-(2-propoxyethoxy), ethylene glycol, diethylene glycol, < 2%
ethylene glycol monopropyl ether
Appearance Clear light yellow Clear light amber
Boiling Point/Interval 180 – 260°C No data available
Flash Point > 64°C 15.6°C
Density 790 – 825 Kg/m3 863 Kg/m3
Kinematic Viscosity 2.1 mm2/s at 25°C No data available
Solubility Not applicable Water soluble
2.2. Apparatus
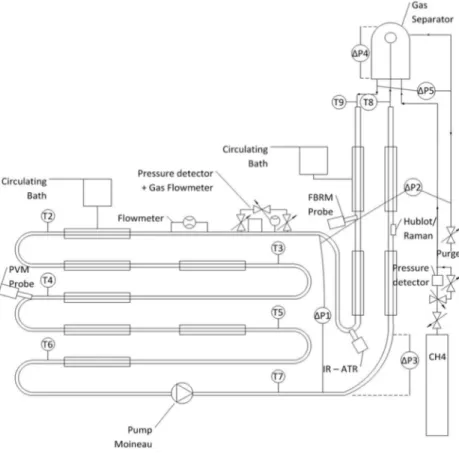
The Archimede flow loop allows an appropriate scale-down of liquid/liquid flowing in deep sea
pipelines. The temperature control ranges from 0°C to 14° and pressure control up to 100 bar. The flow loop has a horizontal section of 36.12 m and internal diameter of 1.02 cm (2/5 inch), a riser of 10 m high going into a gas-liquid contactor/separator and a descending pipe of 10 m long going back down to the horizontal section. The vertical section has an internal diameter of 1.73 cm (2/3 inch). The FBRM is installed on the descending pipe and the PVM is installed on the horizontal section. Several temperature and differential pressure probes follow the time evolution of the experiment. The flow rate is monitored with a Coriolis flowmeter which is also able to measure the density. The
Archimede flow loop layout with probes position is given in Figure 1, more information is given in
Fidel-Dufour [8].
The flow is induced by a multiphase pump (Moineau pump), which can work with flow rate between 72 L.h-1 and 500 L.h-1 (0.3 m.s-1 to 1.8 m.s-1). The Moineau® pump is a kind of progressive cavity pump, consisted of a helical rotor turning inside a helical stator [9]. The rotational movement generates an axial displacement of the closed cells, transferring the product from the intake to the discharge without smashing the crystal. The gap for the liquid flow is the order of centimeters, while the largest hydrate aggregate measured has 200 µm. By this way, the particles, aggregates and agglomerates of hydrates will not be destroyed by the pump, an important factor considering the interest on evaluating hydrate formation and agglomeration.
2.3. Experimental Conditions and Protocol
In this work, water cut was varied from 30% to 90% and flow rate was fixed at either 200 L.h-1 or 400 L.h-1. E xperiments were performed with and without AA-LDHI (intentionally under-dosed for already mentioned reasons). Table 2 summarizes experiments conditions. During hydrate formation, pressure is maintained constant through a system of gas injection, composed of a pressure controller coupled to a gas flowmeter (see Figure 1).
Figure 1 – Experimental apparatus. Table 2 – Summary of experiments and experimental conditions.
Water Cut (v/v %)
Flow Rate
(L/h) Additive (% vs. w) Liquid Loading (%)
90 200 0.0 and 0.005 100 400 0.0 and 0.005 100 80 200 0.0 and 0.01 100 400 0.0 and 0.01 100 70 200 0.0 and 0.01 100 400 0.0 and 0.01 100 60 200 0.0 and 0.01 100 400 0.0 and 0.01 100 50 200 0.0 and 0.01 100 400 0.0 and 0.01 100 40 200 0.0 and 0.01 and 0.05 100 400 0.0 and 0.01 and 0.05 100 30 200 0.0 and 0.05 100 400 0.0 and 0.05 100
Experiment starts by feeding the flow loop with a mixture of water and Kerdane® (and additive when necessary). The emulsion is formed by shear between the liquid mixture and the pipe wall. When pressure drop and average chord length reach homogeneity and stability, the process of emulsion formation is considered as finished [10]. In sequence, the system is cooling down until the operative temperature reaches around 4°C (sub cooling of 6°C), then crystallization is induced by increasing the pressure up to 80 bar by methane injection. The methane is injected in the gas zone of the gas/liquid contactor/separator at the top of the flow loop. This contactor/separator prevents the gas to be flowed in the descending pipe and also acts as a gas/liquid exchanger. In fact, liquid (and solid if present), coming from the riser, forms a geyser that falls down by gravity to the bottom of the separator. The pressure is maintained constant by a pressure compensation system that injects gas at the top of the separator. The injected gas flow rate is monitored allowing the resolution of a mass balance, and then to calculate the experimental conversion of water into hydrates.
2.4 Experimental Conversion
Conversion of water into hydrates is calculated from the gas consumption, normally identified by a sudden temperature increase. In order to calculate the conversion, it is assumed that all gas solubilizing into the system after hydrate formation beginning is consumed to form hydrates. Regarding methane hydrate crystallization stoichiometry, it was considered fully occupied cages for hydrates with sI structure; likewise methane hydrates [11]. This means that the number of moles of crystallized water is equal to 5.75 times the number of moles of methane that has been consumed.
The percentage of hydrate volume related to the flow loop liquid volume can be so calculated from the gas consumption. It is presented in the results of this study.
2.5 PVM Images
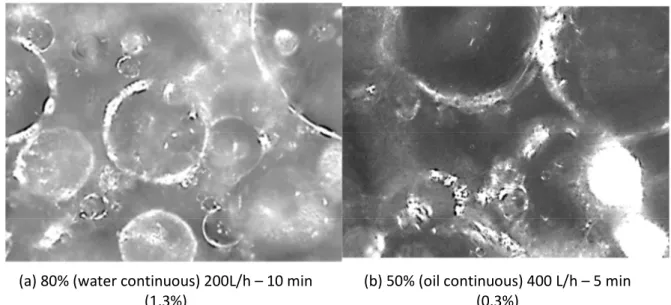
The Particle Video Microscope probe (PVM) is an in-situ particle analyzer provided by Mettler-Toledo Lasentec® [12]. Six independent lasers illuminate a fixed area in front of the probe face. Digital images have size of 1050 x 800 µm, recorded each 40 seconds (+/- 15). The PVM probe allows observing different steps of crystallization, during hydrate formation. The recorded images show shape and size of droplets and hydrate particles, as it can be seen in Figure 2 (a) and (b), respectively. In Figure 2 (b), some droplets are completely converted into hydrates and some hydrates are agglomerated in the image background.
The PVM images (1050 µm x 800 µm) are recorded from emulsification until the end of hydrate crystallization. Oil or water droplets present a well-rounded shape with clear surface on which it is possible to see the six laser beams reflections (Figure 2 (a)). During hydrate formation, texture of droplets surface changes and shape becomes irregular. At hydrate formation beginning, the reflection of the six laser beams is still observed, but it disappears after deep conversion (Figure 2 (b)). The hydrates color is whiter than the liquid.
Unfortunately, the use of anti-agglomerant additive prevents to obtain good PVM images, because smaller droplets are formed and the beam light is largely diffused and backscattered, giving completely white images.
2.6 FBRM measurements
The Focused Beam Reflectance Measurements probe (FBRM) is an in-situ particle analyzer provided by Mettler-Toledo Lasentec® [13]. It consists on an infrared laser with wavelength of 785 nm. The laser is transmitted through optical fiber to the probe tip and emitted from a rotating optical lens into emulsion or suspension. The emitted laser is reflected when it encounters the particle surface. The chord length determination is obtained by the product of the reflectance time (measured by the probe) and the laser scan speed (here 2 m.s-1). It is important to notice that the FBRM measures chord lengths instead of single diameters. For example, a population of
monodisperse and spherical particles of diameter D will give a polydispersed distribution of chord lengths between 0 and D.
(a) (b)
Figure 2 – PVM image from (a) emulsion at 60% water cut and 200L/h without AA-LDHI; and (b) hydrates particles during the experiment at 60% water cut and 200L/h without AA-LDHI.
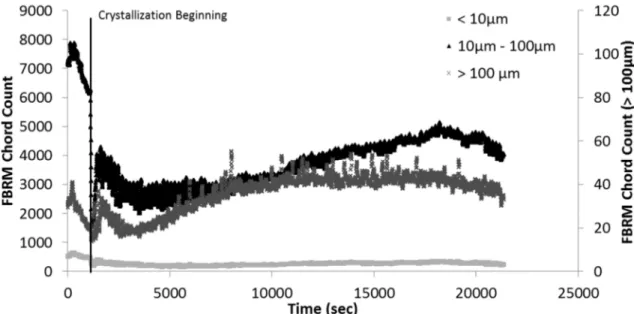
Hydrate formation process was evaluated by recording chord length distributions (expressed in number), measured by the FBRM probe (Figure 3). A more precise analysis can be done by separating chord lengths into three classes: the first one corresponding to chords lower than 10 µm, the second one with chords between 10 µm and 100 µm and the last one with chords measuring more than 100 µm. The quantity of chords in the larger class was very low for all experiments. In Figure 3, this measurement is given in the secondary axis, however, it is not presented in the experimental results and discussion (§3). In Figure 3, the vertical line indicates the crystallization beginning.
Figure 3 – Chord Length Distribution for Experiment at 60% water cut and 200 L.h-1 without AA-LDHI.
3. Experimental Results and Discussion
Methane hydrate formation in a flow-loop was evaluated for different water cuts (90% to 30%) under two different flow rates (200 L.h-1 and 400L.h-1). The analysis provided by the FBRM allowed us to propose a crystallization and agglomeration topological model in §3.1 and §3.2, supported by PVM images, pressure drop and density measurements. The model is firstly detailed for experiments without and with additive (§3.1 and §3.2, respectively). Secondly, the model is validated through experimental results analysis (FBRM, PVM, pressure drop and density) for experiments without (§3.3) and with AA-LDHI (§3.4). The section concerning the experimental analysis for experiments without additive (§3.3) includes also a method to determine the emulsion continuous phase.
The model includes a topological emulsion description, in order to understand the further crystallization process, shape and size of the crystals and agglomerates.
3.1 Emulsion and Hydrate Formation Topological Model – without AA-LDHI
Aiming at understanding the hydrate formation process, the emulsion from which the hydrates will be formed needs to be known. Based on the FBRM results, two models were developed including emulsion and hydrate formation (without free gas phase): the first without anti-agglomerant and the second with anti-agglomerant.
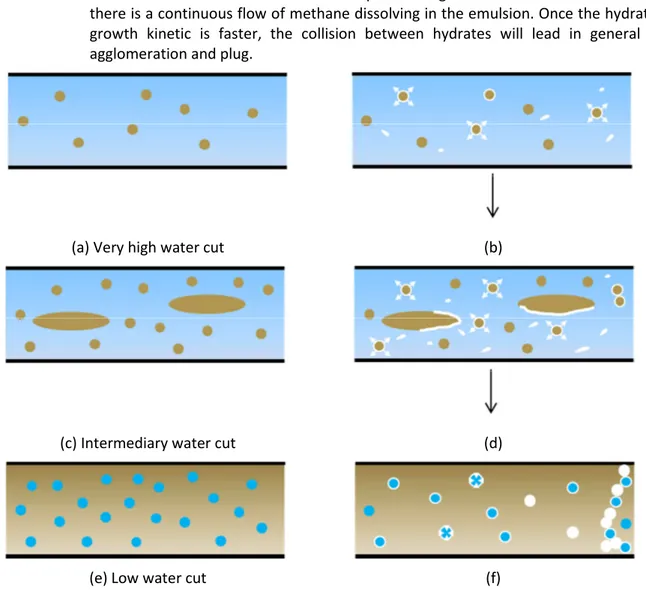
The present section is devoted to introduce the topological model for experiments without anti-agglomerant additive (Figure 4). The model is divided in three cases:
1. High water cut, without additive:
a. Figure 4 (a): emulsion before hydrate formation presents oil droplets well-distributed in the continuous water phase. The average droplet size is stable by varying the flow rate with values around 25 µm.
b. Figure 4 (b): hydrate nucleation and growth develops at the oil/water interface, followed by growth outward the droplets interface. Hydrate can also detach and flow in the continuous water phase.
The driving force of crystallization (especially growth) at constant sub cooling is the methane concentration minus the hydrate equilibrium concentration.
Hydrate formation kinetic is low at high water cuts, mainly because there is a small quantity of oil. In fact, gas/liquid transfer operates mainly on the water side which is the continuous phase; whereas it transfers efficiency is low compared to oil.
After some hydrate growth, oil droplets are completely wrapped by hydrate, and then they are no longer able to contribute to methane feeding. The small contribution of oil droplets as a transfer phase at the gas/liquid interface is completely blocked. Consequently, concentration of gas in water is rapidly consumed by the population of hydrates, and decreases down to its minimum value fixed by the equilibrium concentration. The hydrate gas consumption is then limited by the gas/water transfer rate, which value is low. The growth is not stopped but is low.
Because methane concentration remains low, aggregation is hardly followed by consolidation and agglomeration. Also, in water continuous system, aggregation forces by hydrates themselves are low due to the low value of the Hamaker constant [14–16]. Hydrate plug formation is unlikely.
2. Intermediate water cut, without additive:
a. Figure 4 (c): with increasing oil fraction in emulsion, large packages of oil (which can be considered as free oil phase) are dispersed in water together with smaller oil droplets. In this case, the average droplet size decreases with increasing flow rate. The total chord length number increases, once large oil packages (normally not detected by the FBRM probe) can disrupt into smaller droplets under shear stress effect. In this study, the droplets average size varies from around 30 µm (at low flow rate) to around 25 µm (at high flow rate).
b. Figure 4 (d): hydrate nucleation and growth start at the oil/water interface. Hydrates will grow outward the droplets. These hydrates can also detach from the interface and flow in the water phase. The quantity of hydrates flowing in the water phase is higher because hydrates forming at the interface between water and large oil packages detach more easily. In this case, hydrate formation kinetic is faster due to the higher amount of oil which enhances the gas/liquid transfer.
As before said, when oil droplets are wrapped by hydrate, methane dissolution in oil is blocked. Hydrate growth rate decreases. In the intermediate water cut, the free oil phase remains unwrapped of hydrate (once they are constantly detaching) and acts as an intermediate hydrate crystallizer to
dissolve the methane, nucleate and grow hydrate at its interface and continuously feed the water phase with hydrates.
Because the growth kinetic is faster, the aggregates formed by collision between hydrates can consolidate more efficiently to form agglomerates. Therefore, hydrate plug is likely possible. Hydrate formation can induce emulsion phase inversion.
3. Low water cut, without additive:
a. Figure 4 (e): as the quantity of oil increases, oil becomes the continuous phase with dispersed water droplets. The droplets average size is stable varying flow rate with values around 20 µm.
b. Figure 4 (f): hydrate nucleation and growth develop at the oil/water interface. Growth will occur inward the water droplets. The growth kinetics is faster because there is a continuous flow of methane dissolving in the emulsion. Once the hydrates growth kinetic is faster, the collision between hydrates will lead in general to agglomeration and plug.
(a) Very high water cut (b)
(c) Intermediary water cut (d)
(e) Low water cut (f)
Figure 4 – Emulsion (a – very high water cut, c – intermediary water cut – and e – low water cut) and hydrate crystallization (b – high water cut, d – intermediary water cut – and f – low water cut) model without
AA-LDHI considering Kerdane® and fresh water
3.2 Emulsion and Hydrate Formation Topological Model – with AA-LDHI
This section is devoted to introduce the crystallization topological model for experiments with anti-agglomerant (Figure 5).
This type of system is formed by small water droplets due to the AA-LDHI surfactant properties. As consequence, it will form an emulsion with smaller droplets comparing to experiments without additive. The droplets are dispersed in the oil phase. The smaller droplets will be more efficiently
converted into hydrates and, after conversion, water is unlikely present closely outside these small droplets, and the remaining water inside is not easily accessible for a further crystallization. The hydrates can also be formed at the interface of free water phase, if it exists, and later detach from it. These particles without contact with water are qualified as dry hydrates [17]. The aggregates poorly consolidate into agglomerates, due to the weak availability of water inside and around the formed hydrate particles, even if the system is charged with methane.
The efficiency of the AA-LDHI is linked with the volume of hydrate in the system. It means that the more hydrates are formed; the higher is the dosage to avoid agglomeration. In some cases, if the volume of hydrate formed is high enough to consume all the AA-LDHI, remaining water droplets can destabilize the emulsion. This can be followed by a phase inversion toward a water continuous system.
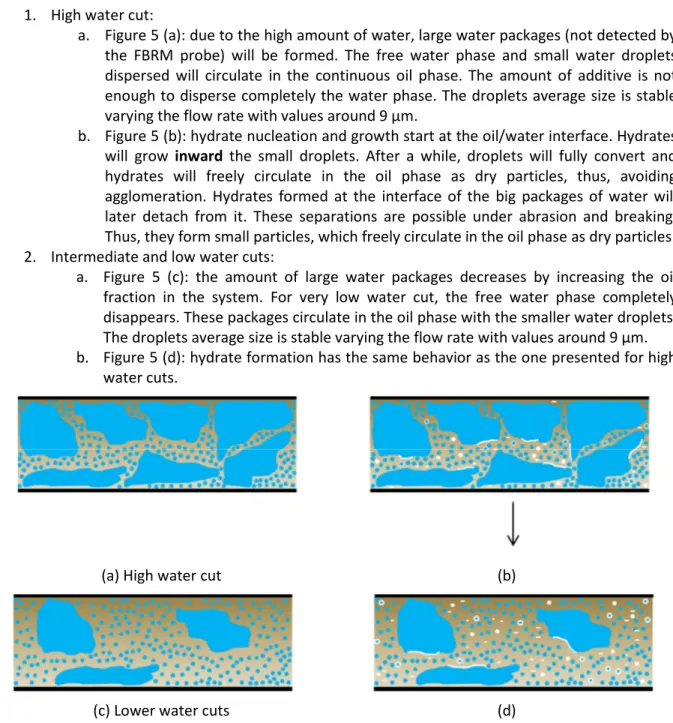
The model is divided in two cases: 1. High water cut:
a. Figure 5 (a): due to the high amount of water, large water packages (not detected by the FBRM probe) will be formed. The free water phase and small water droplets dispersed will circulate in the continuous oil phase. The amount of additive is not enough to disperse completely the water phase. The droplets average size is stable varying the flow rate with values around 9 µm.
b. Figure 5 (b): hydrate nucleation and growth start at the oil/water interface. Hydrates will grow inward the small droplets. After a while, droplets will fully convert and hydrates will freely circulate in the oil phase as dry particles, thus, avoiding agglomeration. Hydrates formed at the interface of the big packages of water will later detach from it. These separations are possible under abrasion and breaking. Thus, they form small particles, which freely circulate in the oil phase as dry particles. 2. Intermediate and low water cuts:
a. Figure 5 (c): the amount of large water packages decreases by increasing the oil fraction in the system. For very low water cut, the free water phase completely disappears. These packages circulate in the oil phase with the smaller water droplets. The droplets average size is stable varying the flow rate with values around 9 µm. b. Figure 5 (d): hydrate formation has the same behavior as the one presented for high
water cuts.
(a) High water cut (b)
(c) Lower water cuts (d)
Figure 5 – Emulsion (a – high water cut – and c – low water cut) and hydrate crystallization (b – high water cut – and d – low water cut) model with under-dosed AA-LDHI considering Kerdane® and fresh water.
3.3 Experimental results for hydrate formation without AA-LDHI
FBRM, PVM and pressure drop measurements were used to develop the explained behavior model (§3.1 and §3.2). In this section, the experimental results obtained during hydrate formation without AA-LDHI will be discussed, sustaining the developed model.
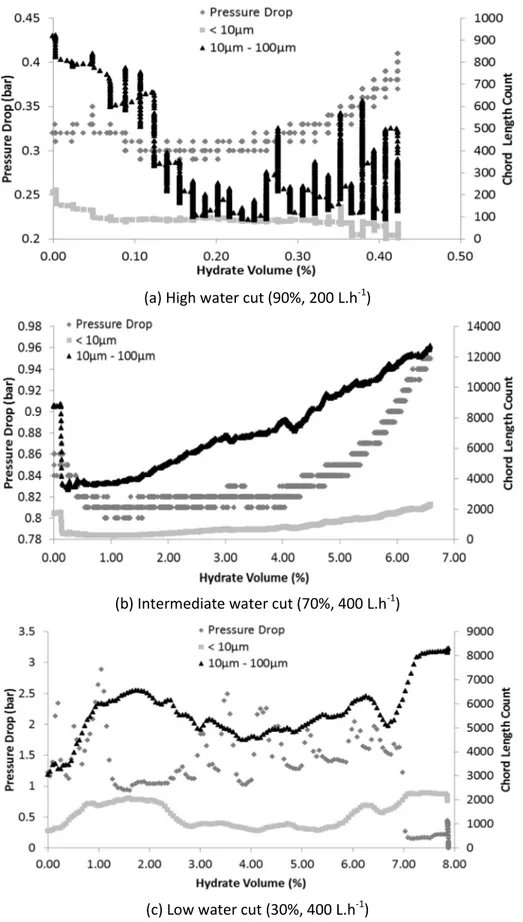
The birth of the first hydrate crystals (nucleation and growth) at the oil/water interface for high and intermediate water cut (Figure 6 (a) and (b)) is characterized by a pressure drop increase, as the chord length number measured by the FBRM decreases (mainly for the intermediary classes between 10 and 100 µm).
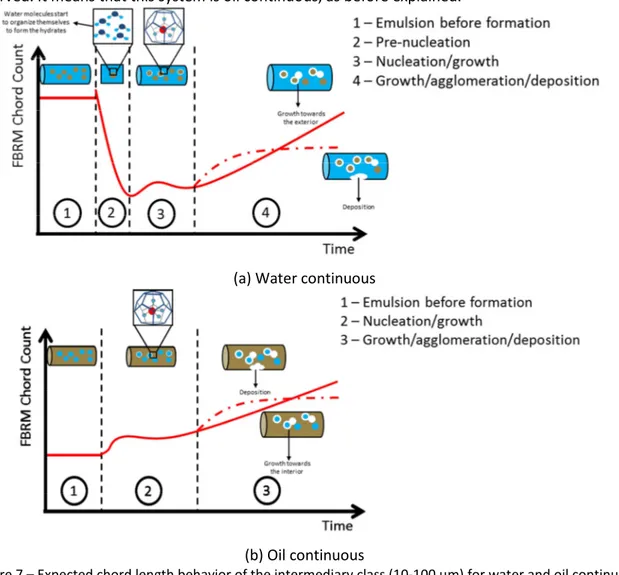
This decrease, only observed at high and intermediate water cut, is used as a method to identify the continuous phase. This is probably a consequence of the water molecules previous organization around the guest molecule [11, 18], in order to form the methane hydrate crystals. This arrangement probably changes the reflective characteristics of the system, changing the measured chord length number by the FBRM Probe. Experiments performed by Turner et al. [19] showed that the number of detected particles by the FBRM depends on the particles reflection; consequently, it is possible to infer that this measure will also be influenced by the reflective characteristics of the system (external phase). In the case that oil is the continuous phase (Figure 6 (c) and Figure 7 (b)); the chord length number does not decrease around the nucleation step, because there is no change in the external phase before methane hydrate formation. For us, it is a new and major advance on the use of FBRM probe to understand the emulsion. In fact, the change or no-change in the number of chord lengths measured around the nucleation step gives the emulsion nature. If the number is decreased, the emulsion is oil in water. On the contrary, if the number remains stable, the emulsion is water in oil.
Concerning high and intermediate water cuts, growth occurs outward the droplets interface (Figure 6 (a) and (b)). Between the end of the initial nucleation and growth until the beginning of some agglomeration, pressure drop is stable. However, the measured chord length number (regarding mainly the intermediary class) presents two different behaviors:
(a) For high water cuts, the measured chord length number remains stable during the growth step, once the majority of the hydrates are growing at the interface of the oil droplets dispersed in the system with slower hydrate growth kinetic.
(b) For intermediate water cuts, the measured chord length number increases during the growth step. It corresponds to hydrates formed at the oil/water interface of the large packages of oil. Once they achieve a critical size, they detach from the oil phase. The detached hydrates will flow in the water phase, being then detected by the FBRM probe. Regarding the evolution of the pressure drop during the agglomeration step, once more, the same behavior is observed for experiments with intermediate and high water cuts, where pressure drop smoothly increases when agglomeration begins.
Concerning the chord length, for high water cuts (Figure 6 (a)), high peaks can be observed (from the beginning of the agglomeration step) for the intermediary class (between 10 µm and 100 µm). The disturbed behavior of the measurement probably corresponds to large hydrates packages passing in front of the FBRM probe. For intermediate water cuts (Figure 6 (b)), the measured chord length number between 10 and 100 µm gradually increases during growth and agglomeration. For the former, it increases because droplets with size between 100 and 10 µm grow outward, and move to the class of particles between 10 to 100 µm, corresponding to the intermediary class. For the latter, it increases due to agglomeration between hydrates formed from the free phase and from the droplets.
Comparing high and intermediate water cuts, plug is more prone to occur at intermediate water cuts due to the increase of oil quantity and consequent enhancement of gas transfer rate, with a higher hydrate growth rate.
(a) High water cut (90%, 200 L.h-1)
(b) Intermediate water cut (70%, 400 L.h-1)
(c) Low water cut (30%, 400 L.h-1)
Figure 6 – FBRM Chord Length and Pressure Drop measurements in function of the volume of hydrates formed (%) for some tests without AA-LDHI.
As mentioned, hydrate formation around small oil droplets will block the methane dissolution in the oil and reduce the gas consumption rate, and finally the growth rate. If oil droplets are large enough to prevent a crust formation, the free oil surface allows the oil droplet to represent a
semi-hydrates at their interface, which will later detach and flow in the water phase. Comparing the volume percentage of hydrates formed, experiments at intermediate water cut generally reach a higher value than then experiments at high water cut (Table 3).
At low water cut (Figure 6 (c)), the appearance of the first hydrate crystals (nucleation and growth) at the oil/water interface rapidly led to growth and agglomeration. In fact, when oil is the continuous phase, methane solubilization is increased. Regarding the pressure drop, it is difficult to distinguish between agglomeration and growth which appear to occur simultaneously. The example shown in Figure 6 (c) has a high agglomeration rate that plugged the pipeline in 10 minutes only. The measured chord length number (Figure 6 (c)) remains stable during the first minutes of the experiment corresponding to nucleation, and then increases rapidly until the pipeline plug, due to high growth and agglomeration rate. Around the nucleation step, it is important to mention that the decrease in the intermediary class (between 10 µm and 100 µm) measured by FBRM was not observed. It means that this system is oil continuous, as before explained.
(a) Water continuous
(b) Oil continuous
Figure 7 – Expected chord length behavior of the intermediary class (10-100 µm) for water and oil continuous without AA-LDHI.
The interpretation of PVM images (Figure 8) requires a detailed and careful analysis by comparison between the cases of water and oil continuous. For both cases, hydrate formation beginning (nucleation and growth) will occur at droplets interface. This step can be visualized by PVM images, when liquid droplets partially converted to hydrates show an irregular surface that is whiter than continuous liquid phase. Also, it is not observed the laser beam reflection that can be observed on liquid droplets. After this, some differences can be pointed out between the two cases:
1. Water continuous (Figure 8 (a)): hydrates nucleate/grow at the water/oil droplets interface, growing outward the droplets. The image of the formed hydrate seems to be whiter, in this case, when comparing to the oil continuous system. Moreover, for this case, the image background is also whiter and partially composed by hydrates detached from the larger oil packages.
2. Oil continuous (Figure 8 (b)): hydrates nucleate/grow at the oil/water droplets interface, growing inward the droplets. Even if it is possible to see the irregularity of the particle due to the hydrate formation, there is no significant change concerning the color, which seems the same of the continuous phase surrounding the formed particles. No agglomeration can be observed in the image, because, at the moment that the picture was recorded, the formed hydrates fraction was low. After plugging, the image is not exploitable.
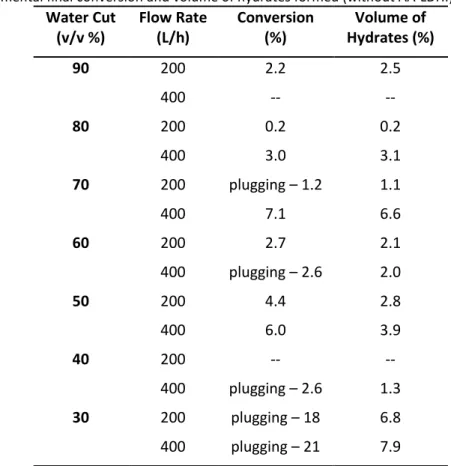
Table 3 – Experimental final conversion and volume of hydrates formed (without AA-LDHI).
Water Cut (v/v %) Flow Rate (L/h) Conversion (%) Volume of Hydrates (%) 90 200 2.2 2.5 400 -- -- 80 200 0.2 0.2 400 3.0 3.1 70 200 plugging – 1.2 1.1 400 7.1 6.6 60 200 2.7 2.1 400 plugging – 2.6 2.0 50 200 4.4 2.8 400 6.0 3.9 40 200 -- -- 400 plugging – 2.6 1.3 30 200 plugging – 18 6.8 400 plugging – 21 7.9
The density measurement, shown in Figure 9, can be used as an indication of hydrate formation beginning (nucleation and growth) for experiments from low to high water cut, as steep decrease followed by steep increase is observed. The steep decrease occurs due to strong gas consumption which depletes the gas concentration in liquid, causing the decrease of the liquid density. The subsequent gas dissolution feeds again the gas concentration and increases the density.
For high and intermediary water cuts (Figure 9 (a)), after the initial decrease, sometimes, the density continues increasing during growth and agglomeration and passes over the initial value. This happens because once methane hydrates (which density is approximately 900 Kg.m-3) are being formed, they encapsulate the oil droplets (the Kerdane® density is approximately 800 Kg.m-3). As consequence of the technology being used in our Coriolis Flowmeter, the Kerdane® stops to contribute for the measured density of the mixture, while the methane hydrate formed increases its contribution to the measurement.
(a) 80% (water continuous) 200L/h – 10 min (1.3%)
(b) 50% (oil continuous) 400 L/h – 5 min (0.3%)
Figure 8 – PVM images (1050 µm x 800 µm) from crystallization varying the water cut and the flow rate at different times after the beginning of crystallization – volume of hydrates formed for the respective time is
reported in each figure.
3.4 Experimental results for hydrate formation with AA-LDHI
FBRM and pressure drop measurements were used alone to develop the crystallization model (§3.2) for hydrate formation with AA-LDHI, without use of PVM probe which, in this case, did not provide good images. In this section, experimental results during hydrate formation with AA-LDHI will be discussed, sustaining the developed model. For the set of experiments performed, the dosage of AA-LDHI will be considered well adapted, which means the following:
1. The emulsion and the suspension (emulsion after hydrate formation) present as the most representative class the smaller one (< 10µm). It is because the anti-agglomerant, also a surfactant agent, reduced the size of the dispersed droplets. Once hydrates mainly grow at the interface of these droplets, this class shall remain the most important in absence of agglomeration.
2. The emulsion is oil continuous allowing the formed hydrates to circulate as dry hydrates. As a consequence, it reduces further agglomeration.
The quantity of additive used has been minimized, intending to observe the anti-agglomerant effect, but also to observe some variations in the system behavior due to hydrate formation and agglomeration: although agglomeration is visible, a plug situation never occurred when the dosage was considered well adapted.
(a) High water cut (80%, 400 L.h-1) (b) Low water cut (40%, 400 L.h-1) Figure 9 – Density and Pressure Drop measurements in function of the volume of hydrates formed (%) for
some tests without AA-LDHI.
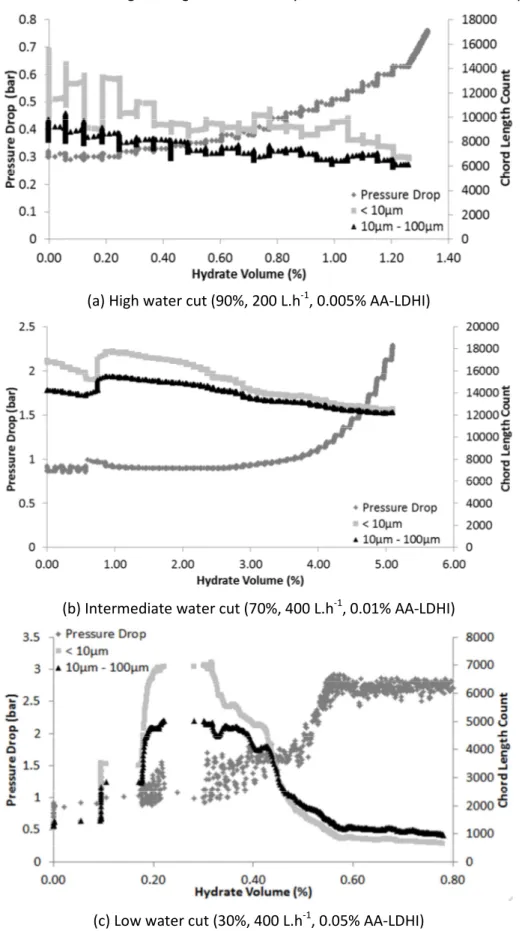
Concerning the FBRM chord length number (Figure 10 and 11), the main difference from the experiments without AA-LDHI (Figure 6 and 7), is that no steep decrease is observed in the hydrate
formation beginning (around the nucleation step), because the system is oil continuous. The solubility of methane in oil is high enough to feed the crystallization without too much depletion.
(a) High water cut (90%, 200 L.h-1, 0.005% AA-LDHI)
(b) Intermediate water cut (70%, 400 L.h-1, 0.01% AA-LDHI)
(c) Low water cut (30%, 400 L.h-1, 0.05% AA-LDHI)
Figure 10 – FBRM Chord Length and Pressure Drop measurements in function of the volume of hydrates formed (%) for some tests with AA-LDHI.
Concerning the pressure drop (Figure 10), the observed behavior is roughly the same as observed without AA-LDHI. Once agglomeration begins, corresponding to a pressure drop smooth increase, the AA-LDHI dosage can no longer be considered sufficient to disperse the formed hydrates. An evidence of growth followed by agglomeration is the decrease of the FBRM chord length number for the smaller class (< 10µm, Figure 10 (a) and (b)) which is sometimes overtaken by the intermediary class (10µm – 100µm), as in Figure 10 (c), meaning that large particles are being formed.
In Figure 10 (c), the pressure drop increase can also be associated to hydrate deposition at the pipeline wall (reducing the pipe flowing section). Once after the pressure drop increase, it becomes stable at a value higher than the initial one. In the same time, the measured chord length number decreases and later becomes stable.
The conversion of water and the volume of hydrates obtained with AA-LDHI are shown in Table 4. These results are smaller comparing with experiments without AA-LDHI (Table 3). Nucleation and growth kinetics are slower, probably because the additive is also a kinetic inhibitor.
Table 4 – Experimental final conversion and volume of hydrates formed (with AA-LDHI).
Water Cut (v/v %) Additive (% vs. w) Flow Rate (L/h) Conversion (%) Volume of Hydrates (%) 90 0.005 200 1.2 1.3 0.005 400 1.0 1.1 80 0.01 200 -- -- 0.01 400 -- -- 70 0.01 200 1.6 1.4 0.01 400 5.6 5.1 60 0.01 200 1.6 1.0 0.01 400 6.5 3.7 50 0.01 200 1.4 0.9 0.01 400 -- -- 40 0.01 200 plugging – 9.5 4.4 0.01 400 plugging – 16.2 7.6 40 0.05 200 -- -- 0.05 400 15.2 8.2 30 0.05 200 18.8 7.6 0.05 400 2.1 0.8
Density measurements with AA-LDHI (Figure 12) can be interpreted similarly to experiments without AA-LDHI, namely about the decrease followed by an increase observed during hydrate formation beginning. For high and intermediate water cuts, the density can be used as an indication to monitor the continuous phase. In fact, the quantity of anti-agglomerant could be enough to keep the oil as a continuous emulsion but not to stabilize it during crystallization. Hydrate formation can destabilize the emulsion and induce a phase inversion. This can be detected by the second steep increase in the measured density when water (with density of approximately 1000 Kg.m-3) becomes the continuous phase. From the density measurement, it seems that the additive can be badly dosed even before the agglomeration beginning (determined from an increase in the pressure drop).
Figure 11 – Expected chord length behavior of the lower class (less than 10µm) for water and oil continuous with AA-LDHI.
(a) Intermediate water cut (70%, 400l/h, 0.01% AA-LDHI) (b) Low water cut (30%, 400l/h, 0.05% AA-LDHI) Figure 12 – Density and Pressure Drop measurements in function of the volume of formed hydrates (%) for
some tests without any AA-LDHI. CONCLUSIONS
Experiments of methane hydrate crystallization under a sub cooling of 6°C performed in this study were mainly analyzed from FBRM, PVM and pressure drop experimental monitoring. Experiments have been performed by varying two parameters: water cut and flow rate, with and without Anti-Agglomerant (LDHI), used here at a very low dose ≤0.05% wt.
A major result of this study is that we can deduce the nature of the emulsion continuous phase from the measured chord length number obtained from the FBRM probe, namely for the intermediary classes (10 to 100 µm) in experiments without AA-LDHI and for the lower classes (less than 10µm) in experiments with AA-LDHI. An insufficient dosage of the additive can also be deduced, what happens when water becomes the continuous phase.
After deducing the continuous phase, models of crystallization for water and oil continuous emulsions have been proposed. Our understanding of the crystallization (nucleation, growth and agglomeration) is mainly oriented towards the description of events at droplets interface. The nucleation sites are the interfaces between water and oil. Growth kinetics is outward oil droplets and inward water droplets.
The transfer rate of gas into liquid and, especially the availability of oil as a transfer phase, to dissolve gas and transfer it to the sites of nucleation and growth (and even agglomeration) were
identified as being the crystallization limiting steps. When oil is entrapped with hydrate, the growth and agglomeration kinetics are slower and can even be stopped.
Agglomeration without AA-LDHI is widely dependent on the phase where hydrates flow. If hydrates flow in water, they will hardly agglomerate and no plug is obtained, meaning that the viscosity of the liquid circulating in the experimental device does not increase significantly. On the contrary, if hydrates flow in oil, agglomeration is faster and stronger and plugging is very likely.
The crystallization model described in this work allows predicting qualitatively the crystallization and agglomeration of methane hydrates in an emulsion of water and Kerdane® varying water cut and flow rate, with and without AA-LDHI.
The AA-LDHI use in mixtures of Kerdane® and unsalted water induces the formation of an oil continuous system, even at high water cut. When hydrates formation occurs, they flow in the oil phase without agglomeration, thus preventing the line plugging.
ACKNOWLEDGEMENTS
Authors would like to acknowledge TOTAL S.A. for the financial support in the framework of the project ARCHIMEDE-3. We also would like to thank the technical support provided by the members of TOTAL and the Gas Hydrate Dynamics Centre team at EMSE which allowed the development of this project, Fabien Chauvy and Alain Lallemand.
REFERENCES
[1]T. Hill, T. Johnson, H.V. Nicol, Steady-state and interrupted production through a deep water black oil system. 7th North American Conference on Multiphase Technology, Canada, 2010. [2]S.V. Joshi, G.A. Grasso, P.G. Lafond, I. Rao, E. Webb, L.E. Zerpa, E.D. Sloan, C.A. Koh, A.K Sum,
Chem. Eng. Sci. 97 (2013) 198–209.
[3]M.A. Clarke, P.R. Bishnoi, Chem. Eng. Sci. 60 (2015) 695–709.
[4]D. Turner, D.M. Kleehammer, K.T. Miller, E.D. Sloan, Formation of hydrate obstructions in pipelines: hydrate particle development and slurry flow. Proceedings of the 5th International Conference on Gas Hydrates, Trondheim, Norway, 2005.
[5]H. Leba, A. Cameirao, J.M. Herri, M. Darbouret, J.L. Peytavy, P. Glenat, Chem. Eng. Sci. 65 (2010) 1185-1200.
[6]D. Greaves, J.A. Boxall, J. Mulligan, A. Montesi, J. Creek, E.D. Sloan, C.A. Koh, Chem. Eng. Sci. 63 (2008) 5410–5419.
[7]J.A. Boxall, C.A. Koh, E.D. Sloan, A.K. Sum, D.T. Wu, Method. Ind. Eng. Chem. 49 (2010) 1412-1418.
[8]A. Fidel-Dufour, F. Gruy, J.M. Herri, Chem. Eng. Sci. 61 (2006) 505–515.
[9]PCM Pompes. Instruction Manual PCM®-MOINEAU. PCM Pompes, Inc., Vannes, France, 2001. [10]A. Melchuna, A. Cameirao, Y. Oubbas, J.M. Herri, P. Glenat, Transport of hydrate slurry at high
water cut. Proceedings of the 8th International Conference of Gas Hydrates, Beijing, China, 2014.
[11]E.D. Sloan, C.A. Koh, Clathrate Hydrates of Natural Gases, CRC Press/Taylor & Francis, 2008. [12]Mettler-Toledo Lasentec® Product Group. PVM® V819 Hardware Manual. Mettler-Toledo
AutoChem, Inc., Redmond, WA, 2011.
[13]Mettler-Toledo Lasentec® Product Group. FBRM® D600 Hardware Manual. Mettler-Toledo AutoChem, Inc., Redmond, WA, 2001.
[14]J.M. Herri, F. Gruy, J.S. Pic, M. Cournil, A.I.Ch.E. Journal 45-3 (1999) 590–602. [15]O. Bonnefoy, F. Gruy, J.M. Herri, Fluid Phase Equilibrium 231-2 (2005) 176–187.
[16]O. Bonnefoy, F. Gruy, J.M. Herri, Materials chemistry and physics 89-2-3 (2005) 336–344. [17]M.A. Kelland, Production Chemicals for the Oil and Gas Industry, CRC Press, 2014. [18]C.P. Ribeiro Jr., P.L.C. Lage, Chem. Eng. Sci. 63 (2008) 2007–2034.