HAL Id: hal-01493976
https://hal.archives-ouvertes.fr/hal-01493976
Submitted on 22 Mar 2017
HAL is a multi-disciplinary open access
archive for the deposit and dissemination of
sci-entific research documents, whether they are
pub-lished or not. The documents may come from
teaching and research institutions in France or
abroad, or from public or private research centers.
L’archive ouverte pluridisciplinaire HAL, est
destinée au dépôt et à la diffusion de documents
scientifiques de niveau recherche, publiés ou non,
émanant des établissements d’enseignement et de
recherche français ou étrangers, des laboratoires
publics ou privés.
Green Techniques for 5G to the General Public
Dinhthuy Phan-Huy, Nadine Malhouroux-Gaffet, Jean Rioult, Yvan Kokar,
Jean-Christophe Prevotet, Alain Le Cornec, Azeddine Cati, Thierry
Sarrebourse, Patrice Pajusco, Maryline Hélard
To cite this version:
Dinhthuy Phan-Huy, Nadine Malhouroux-Gaffet, Jean Rioult, Yvan Kokar, Jean-Christophe Prevotet,
et al.. The Radio Waves Display: an Intuitive Way to Show Green Techniques for 5G to the General
Public. ICC Workshops 2017 : IEEE International Conference on Communications Workshops, May
2017, Paris, France. 7p, �10.1109/ICCW.2017.7962663�. �hal-01493976�
The Radio Waves Display: an Intuitive Way to Show
Green Techniques for 5G to the General Public
D.-T. Phan-Huy
1, N. Malhouroux-Gaffet
1, J. Rioult
2*, Y. Kokar
3, J.-C. Prévotet
3, A. Le Cornec
1, A. Gati
1, T.
Sarrebourse
1, P. Pajusco
4, M. Hélard
3 1Orange Labs, 2Ifsttar, Luxondes *, 3INSA-Rennes, 4Telecom Bretagne, France
{dinhthuy.phanhuy, nadine.malhouroux, alain.lecornec, azeddine.gati, thierry.sarrebourse}@orange.com, jean.rioult@ifsttar.fr, {yvan.kokar, Jean-Christophe.Prevotet, maryline.helard}@insa-rennes.fr, patrice.pajusco@telecom-bretagne.eu
Abstract— In this paper, we present a new and intuitive way
to show important green techniques for the future fifth generation of mobile networks such as adaptive beamforming to the general public. We use a new device called the Radio Waves Display, which is a one meter square panel composed of twenty by twenty radio frequency sensors spaced by five cm. The Electromagnetic Field strength measured by each sensor is converted into visible light. This new device enables a direct visualization of the waves that pass through it, in real time. It enables us to show to the general public, which is naturally more concerned about the energy consumption of devices, that the network energy efficiency as well can be improved. Most of the presented demonstrations have been effectively shown to a general public at the Mobile World Congress 2016 and other events.
Keywords—Green, 5G, massive MIMO, green, visualization, RF, propagation, spatial modulation
I. INTRODUCTION
The importance of the 22nd “Conference Of the Parties” (COP 22) illustrates the concern of the general public for the global energy consumption [1].
This concern is also shared by mobile networks operators, who have recently stated that future 5th Generation (5G) of mobile networks “should support a 1,000 times traffic increase in the next 10 years timeframe, with an energy consumption by the whole network of only half that typically consumed by today’s networks. This leads to the requirement of an energy efficiency increase of x2000 in the next 10 years timeframe” [2].
This colossal challenge requires an enormous research effort of the mobile network industry. Unfortunately, today, the general public only feels concerned by the energy consumption of the device and pushing the industry only in that direction. Indeed, anyone observes and appreciates an improvement in the energy efficiency of his or her last smartphone or device (compared to the previous ones), when using more data greedy applications with an equal or even longer battery life. However, no one is actually aware of when an improvement in the energy efficiency of the mobile network is obtained. As a consequence, the general public has no strong expectations (or even no expectation at all) regarding the improvement of mobile networks in terms of energy efficiency.
One way to educate the general public about this problematic and get more support from it, is to make improvements visible and intuitive. Adaptive beamforming using very large antennas [3], for instance, also known as massive multiple input multiple output (massive MIMO) [4], is one of the key features of 5G to reduce the required transmit power at the base station side, to deliver a given target rate at the device. Even though the best way to translate the beamforming gain into an energy efficiency improvement is still under investigation [5], the beamforming gain is well established.
In this paper, we present a new way to show this beamforming gain, in such an intuitive way that even the general public can understand it and realize that, like devices, mobile networks of the future generation need to be improved in terms of energy efficiency. Thanks to a new device created by Luxondes [6] and called the “Radio Waves Display”, that shows the strength of radio frequency waves which pass through it, in real time and in color scale, we can show the signal generated by an adaptive beamforming prototype.
Fig. 1. The Radio Waves Display created by Luxondes
The paper is organized as follows:
• Section II presents the Radio Waves Display and the adaptive beamforming prototype used for the experimental setups.
• Section III presents several experimental setups and demonstrations showing adaptive beamforming and why it is a promising technique for green networks.
Most of them have been effectively shown to the general public in various events, including at the largest event in the mobile network industry: the Mobile World Congress 2016 in Barcelona.
• Section IV presents several setups and demonstrations to show more advanced concepts on adaptive antennas. • Finally, section V concludes this paper.
II. THE RADIO WAVES DISPLAY AND THE ADAPTIVE BEAMFORMING SCHEME BEING VISUALISED
The Luxondes Radio Waves Display converts radiofrequency signals (between 50 MHz and 3 GHz) into light and directly displays the strength of the Electro-Magnetic-field of a wave which is passing through it. This device is represented in Fig. 1. The 1m x 1m display unit uses 400 (20×20) autonomous identical sensors working as elementary visualization pixels. Elementary antennas are printed directly on each sensor’s Printed Circuit Board (PCB). The Light Emitting diode (LED) output of a receiving chain comprising wideband logarithmic amplifiers and associated detectors controls the output color of a LED centered on each PCB. Using this method, the representation of the electromagnetic field is provided through a gradient of colors. A thermal color scale is used. Optionally, saturation is made visible with the “pale pink” color. According to the measurement to be performed, the receiving chain sensitivity and dynamics can be tuned separately via a control panel. Note that the Radio Waves Display is designed to be as much transparent as possible to waves, i.e. so that it images these waves without modifying their propagation. In particular, the amount of electronics inside is low. As it is not perfectly transparent, and as it is only providing a qualitative assessment of the channel, it is not suitable for propagation channel measurements campaigns such as those performed in [8] for instance. It is a useful complementary tool, that provides in real time, a rough picture of the propagation over one square meter. This helps to rapidly determine the kind of phenomenon which is dominating the radio propagation (direct line-of-sight path, scattering, shadowing etc…) with minimum installation effort.
TABLE I. RADIO WAVES DISPLAY CHARACTERISTICS
Parameter Value
Technology Digital
Panel area 1m²
Number of sensors 400 (20×20)
Sensitivity -60 dBm to 0 dBm (or max
dynamic) Minimal dynamic range 3dB
Bandwidth 50 MHz to 3 GHz
Number of displayed colors 1024
Sensitivity adjustment Min and max threshold
Frequency of display 1 second or Instantaneous MaxHold
Number of color bars 4
Separate color for saturation (pink) On or Off
Weight 30 Kg
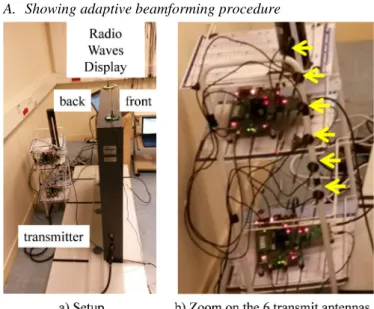
Regarding the source of radio frequency signals, we use a transmitter and a receiver which are mainly based on the implementation described in [9][10]. They use a bandwidth of 40 MHz at 2.4 GHz carrier frequency. Orthogonal Frequency
Division Multiplex (OFDM) Waveform is used. The transmitter (which is intended to represent the base station at the network side) is equipped with 3 to 6 transmit antennas (depending on the setup) and is beamforming towards the receiver. Though it is far from a massive MIMO base station (i.e. with at least 64 antenna elements), this is already sufficient to obtain a beamforming gain that is visible with the Radio Waves Display. The receiver is equipped with a single antenna or multiple antennas, depending on the experimental setup. The adaptive beamforming technique being used is the well-known transmit matched filter, also known as the Time Reversal pre-filter [11]. As illustrated in Fig. 2, Time Reversal focusing is based on two steps:
• During the learning phase, illustrated in Fig. 2-a), the device sends a pilot signal (in the current Figure it is a single pulse), and the base station estimates the channel impulse responses over all its antenna elements.
• During a focusing phase, as illustrated in Fig. 2-c), the time inverses of the channel impulse responses (illustrated in Fig. 2-b) are used as prefilters to transmit a signal from the base station to the device. Spatial focusing is obtained.
Fig. 2. The Time Reversal focusing principle
Note that such prefiltering applied to a single carrier waveform is similar to applying maximum ratio transmission to a multicarrier waveform [12], and that in both cases, spatial
focusing is observed. In our test-bed, a OFDM is used. Hence, the channel is estimated in baseband, in the time-frequency domain, on a per-sub-carrier basis, and the pilot signal is simply a sequence of Binary Phase Shift Keying symbols mapped onto the Time Frequency OFDM grid.
It is well known that the propagation environment strongly impacts the spatial signal resulting of such adaptive beamforming scheme. In a complex propagation environment with scattering, as illustrated in Fig. 3-a), a focused spot with half a wavelength width, in average, and many randomly positioned side lobes with a small width, are obtained. On the contrary, in a line-of-sight propagation environment, as illustrated in Fig. 3-b), a main strong beam with a large beamwidth (compared to the wavelength) and large side beams are obtained (except if tapering is used [13]). Such differences can be easily and instantaneously visualized thanks to the Radio Waves Display.
Fig. 3. The Time Reversal focusing depending on the environment
III. VISUALISATION OF ADAPTIVE BEAMFORMING FOR GREEN NETWORKS
In this section, we present our various experimental set-ups and demonstrations to show the beamforming in line-of-sight to the general public and to visualize how it can advantageously help reducing the network transmit power and energy consumption.
Fig. 4 describes our experimental set-up, the transmitter (representing the network base station) is placed less than 1 meter behind the Radio Waves Display. As the Radio Waves Display is very wide band (it senses everything between 50 MHz to 3 GHz), one needs to put the transmitter quite close to the Radio Waves Display to make sure that the power received at the Radio Waves Display is dominated by the transmitter and not by the ambient interference. The Radio Waves Display
sensitivity is then simply tuned to be higher than the level of the ambient interference.
A. Showing adaptive beamforming procedure
Fig. 4. Experimental setup in indoor
Fig. 5. Showing the beamforming procedure
Fig. 5 describes the demonstration, which is composed of three consecutive phases:
1. During the learning phase (illustrated in Fig. 5-a), we place the receiver at a given position and activate the transmission of a pilot signal from the receiver to the
transmitter. The “transmitter” estimates the propagation channel based on the received pilots; 2. During the focusing phase illustrated by Fig. 5-b), the
transmitter uses the previously determined propagation channel estimate to perform beamforming towards the receiver; the general public can observe the focused spot centered on the receiver.
3. During the last phase, we withdraw the receiver from the Radio Waves Display. As the transmitter keeps on sending data using the same beamformer, the focused spot remains at the same position.
The third and last phase shows that the focused spot is generated by the transmitter and not by the receiver. This demonstrations must be repeated for at least another position of the receiver (as illustrated in Fig. 5-d) to show that beamforming is an adaptive mechanism.
This simple three-step demonstration shows very simply and intuitively how adaptive beamforming works. It also makes easy to understand to the general public that network needs to be intelligent to attain such result, and that the research effort today is not only on the smartphone side.
B. Showing the green property of adaptive beamforming
Another very simple and intuitive demonstration shows why beamforming is a promising technique to improve the energy efficiency of networks.
Fig. 6. Showing green properties
One first needs to explain to the general public that to attain a target data rate or quality of service, a device needs to receive the signal with power level which is strong enough so that it is not mitigated by the ambient noise and interference. A simple way to do this, is to define the red color in Fig. 6 as the required level for good quality of service. The demonstration is then composed of the three following phases:
• During the first phase (illustrated in Fig. 6-a) a simple omni-directionnal source of radio waves is used to show that without beamforming, the target rate or quality of service is delivered everywhere (red is everywhere) and not only where it is really used: there large waste of energy is visible;
• During the second phase, as illustrated in Fig. 6-b, we perform focusing (as explained in section III-A) and show that we reduce the wa ste of energy by radiating a lower amount of energy and bringing it where it is needed;
• During the third phase (illustrated in Fig. 6-c), we perform focusing towards several different spots simultaneously, to show that multiple targets is feasible.
With this simple three-step demonstration, we visualize in a very intuitive way, the waste of energy, and the improvement in energy efficiency brought by adaptive beamforming. Note that, explaining the gain of spatial multiplexing MIMO (in terms of spectral efficiency) to the general public, based on Fig. 6-c), is more tricky, as the concept of spectrum is abstract and not visible with the Radio Waves Display.
C. Showing the limitations of adaptive beamforming
By generating several focusing spots and reducing the separation between spots down to zero, one can show full interference between spots. This simple demonstration illustrated in Fig. 7 shows the limits of the adaptive beamforming and the influence of the wavelength (as the width of the focusing spots depends on the wavelength).
Fig. 7. Showing the limits of spatial multiplexing linked to the wavelength
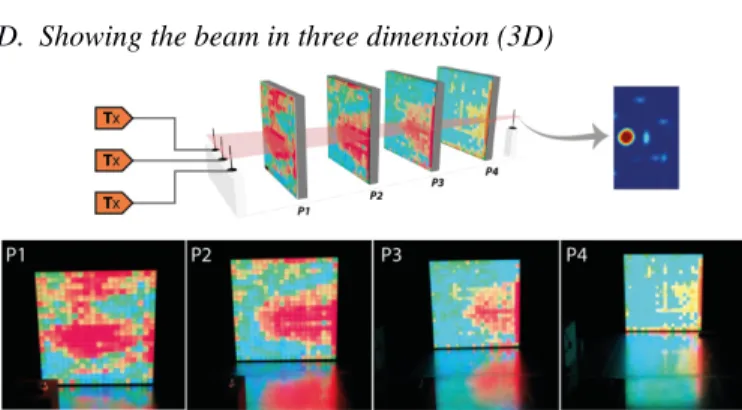
D. Showing the beam in three dimension (3D)
Fig. 8. Showing beam in line-of-sight in 3D by scanning the space in four positions (from the front of the room to the back of the room)
As propagation in line-of-sight is considered, the adaptive beamforming generates a beam with a main direction. To visualize this beam direction, we need to capture several images of the field along the direction of the beam. In Fig. 8, the transmitter is at the front and left corner of the room and is beamforming towards a target at the back and right corner of the room. By increasing the distance between the Radio Waves Display and the transmitter, we observe the beam direction. This method is a bit heavy, as the Radio Waves Display (weighting around 20 kg) is difficult to move.
Alternative solutions using two Radio Waves Displays instead of one enable can be used to observe the beam, instantaneously. In Fig. 9-a) two Radio Waves Displays have
been placed orthogonally to each other and the transmitter has focused towards the intersection. In Fig. 9-b), the transmitter focuses through two consecutive Radio Waves Displays. However, in these two configurations, the impact of the Radio Waves Displays on the wave propagation is stronger than in previous setups. Especially, in the case of Fig. 9-b), where the waves pass through 40 lines of sensors before arriving to the receiver.
Fig. 9. Showing the beam
IV. VISUALISATION OF ADVANCED CONCEPTS
A. Visualization of the ability of time reversal focusing to take advantage of multiple scattering
One important aspect of adaptive beamforming is that it works even in a complex propagation environment and not only in of-sight. Indeed, [14] shows that whereas in line-of-sight condition, Time Reversal generates a large beam, in a complex medium, it takes advantage of multiple scattering and angular diversity to generate a more focused spot. To show this property, we made two different experimental set-ups:
• The “line-of-sight setup”, illustrated in Fig. 10, and similar to the setup described in section III).
• The “cavity setup”, illustrated in Fig. 11, where waves propagate from the transceiver to the receiver between two flat and metaling surfaces, therefore undergoing multiple reflections.
The resulting signals around the receiver, for various positions of the receiver, are visualized with the Radio Waves Display, as illustrated in Fig. 12. One can observe that, even though the Radio Waves Display is not a precise measurement tool, it does visualize the ability of Time Reversal focusing to exploit multi-path propagation and create a tiny main lobe, i.e. a “focused spot”, instead of a large main lobe.
Fig. 10.Line-of-sight setup
Fig. 12. Focusing for the two different setups, for different positions of the receiver (dipole on the picture).
B. Showing an example of new modulation: the Receive Spatial Modulation
With the 5G, new modulations are being studied. One of them is the receive spatial modulation [15][16]. In this communication system, both the transmitter and the receiver have multiple antenna elements. During each symbol, the transmitter focuses over one antenna element among several, using time reversal focusing. The identity number of the target antenna is coding for information (each antenna has an index coded over binary sequence). On the receiver side, the antenna with the strongest signal is detected, the identity of the target antenna is retrieved and the original binary sequence. Initial works in [16] have shown that it enables to get a higher spectral efficiency than with a conventional modulation (in phase and amplitude) of same order, for the particular case of a communication involving time reversal focusing and a very low complexity receiver. This scheme is illustrated in Fig. 13.
Fig. 13. Principle of Receive spatial modulation with four receive antenna elements: the base stations has a set of beamformers (previously determined thanks to a channel estimation phase), and is able to focus towards any of the four antennas of the device. The index of each antenna of the device is coded in binary. By focusing onto a particular antenna, the base station indicates the bits being sent. The device recovers the bits by detecting which antenna is the current focusing target. Note that the RF signal bears a conventional modulation (in phase and amplitude).
Fig. 14 illustrates our experimental setup (detailed in [17]) corresponding to Fig. 13. The receiver has four antennas, and the transmitter is focusing towards one of the four antennas, depending on the binary to be sent. The demonstration, as illustrated in Fig. 15, consists in focusing onto one antenna at a time, and asking the audience to play the role of the spatial modulation detector, i.e. to determine on which antenna the base station is currently focusing, and to demodulate the spatial
modulation symbol by determining the corresponding pair of bits.
Fig. 14.Receive spatial modulation setup, with 4 receive antennas scotched on the front of the Radio Waves Display and the transmitter around 1 meter behind, focusing alternatively towards one of the 4 antennas.
Fig. 15.Receive spatial modulation game: find the detected bits for the four presented configurations
V. CONCLUSION
In this paper, we have presented a new way to show and explain adaptive beamforming to the general public. Thanks to a new Radio Waves Display which shows in color scale the strength of the electromagnetic waves that pass through it, we can visualize beams, focused spots, and also the transmit power reduction that can be obtained from beamforming. Thanks to such experimental demonstrations, we have managed to show to the general public the transmit power reduction of such technique and that network as well (not only devices, with which the general public is more familiar) can be and should be improved in terms of energy efficiency, in many events, including the largest one in the mobile industry: the mobile world congress 2016. Future works will investigate the visualization of other techniques using the Radio Wave
Display, and will also further investigate what are the limitations of this device, and to which extent it can be used.
ACKNOWLEDGMENT
This work is partially supported by the French project SpatialModulation (https://spatmodulation.cms.orange-labs.fr/) under grant number ANR-15-CE25-0016 and the French project TRIMARAN. We would like to thank N. Demassieux who asked us to build a demo allowing the general public to visualize the focusing performed by the prototype of the TRIMARAN project, and funded the realization of the first Radio Wave Display presented in this paper.
REFERENCES
[1] 22th Conference of the Parties (COP22). http://cop22.ma/en/. [2] 5G White Paper” issued by the Next Generation Mobile Networks
(NGMN) Alliance, 17 Feb 2015, available at: https://www.ngmn.org/uploads/media/NGMN_5G_White_Paper_V1_0. pdf.
[3] Yang, H.; Marzetta, T. L. “Performance of conjugate and zero-forcing beamforming in large-scale antenna systems,” IEEE J. Select. Areas Commun., vol. 31, no. 2, pp. 172–179, Feb. 2013.
[4] Jungnickel, V.; Manolakis, K.; Zirwas, W.; Panzner, B.; Braun, V.; Lossow, M.; Sternad, M.; Apelfrojd, R. and Svensson, T. “The role of small cells, coordinated multipoint, and massive MIMO in 5G,” IEEE Communications Magazine, vol. 52, pp. 44–51, May 2014.
[5] Yang, H.; Marzetta, T. L. "Energy Efficient Design of Massive MIMO: How Many Antennas?," in Proc. 2015 IEEE 81st Vehicular Technology Conference (VTC Spring), Glasgow, 2015, pp. 1-5.
[6] http://www.luxondes.com/pdf/luxondes_plaquette_dalle_an.pdf [7] Rioult, J.; Heddebaut, M.; Deniau, V.; Kone, L.; Copin. G.
“Visualisation optique directe de ph_enom_enes de propagation en chambre réverbérante à brassage de mode,” in Proc. 18 ème Colloque International et Exposition sur la Compatibilité Electro-Magnétique (CEM 2016), July 2016, Rennes, France. 4p, 2016. Available at: https://hal.archives-ouvertes.fr/hal-01374211/document
[8] Malhouroux-Gaffet, N.; Pajusco, P.; Burghelea, R.; Leray, C., “Capacity Gain of MIMO Systems with Microstructured Antenna Arrays, “ European Conference on Antennas and Propagation (EUCAP) 2014, 6-11 april 2014, The Hague – The Netherlands.
[9] Prévotet, J.-C.; Kokar, Y.; Hélard, M.; Crussière, M. “Implementation of a Time-Reversal MISO OFDM Test-Bed, “ European Workshop on Testbed based wireless research (ETW), Stockholm, Sweden, 19 november 2014.
[10] Prévotet, J.-C.; Kokar, Y.; Hélard, M.; Cruissière, M. « Implementation of a Time-Reversal MISO OFDM Test-Bed », Wireless World Research Forum (WWRF) 2014, Guildford, UK, 26-28 september 2014.
[11] Lerosey, G.; De Rosny, J.; Tourin, A.; Derode, A.; Montaldo, G.; Fink, M. “Time reversal of electromagnetic waves,” Phys. Rev. Lett., vol. 92, no. 19, May 2004.
[12] Dubois, T.; Hélard, M.; Crussière, M. ; Maaz, I. “Time reversal applied to large MISO-OFDM systems,” in Proc. 2013 IEEE 24th Annual International Symposium on Personal, Indoor, and Mobile Radio Communications (PIMRC), London, 2013, pp. 896-901.
[13] C. Balanis, Antenna Theory: Analysis and Design, 2nd ed. New York: Wiley, 1997.
[14] Derode, A.; Tourin, A.; De Rosny, J.; Tanter, M.; Yon, S.: Fink, M. “Taking Advantage of Multiple Scattering to Communicate with Time-Reversal Antennas,” Phys. Rev. Lett. 90, 014301
[15] Renzo, M. D.; Haas, H.; Ghrayeb, A.; Sugiura, S.; Hanzo, L. “Spatial modulation for generalized MIMO: Challenges, opportunities, and implementation,” in Proc. of the IEEE, vol. 102, pp. 56–103, Jan. 2014. [16] Phan-Huy, D. T.; Hélard, M. “Receive antenna shift keying for time
reversal wireless communications,” in Proc. IEEE Int. Conf. Communications (ICC), pp. 4852–4856, June 2012.
[17] Kokar, Y; Prévotet, J.-C.; Hélard, M. “Receive antenna shift keying modulation tesbed for wireless communication systems,” IEEE Globecom 2016, Washington D.C., Dec. 2016, accepted.