• Aucun résultat trouvé

Coverage and Throughput Analysis at 60 GHz for Indoor WLAN with Indirect Paths

N/A
N/A
Protected

Academic year: 2021

Partager "Coverage and Throughput Analysis at 60 GHz for Indoor WLAN with Indirect Paths"

Copied!
6
0
0

Texte intégral

(1)

HAL Id: hal-01870233

https://hal.archives-ouvertes.fr/hal-01870233

Submitted on 7 Sep 2018

HAL is a multi-disciplinary open access

archive for the deposit and dissemination of

sci-entific research documents, whether they are

pub-lished or not. The documents may come from

teaching and research institutions in France or

abroad, or from public or private research centers.

L’archive ouverte pluridisciplinaire HAL, est

destinée au dépôt et à la diffusion de documents

scientifiques de niveau recherche, publiés ou non,

émanant des établissements d’enseignement et de

recherche français ou étrangers, des laboratoires

publics ou privés.

Coverage and Throughput Analysis at 60 GHz for

Indoor WLAN with Indirect Paths

Marc Kacou, Valery Guillet, Ghaïs El Zein, Gheorghe Zaharia

To cite this version:

Marc Kacou, Valery Guillet, Ghaïs El Zein, Gheorghe Zaharia. Coverage and Throughput

Anal-ysis at 60 GHz for Indoor WLAN with Indirect Paths. 29th IEEE International Symposium on

Personal, Indoor and Mobile Radio Communications (PIMRC 2018), Sep 2018, Bologne, Italy.

�10.1109/pimrc.2018.8580903�. �hal-01870233�

(2)

Coverage and Throughput Analysis at 60 GHz

for Indoor WLAN with Indirect Paths

Marc Kacou, Valéry Guillet

Orange Labs, 1 Rue Louis et Maurice de Broglie, 90000 Belfort, France

{marc.kacou; valery.guillet}@orange.com

Ghaïs El Zein, Gheorghe Zaharia

Univ Rennes, INSA Rennes, CNRS, IETR, UMR 6164, F 35000 Rennes, France

{ghais.el-zein; gheorghe.zaharia}@insa-rennes.fr

Abstract—The 60 GHz frequency band enables the

combination of high bandwidth free of interference and very high throughput WLANs such as 802.11ad, 802.11ay and maybe 5G. Propagation loss in millimeter-wave band may be a strong limitation to deployment and practical usage, in particular in non-line of sight. For this purpose, this paper presents 60 GHz channel sounding and throughput measurement results in an indoor residential environment. The presented results are focused on non-direct multipath characteristics that could be potentially used by smart antenna solution to extend 60 GHz communications in non-line of sight.

Index Terms—60 GHz, indoor propagation, non-direct

paths, path loss.

I. INTRODUCTION

Due to the rapid growth of wireless communications with increasing throughput and bandwidth, the 2.4 and 5 GHz unlicensed spectrum might be congested in a short future. The 60 GHz frequency band has regain strong interest thanks to lower cost of millimeter-wave components and the wide bandwidth available, 59-66 GHz for example in Europe. The new high end smartphones are also expected to embed the current 802.11ad standard.

Millimeter waves are promising for very high throughput WLANs, but there is still a technological issue concerning their ability to ensure non line of sight (NLOS) communications, as shadowing loss due to obstacles like walls, furniture or people might be too high. A lot of works have characterized the effects of the direct path obstruction in line of sight situations (LOS) [1], [2] but fewer works have paid attention to purely non-line of sight propagation [3]-[7]. NLOS results rely on ray model simulation [2], [8], [9] rather than on radio measurements. The IEEE 802.11ad/ay channel models [1] consider for example an obstructed line of sight for a living room scenario resulting in an additional path loss from 8 to 12 dB compared to LOS propagation. Office or lab environments are also mostly considered [2], [3], [6], [7], [9], [10] and more rarely indoor residential [4], [5]. Measurement results reveal for example the very high transmission loss through concrete walls or wooden

materials [7], [11] with up to 15 dB for wooden doors [5], [7].

The advances in smart antenna technologies and Massive MIMO solutions could break this limitation. Such solutions are full part of the future 5G radio and also 802.11ay standard currently under progress. For 802.11ad/ay, transmit and receive beamforming or beam steering enables transmitting and receiving antennas to turn their beam towards the optimal direction in term of link budget.

In this paper, we present a 60 GHz channel sounding measurement campaign performed in a typical home environment. The objective of this work is to assess indirect propagation path level that could be exploited by smart antenna solutions in order to provide NLOS coverage. The rest of this paper is organized as follows: Section II describes the measurement environment and the experimental setup. In Section III, the path loss characteristics and statistical results about indirect paths are analyzed. To complete the analysis, some throughput and coverage results obtained with current 802.11ad products are also presented. Finally, conclusions are drawn in Section IV.

II. EXPERIMENTAL SETUP AND SCENARIO

All the measurements analyzed in this paper have been carried out in a typical multi-room residential environment (6.49 m x 11.7 m x 2.6 m). The channel sounding is based on a vector network analyzer (VNA), extended to 60 GHz using up and down converters developed on our own with standard components. The following paragraphs detail the measurement setup and scenario.

A. Experimental Setup

The measurement system is shown in Fig. 1 and Fig. 2. It is composed of the transmitting (Tx) and receiving (Rx) antennas that are both sectoral vertically polarized horn antennas. The Tx antenna has a 120° 6 dB beam width in both E and H planes (Orange Labs conception), while the Rx antenna is more directive with a 20° aperture (Flann Model 25240-20). Their gain is around 7.3 dBi and 19.5 dBi respectively.

(3)

The VNA measures the S21 parameter over 2048 sub-carriers sequentially with 1 MHz frequency spacing and a 60 GHz starting frequency. Hence, a 2.047 GHz wideband is considered for further multipath analysis. It provides also more accurate average path loss estimations thanks to reduced small-scale fading compared to single carrier measurements. The large maximum delay we are able to measure (1 µs) allows estimating the noise level as measured delays above 100 ns in our environment are nonphysical and correspond only to noise or measurement impairments. The VNA works with an intermediate frequency around 15 GHz. External up and down converters, using standard components such as multipliers, mixer and amplifiers, have been developed and added in order to transpose the signals around the expected frequencies. The 120° Tx antenna is connected to the VNA up/down converter through a 25-meter low loss (12 dB) coaxial cable, while the 20° Rx antenna is connected to the VNA up/down converter via a short cable (2 m). The transmitted power is 13 dBm at the 120° Tx antenna input, and a 20 dB low noise amplifier around 60 GHz is directly used after the 20° Rx antenna. The frequency response of all these components is measured periodically per back to back measurement 2 times per measurement day to correct temperature effects which are then removed from the raw data. Once processed, the obtained data lead to the results presented in Section III.

A laptop commands the VNA and the rotating arm controller for the 20° Rx antenna, by 6° azimuth steps around its axis. It is also used to collect the measured data. The elevation angle of the Rx antenna can be manually adjusted through a 3-way ball joint: we have considered 0°, 10°, 20°, 30° and 40° elevation angles (in direction of the ceiling).

Fig. 1. 20° Rx antenna, 3-way ball joint and rotating arm.

Fig. 2. 120° Tx antenna, up/down converter and VNA.

B. Measurement Scenario

On the transmitter side, one position has been chosen (T1) in the corner of the living room. The Tx antenna height is around 1.97 m, its azimuth points towards the main diagonal of the room without tilt. We have selected this Tx location in order to have most of the room in LOS, and in height for the sake of limiting human shadowing. In a practical home deployment, it is easier to have Ethernet connection near walls or corner walls than under the ceiling center contrary to office or hot spot environments. On the receiver side, 17 positions are chosen inside the apartment and 4 outside in a nearby corridor but with a strong load bearing wall separation with a closed wooden door. The Rx antenna height is equal to 1.31 m for all the 21 Rx positions. All measurements have been made in an empty environment (no people), with typical furniture (tables, chairs, TV screens, kitchen equipment, wooden cabinets) and closed wooden doors. Fig. 3 displays the Tx and Rx locations as well as the various building materials (doors, plasterboard, and concrete walls in dashed lines). Fig. 4 displays an example of measurement result in NLOS (precisely at R2, in Fig. 3) with a direct path level 10 dB lower than other non-direct paths coming from the living room. The azimuths 0° and 180° correspond respectively to the South and North.

III. CHANNEL SOUNDING RESULTS

The measurements have been processed in order to compare the path loss of the direct and indirect paths. The results are detailed in the following paragraphs. Some 802.11ad throughput measurements are also presented to complete the analysis.

(4)

Tx position Rx position 6.49m 11.7m E N Table Cabinet Sofa T1 R2

Fig. 3. Floor plan and measurement locations.

Fig. 4. Example of spatio-temporal results (at R2).

A. Path Loss Modeling

Based on the Tx and Rx locations, the direction (in terms of azimuth and elevation angles) of the direct path between the Tx and a given Rx can be computed. Then, the average path loss (over the 2.047 GHz bandwidth) corresponding to this direction can be extracted from the measurements. As the direct path is not necessarily the optimal pointing direction in NLOS, we have also searched for another direction corresponding to the highest maximum of received power in function of azimuth and elevation of the Rx antenna. Then, for each Rx location, we have compared the path loss values of these directions. A path loss model over distance [1], described by the following formula, has been also adjusted:

PL(d) [dB] = PL0(d0) + 10nlog10(d/d0) + X (1)

where PL(d) is the path loss value at a Tx-Rx distance equals to d, PL0(d0) is the path loss at a

reference distance d0 (here d0 = 1 m), n is the path loss

exponent that depends on the environment and characterizes the increase of the path loss with distance.

X reflects the other variations of the path loss caused

by shadowing effects and multi-path propagation. It is a

zero-mean Gaussian random variable with  dB

standard deviation. The parameters of this model (Table I), which takes into account the Tx and Rx antennas gain, are obtained by performing linear regressions between the measured path loss and the log-distance for the various cases. Fig. 5 displays the free space path loss (reference) and the established log-distance path loss models in LOS and NLOS. Table I gives the model parameters PL0(d0), n, and defined above. In LOS,

we get 10 to 26 dB and 16.4 dB average additional path loss for the best non-direct path compared to direct path loss. This is a bit higher than predicted by the 802.11ad living room channel model (8 to 12 dB, [1]). This difference tends to decrease a lot with increasing d. In NLOS, we get an average around 32.4 dB additional path loss compared to free space for the direct path. A detailed analysis of the angular power spectrums shows that the direct path is not in most cases the best one excepted when the direct path crosses only one plasterboard dividing wall (without any blocking furniture). Compared to the direct path direction, in NLOS, the best Rx antenna orientation towards non direct paths can benefit from 3 to 17 dB higher received power and 5 dB on average (discarding 2 Rx points outside the Tx antenna main lobe).

The NLOS results show a very high shadowing standard deviation and so, that a log-distance path loss model is not very accurate. Table II gives more details on the average transmission loss induced by the crossed walls, doors or furniture along the direct path.

The RMS delay spread has been also computed for the impulse responses (Figs. 6 and 7) associated to both Rx antenna orientations: towards Tx in direct line or towards the best non-direct path. A 20 dB dynamic has been considered between the maximum level of the impulse response and the noise floor to compute the RMS delay spread. A Hanning window has been applied in the frequency domain to reduce the side lobes level. Fig. 6 displays the RMS delay spread in function of the path loss and reveals increasing delay spread with increasing path loss in NLOS. In LOS, the RMS delay spread stays below 4 ns versus 15.8 ns in NLOS. An 802.11ad single carrier solution uses 1.76 Gsym/s and thus may suffer from high inter-symbol interference especially in NLOS, as the 802.11ad standard allows equalization up to 36 ns channel delay based on the guard interval duration for channel estimation. Much narrower antenna beams than the ones of the used antennas would be needed to reduce the delay spread in NLOS, for single carrier 60 GHz or OFDM physical layer, would have to be privileged for NLOS.

(5)

1 2 3 4 5 6 7 30 40 50 60 70 80 90 100 110 Distance (m) P a th lo ss ( d B ) free space LOS direct LOS best indirect LOS direct (meas) LOS best indirect (meas) NLOS direct NLOS best indirect NLOS direct (meas) NLOS best indirect (meas)

Fig. 5. 802.11ad path loss in LOS and NLOS.

TABLE I. PARAMETERS OF THE PROPOSED PATH LOSS MODELS

Model PL0(dB) n (dB)

LOS – direct path 40.85 1.35 3.29 LOS – best non-direct path 64.68 -0.62 4.82 NLOS – direct path 69.15 2.64 13.49 NLOS – best non-direct path 67.1 2.36 9.01

TABLEII.TRANSMISSION LOSS FOR SOME OBSTACLES

Material Thickness (cm) Transmission Loss (dB)

plasterboard 7 9.8 concrete 24 40.8 wooden door 4 32.2 wooden cabinet + plasterboard 47+7 49.6 30 40 50 60 70 80 90 100 110 0 2 4 6 8 10 12 14 16 Path Loss (dB) RMS d elay sp read (ns)

LOS - direct path LOS - best indirect path NLOS - direct path NLOS - best indirect path

Fig. 6. RMS delay spread versus path loss.

0 2 4 6 8 10 12 14 16 0 2 4 6 8 10 12 14 16

RMS delay spread - direct path (ns)

RMS d elay sp read - best indir ect p ath (ns) LOS NLOS

Fig. 7. RMS delay spread of the direct path versus the best indirect path.

B. 802.11ad Throughput Measurements

To complete the analysis, two devices have been equipped with Qualcomm 802.11ad mini PCIe cards, based on the Sparrow chipset, working on a single 802.11ad channel. The first one is an access point (AP), and the other one is a laptop acting as client device. This commercial solution relies on a single carrier modulation with Tx and Rx beamforming, mainly in the azimuth plane. A 12 printed elements rectangular antenna array (17 mm x 7 mm surface) has been used at both Tx and Rx sides. The EIRP was estimated around 26 dBm. Fig. 8 and Fig. 9 display respectively an example of coverage area and the 30 s averaged measured TCP throughputs (with iperf tool) between the AP (located at 1.86 m height, with 5 AP positions considered in the apartment) and the client device (at 1.2 m height) without any people presence. 8 azimuth angles of the client device have been tested, by 45° step, and the minimum, maximum and average throughput values have been extracted. In the living room, the throughput in LOS varies between 1.6 and 2.5 Gbps. In NLOS, as shown in Fig. 9, the throughput varies between 0 and 1.6 Gbps. No communication was possible in NLOS with a concrete wall or with plasterboard and blocking wooden cabinet crossing the direct path. In LOS, the system proved also quite good robustness in the random presence of up to 4 people, with a throughput generally greater than 1 Gbps. In NLOS, however it was no more possible to guarantee communications in the presence of people.

Tx position Rx position Coverage area Wooden cabinet

Fig. 8. Example of 802.11ad coverage area (no people).

(6)

Fig. 9. 802.11ad TCP throughput in NLOS.

Based on our path loss measurements, we can infer that the tested 802.11ad equipment allows around 65-70 dB of path loss. In the case of blockage by a load bearing wall or by a wooden cabinet close to a plasterboard dividing wall, at least 25 dB are missing in the link budget to maintain communications. We expect the future 802.11ay standard improving NLOS coverage in the nearby rooms surrounding the AP as multiple antenna arrays (like Massive MIMO) would have a great benefit on the link budget. For example, 256 elements antenna array for both AP and client device would provide in theory 26.5 dB more antenna gain compared to the 12 elements antenna array tested Qualcomm equipment, but would require approximately a 25 cm² surface for planar antenna arrays. This may be sufficient to get more robust NLOS communications, at least for the less stringent blockage configurations such as one plasterboard diving wall with wooden furniture or one plasterboard dividing wall with moving people.

IV. CONCLUSION

Herein we studied NLOS 60 GHz radio coverage based on radio and throughput measurements. In indoor residential environment, we showed that the non-direct paths have a significant level and could be exploited to extend mm-wave communications in the neighboring rooms around the access point. Future solutions like 802.11ay Massive MIMO seem well suited to improve the link budget in NLOS. Further works and measurements in various environments are needed to have more statistical results.

ACKNOWLEDGMENT

This work was supported by the French project FUI22 OptimiSME, the French BPI, Région Bretagne and Rennes Métropole. We thank also Qualcomm for providing the 802.11ad equipment for throughput measurements.

REFERENCES

[1] A. Maltsev, “Channel Models for IEEE 802.11ay”, IEEE 802.11-15/1150r9, Mars 2017

[2] Z. Genc, U. H. Rizvi, E. Onur and I. Niemegeers, "Robust 60 GHz Indoor Connectivity: Is It Possible with Reflections?," 2010 IEEE 71st Vehicular Technology

Conference, Taipei, Taiwan, 2010, pp. 1-5.

[3] H. Sawada, K. Yaginuma, M. Umehira, K. Sato, S. Kato and H. Harada, "Non-line-of-sight propagation measurements at 60GHz for millimeter-waves WPAN,"

2008 Asia-Pacific Microwave Conference, Macau, 2008,

pp. 1-4.

[4] S. Collonge, G. Zaharia and G. El Zein, "Experimental investigation of the spatial and temporal characteristics of the 60 GHz radio propagation within residential environments," Signals, Circuits and Systems, 2003. SCS

2003. International Symposium on, 2003, pp. 417-420

vol. 2.

[5] V. Guillet, "Narrowband and wideband characteristics of 60 GHz radio propagation in residential environment," in

Electronics Letters, vol. 37, no. 21, pp. 1310-1311, 11

Oct 2001.

[6] S. Deng, M. K. Samimi and T. S. Rappaport, "28 GHz and 73 GHz millimeter-wave indoor propagation measurements and path loss models," 2015 IEEE

International Conference on Communication Workshop (ICCW), London, 2015, pp. 1244-1250.

[7] N. Moraitis and P. Constantinou, "Indoor channel measurements and characterization at 60 GHz for wireless local area network applications," in IEEE

Transactions on Antennas and Propagation, vol. 52, no.

12, pp. 3180-3189, Dec. 2004

[8] L. Chaigneaud, V. Guillet and R. Vauzelle, "A 3D ray-tracing tool for broadband wireless systems," IEEE 54th

Vehicular Technology Conference. VTC Fall 2001. Proceedings (Cat. No.01CH37211), Atlantic City, NJ,

2001, pp. 2043-2047 vol.4

[9] A. A. Al Abdullah, N. Ali, H. Obeidat, R. A. Abd-Alhmeed and S. Jones, "Indoor milli metre-wave propagation channel simulations at 28, 39, 60 and 73 GHz for 5G wireless networks," 2017 Internet

Technologies and Applications (ITA), Wrexham, 2017,

pp. 235-239

[10] T. S. Rappaport, Y. Xing, G. R. MacCartney, A. F. Molisch, E. Mellios, J. Zhang, "Overview of Millimeter Wave Communications for Fifth-Generation (5G) Wireless Networks – With a Focus on Propagation Models", IEEE Transactions on Antennas and

Propagation, vol. 65, no. 12, pp. 6213-6230, Dec. 2017

[11] I. A. Hemadeh, K. Satyanarayana, M. Ek-Hajjar, K. Hanzon "Millemeter-Wave Communications: Physical Channel Models, Design Considerations, Antenna Constructions, and Link-Budget", IEEE Communications

Surveys and Tutorials, vol. 20, no. 2, Second Quarter

Figure

Fig. 1.  20° Rx antenna, 3-way ball joint and rotating arm.
Fig. 3.  Floor plan and measurement locations.
Fig. 7.  RMS delay spread of the direct path versus the best indirect  path.
Fig. 9.  802.11ad TCP throughput in NLOS.

Références

Documents relatifs

En 2013, l'humidité est telle que la condensation n'est plus seulement capillaire, mais en surface : les températures mesurées par le capteur 11 sont plus faibles que

Walking Paths to and from a Goal Differ: On the Role of Bearing Angle in the Formation of Human Locomotion Paths.. Manish Sreenivasa 1 * ¤a , Katja Mombaur 1 , Jean-Paul

The aim of this section is to establish the theoretical proba- bility distribution of the delays between arrivals in the impulse response of the 60Ghz channel and hence justify

In plasma physics, learning Debye shielding and Landau damping from a fundamental point of view traditionally implies following a hard path through the use of fluid and kinetic

the advantage of microstrip patch antenna make them popular in many applications requiring a low profile and lightweight antenna, microstrip patch antennas have

In the classic plenter forest, the point of no return for recruitment, as far as shelterwood is concerned and therefore standing volume conservation, can be illustrated by the graph

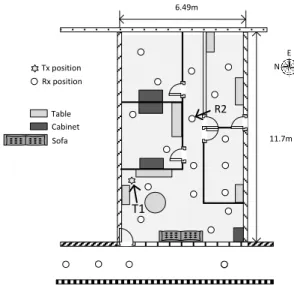
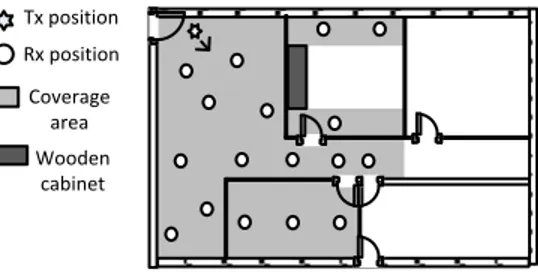
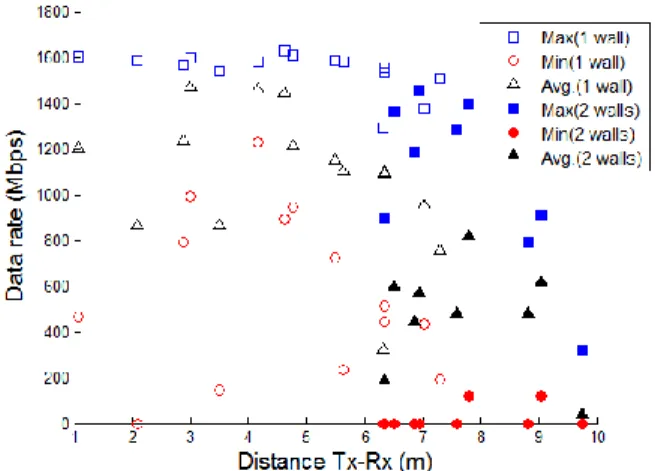
From the characterization study of the indoor radio propagation, several recommendations concerning the deployment of the very high data rate 60 GHz wireless networks are derived..

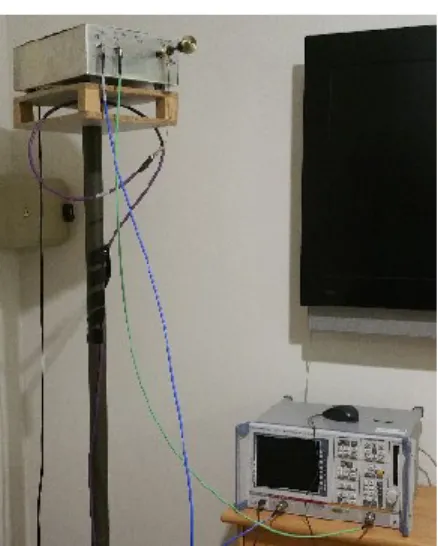
During the last decade, several research activities were carried out at IETR in the 60 GHz bandwidth: the realization of the channel sounder, the indoor radio channel