HAL Id: hal-03183758
https://hal.archives-ouvertes.fr/hal-03183758
Submitted on 30 Mar 2021HAL is a multi-disciplinary open access archive for the deposit and dissemination of sci-entific research documents, whether they are pub-lished or not. The documents may come from teaching and research institutions in France or abroad, or from public or private research centers.
L’archive ouverte pluridisciplinaire HAL, est destinée au dépôt et à la diffusion de documents scientifiques de niveau recherche, publiés ou non, émanant des établissements d’enseignement et de recherche français ou étrangers, des laboratoires publics ou privés.
DOI: xxx/xxxx
ARTICLE TYPE
Measuring coarse grain deformation by digital image correlation
Claire Silvani*
1| Julien Réthoré
2| Sylvie Nicaise
31Univ. Lyon, INSA-Lyon, GEOMAS, 69621, Villeurbanne cedex, France 2Research Institute in Civil Engineering and
Mechanics, Centrale Nantes, Université de Nantes, CNRS, UMR 6183, France 3RECOVER, IRSTEA, 3275, route de
Cézanne, CS 40061,13182 Aix-en-Provence cedex 5, France
Correspondence
*Claire Silvani, Univ. Lyon, INSA-Lyon, GEOMAS, F-69621, Villeurbanne cedex. Email: [email protected]
Present Address
69621, Villeurbanne cedex, France
Abstract
This work presents results from oedometric compression of coarse granular mate-rial. Coarse granular media exhibit significant deformations making it complicated to predict the settlement of structures. In this paper, a measurement technique was developed for the analysis of two-dimensional (2D) images of a deforming coarse granular medium to investigate its deformation. This was achieved by realizing grain-based image correlation to measure the grain transformation in gravel with the use of a Digital Image Correlation technique. The 2D displacement fields enable us to explore the behavior of granular media at different scales: microscopic, mesoscopic, and macroscopic scales. The mesoscopic scale is defined from branches that connect the centers of three neighboring grains, using a Delaunay triangulation to account for an equivalent continuum media. While the consistency of the macroscopic strain and the average mesoscopic strain is assessed, it is shown that a deviation from the normalized microscopic vertical displacement is an indicator of the heterogeneity of the mesoscopic strain field. The proposed mesoscopic analysis allows us to investi-gate these heterogeneities. Another important result is that even if the amplitude of the microscopic strain is small (approximately 100 times smaller) compared with the other strain measures, it confirms that the grains are not rigid and that their ultimate strain can be estimated using the proposed approach.
KEYWORDS:
coarse granular materials; DIC; oedometric compression; mesoscopic scale; strain.
1
INTRODUCTION
This study focuses on the behavior of coarse granular media under compression. Rockfill media are coarse media composed of quarry rock debris or crushed rock fragments with a characteristic size of up to 1 m. This kind of medium is used in various civil engineering works, such as roads, retaining walls, railway engineering works, and in a large number of embankment dams for the coarsest material.
The mechanical behavior of granular materials is complex essentially due to their discrete nature. To improve our knowl-edge of granular media it is necessary to understand the evolution of the internal state of this heterogeneous material. Here, experimental work was conducted to offer insights into the strain behavior of granular media. Many authors have explored the strain behavior of granular material via theoretical, numerical, and experimental approaches (Satake, 1992 [28], Kruyt and Rothenburg, 1996 [12], 2016 [15], 2018 [13], Kruyt 2003 [14], Bagi, 1996 [4], Kuhn, 1999 [16], Cambou et al., 2000 [6], Kuhn and Daouadji 1999 [17] for example for theoretical and numerical approaches). for example, for theoretical and numerical approaches). Furthermore, extensive experimental work has been performed to study the kinematics mostly of shear
2014 [33]) to explain macroscopic strain.
Concerning the theoretical works, the micro-mechanical formulation of the stress tensor has been well established for a long time, whereas the corresponding formulation for the strain tensor has proved to be much more evasive and is the subject of much discussion (Duràn et al., 2010 [9]). To improve the models, some authors have introduced an intermediate scale, called “the mesoscale,” at which strain can be defined using the tools of continuum mechanics (Bagi, 2006 [5]). Establishing a link between particle- level displacements and macro-level deformations is important for researchers who intend to develop micro-mechanically based constitutive theories (Nicot and Darve 2011 [21], Chaze and Cambou 2014 [7], Xiong et al. 2017 [37]). Such an intermediate local scale is expected to allow the local structure of granular materials to be more precisely described. Hence, micro-mechanical models embedding both microscale and mesoscale can usually describe a variety of constitutive features in a natural way.
The aim of the present study is to contribute to the theoretical and numerical works on the introduction of an intermediate scale for representing macro strain. To do so, an experimental study is carried out, based on the development of a DIC tool to extract the evolution of key properties directly from the grain-scale mechanics of granular media under oedometric com-pression. The objective is to measure the displacement of each individual grain and then to compute mesoscopic strain from grain displacements. As theoretical and numerical approaches, we introduce this intermediate scale to link grain motion to the macroscopic deformation of the media. To our knowledge, there are few experimental data avalaible on this topic (Houda et al., 2016 [11]), ]), with most papers focusing mainly on discrete element simulations (Nguyen et al., 2009 [19], 2012 [18] and 2016 [20], Zhu et al., 2016 [38] and 2017 [39]), since they represent solutions that are more affordable to implement.
A series of experiments on gravel are conducted in this work. The first sections of this paper describe the experimental set-up and materials, the DIC technique, and the developments. The following sections examine the results of the experiments through different scales (macro-, micro-, and mesoscales) and conclude with a comparison between these different scales and the possible relationships between them.
2
EQUIPMENT, MATERIALS, AND METHODS
2.1
Experimental set-up and materials
The study of coarse granular materials requires suitable laboratory facilities whose dimension must be in proportion to the maximum size of the grains. To this end, oedometric tests are performed. The oedometric cell used here was developed by the IRSTEA laboratory in Aix-en-Provence (France) and has a square surface of 30 cm x30 cm and is 40 cm high. Some of the cell walls are in Plexiglas (Figure 1), to guarantee the optic accessibility of surfaces. Only the upper part of one face of the box is transparent; the bottom is opaque. DIC is then used to measure the grain displacements in 2D on the projected surface of the grains.
Stress is applied via a loading plate attached to a frame that is connected to a hydraulic cylinder to impose the load. The frame used to impose the load does not allow for the use of a single camera to follow the whole upper part (see Figure 2). Therefore, two cameras are used to follow the whole upper part, and each camera points toward half of the upper part (Figure 2). Lighting of the surfaces of interest is made with LED or with more diffuse ligthing.
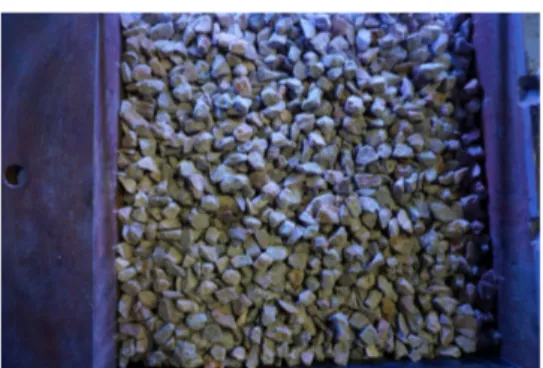
whose diameters 𝐷 range between 6 mm and 12 mm. Grains are dropped off randomly into the cell. Granulometry was per-formed before and after the tests. The principal characteristics of the material are summed up in Table 1. Several of the tests performed have the same initial granulometry charateristics (Figure 4).
FIGURE 1 Experimental devices: two cameras follow a quarter of the sample each (only the upper part of the cell is transparent).
FIGURE 2 Principle of field measures with the oedometric cell using DIC (top view of the experiment). Each camera follows
a quarter of the sample, with only the upper part of the cell being transparent.
Cameras with ultra-high resolution (29 megapixels) are used to analyze precisely the grain field. Pictures were taken every 60 s.
Tests with imposing load velocity ̇𝐹 are performed (2 kN/min or 26 kPa/min). The displacement of the loading plate is mon-itored via a linear variable differential transformer (LVDT) sensor. Parts of the Plexiglas walls were sometimes damaged by the material, and scratches appeared that made DIC difficult, if not impossible. Thin sheets of removable Plexiglas were then placed behind the thicker Plexiglas cell walls so that several experiments could be performed.
FIGURE 3 Gravel with 6 mm < D < 12 mm. Ain limestone Maximum Diameter D𝑚𝑎𝑥(mm) 12 Ratio L/D𝑚𝑎𝑥 26 Density (kg/m3) 2700 Average weight/test (kg) 39 L=Initial Sample height (mm) 317
TABLE 1 Main characteristics of the material and initial cell height.
FIGURE 4 Typical initial granulometry for the gravel tests.
2.2
Digital image correlation
In the past decade, image correlation techniques have gained attention in experimental geomechanics. Today, the use of this technique, which was introduced approximately 30 years ago by Peters and Sutton (Peters et al., 1982 [23], Sutton et al., 1983 [30]), is widespread. Image-based analysis methods are widely used in particulate media in several laboratory investigations in the field of geomechanics: cone penetration testing (e.g, Paniagua et al. 2013 [22], Arshad et al. 2014 [3]), load transfer in granular platforms supported by piles in soft soil (Houda et al. 2016 [11]), and fluctuations in shear tests (Richefeu et al., 2012 [26]).
that the surface texture (gray-level distribution) does not change during the test. Let us call 𝑓 the reference image and 𝑔 the deformed image, 𝑢 the displacement field, 𝑥 the pixel coordinates in the reference image frame, and 𝑥∗= 𝑥 + 𝑢(𝑥) the advected coordinates of these pixels in the deformed image. It is possible to write (Equation (1)):
𝑓(𝑥) = 𝑔(𝑥 + 𝑢(𝑥)) = 𝑔(𝑥∗) (1)
Usually, it is necessary to apply a speckle on the object studied to make the machting between 𝑓 and 𝑔 easier. In our case, the color gradation of the granular media enables us to work without applying a speckle pattern. We used the software UFreckles, described in Réthoré 2018 [27]. All the DIC parameters are summarized in Appendix B.
We consider only 2D displacements (vertical and horizontal). We disregarded the out-of-plane component of the displacement, since grains were placed behind the window, and the media is very constrained in such an oedometric compression test. To solve the ill-posed problem (Equation 1), the reference image 𝑓 is cut into small zones Ω, and attached to each individual grain. Since hundreds of grains are considered, it is not possible to define these zones with a manual grain contour capture. However, the center of each grain is picked up manually (see Figure 5). From this set of points (assumed to be the center of the particles), a Delaunay triangulation is derived (see Figure 6). Voronoi cells are then computed from this triangulation and each analyzed grain surface Ω is defined as a scaling of its Voronoi cell (Figure 6). The displacement of each individual grain is then searched for as an affine transformation (constant strain and rigid body motion), meaning that for each grain a full micro strain tensor (later referred to as 𝜖𝑚𝑖𝑐𝑟𝑜) is obtained as well as a rigid translation vector (𝑈𝑥, 𝑈𝑦) and an in-plane rotation 𝜔.
FIGURE 5 Methodology for the image processing: identification of the grain center.
From this assumtion, the discretized displacement field 𝑣 over the grain surface Ω reads as (2):
𝑣(𝑥) =∑
𝑘∈N
𝑣𝑘𝑁𝑘(𝑥) (2)
whereN is the set of degrees of freedom, and 𝑁𝑘the basis functions of the considered displacement description. The basis
functions can be any basis of a linear function of the pixel coordinates. The corresponding degrees of freedom 𝑣𝑘are related to 𝜖𝑚𝑖𝑐𝑟𝑜, (𝑈𝑥, 𝑈𝑦) and 𝜔 which are thus obtained independently for each grain. To find the transformation of each zone Ω, the goal is to obtain the best approximation 𝑣 of the field displacement 𝑢. This consists in the resolution of an inverse problem. The best solution 𝑣 is the one that minimizes the 𝜑𝑐𝑜𝑟function as defined in Equation (4).
𝑣(𝑥) = 𝐴𝑟𝑔𝑀𝑖𝑛(𝜑𝑐𝑜𝑟2) (3)
𝜑𝑐𝑜𝑟2= ∫ ∫
Ω
FIGURE 6 Methodology for image processing: definition of grain area (dark gray) as a scaling of the Voronoi cells (black
dashed lines) and Delaunay triangulation (red) computed from the grain center.
3
MULTI-SCALE ANALYSIS
The purpose of this section is to explain how each grain of the granular media behaves individually and how it interacts with its neighbors. More than 250 grains are followed behind the transparent glass. The ratio of cell size/grain size is equal to 26 to limit the influence of the lateral boundary conditions. No breakage appears for the range of macroscopic loads considered here. Some grains near the edges are not taken into account to avoid convergence problems. Different scales and parameters have been studied herein to compare their order of magnitude:
• 𝜖𝑚𝑎𝑐𝑟𝑜is the strain derived from the loading plate displacement and the height of the box,
• 𝜖𝑚𝑒𝑠𝑜will be computed from the displacements of the grain center (𝑈𝑥, 𝑈𝑦) based on the Delaunay triangulation, • 𝜖𝑚𝑖𝑐𝑟𝑜is the microscopic strain of the grains obtained directly from the DIC analysis at the grain scale.
An other quantity 𝑈𝑦∕𝑦0 is also computed for each grain, with 𝑦0 the initial position of the grain center. This normalized microscopic displacement is intrisically related to the grain motion and it will thus be classified as a microscopic parameter. This parameter has been defined because if the set of grains is deformed as a homogeneous continuum submitted to a constant strain then its value should also be constant and its averaged value should match the one of the macroscopic strain 𝜖𝑚𝑎𝑐𝑟𝑜(see Appendix A). Thus, by computing the averaged normalized displacement⟨𝑈𝑦∕𝑦0⟩, any deviation of the grain set kinematics compared with a homogeneous continuum can be detected.
The different quantities enumerated will be explored and compared thereafter and are presented in the following scheme (Figure 7). Note that compression will be considered positive and expansion will be considered negative.
3.1
Macroscopic scale
Figure 8 shows some of the experiments conducted. Tests were performed several times to check the macroscopic reproducibility. The curves (Figure 8) are obtained by the LVDT sensor. The two curves are quite close, which confirms the reproducibility of the test In the rest of the paper, the macroscopic strain is evaluated from a DIC measurement of the vertical displacement of the loading plate. This allows us to have exactly the same reference state (defined by the reference image for DIC) for the different strain measures presented.
3.2
Microscopic scale
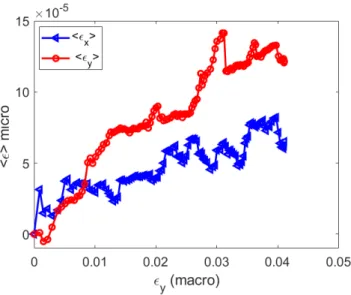
The horizontal and vertical⟨𝜖𝑚𝑖𝑐𝑟𝑜⟩ are compared (Figure 9). The horizontal mean micro-strain is low compared with the vertical one, which increases more with the loading. Note that the grains are compressed in the two directions and their volume change
FIGURE 7 Schematic view of the different quantities computed.
FIGURE 8 Macroscopic behavior of the gravel (LVDT sensor measures for strain).
is mainly governed by the sum of these two strains. A maximum relative volume change of approximately 0.0125% is obtained. Normalized vertical displacements 𝑈𝑦∕𝑦0are shown in Figure 10 as a function of the macroscopic vertical strain. Grains move downward in a continuous way (the vertical displacement is nearly linear with respect to 𝜖𝑚𝑎𝑐𝑟𝑜). No remarkable rearrangement is visible. Note that the slope of the plots in Figure 10 should be the same for all the grains and should be 1 if the set of grains behaves as a continuum submitted to a homogeneous strain transformation. The fact that this slope is not the same for all the grains is proof that the deformation of the set of grains differs from that of a continuum submitted to the same loading.
The mean⟨𝑈𝑦∕𝑦0⟩is now compared with the mean micro-vertical strain⟨𝜖𝑦 𝑚𝑖𝑐𝑟𝑜⟩.⟨𝜖𝑦 𝑚𝑖𝑐𝑟𝑜⟩is very low compared with the mean normalized vertical displacement of the whole grains⟨𝑈𝑦∕𝑦0
⟩
(Figure 11), as expected. Note that, again, this figure is an illustration of the non-homogeneous deformation of the granular medium we observed. Indeed, in the case of a continuum, the average⟨𝑈𝑦∕𝑦0
⟩
should match the macoscopic strain 𝜖𝑚𝑎𝑐𝑟𝑜 and the slopes in Figure 11 should be 1 (see Appendix A). ⟨
FIGURE 9 Mean micro-strain as a function of vertical macro-strain.
FIGURE 10 Normalized grain vertical displacement as a function of vertical macro-strain. A different color is assigned to each
grain. The dashed line indicates a slope equal to 1.
3.3
Mesoscopic scale
Recent work (e.g., Bagi, 2006 [5], Chaze and Cambou, 2014 [7], Zhu et al., 2016 [38], Nguyen et al., 2016 [20]) showed that an intermediate scale is necessary to link the grain displacements to macroscopic strain, i.e., the meso-scale, which is defined hereafter.
To compute strain, the assembly is replaced by a continuous domain, and displacement of the characteristic points of the equiva-lent continuum media is equal to the displacement of the particles centers. To define local strain, a meso-scale is defined, whose branches connect the centers of three particles in contact, using Delaunay triangulation.
From the Delaunay triangulation built using the grain centers as nodes, the gradient of the displacement field over each triangle is determined on the basis of particle displacements and geometrical characteristics, as in the finite element method with shape
FIGURE 11 Mean micro-strain (𝜖𝑚𝑖𝑐𝑟𝑜and 𝑈𝑦∕𝑦0) as a function of vertical macro-strain.
function on each node. The displacement field is linear within a triangle, and thus a constant gradient can be assigned separately to each cell, as done by Bagi, 1996 [4], Cambou et al., 2000 [6] (for example). Plane strain is assumed. The meso-strain for each cell c is then computed (Equation (5)):
{
𝜖𝑐𝑚𝑒𝑠𝑜}= ̄̄𝐵 {𝑞𝑐} (5)
with{𝜖𝑐 𝑚𝑒𝑠𝑜
}
the strain vector for a cell c, ̄̄𝐵 the shape functions tensor derivative for each triangular element, and{𝑞𝑐} the
nodal displacement vector for a cell c. A total 445 Delaunay cells are defined in the proposed example. Note that the Delaunay triangulation is defined on the initial configuration and is unique during the whole test.
Then, an average strain is computed as follows (Equation 6) and defines the mean meso-strain of the sample at each step.
𝜖𝑚𝑒𝑠𝑜= 1 𝑁𝑐 ∑ 𝑐=1 𝑆𝑐 𝑁𝑐 ∑ 𝑐=1 𝜖𝑚𝑒𝑠𝑜𝑐 𝑆𝑐 (6)
Figure 12 shows that we have a random mesh with the Delaunay triangulation. A criterion is given to eliminate the too elongated cells (in blank in the figure) that are mainly located on the boundary of the sample. The strain level of the mesoscopic cells seems to be randomly distributed and some strain localization appears for a few cells.
The horizontal and vertical mean mesoscopic strains are presented in Figure 13. The mean vertical mesoscopic strain evolution is a regular function of the macroscopic strain (Figure 13). The average horizontal strain is not exactly zero. Two reasons can explain this result. First, all the grains in the experiment have not been taken into account. As mentionned earlier, some grains near the interfaces are not taken into account. Secondly, at the beginning of the test the grains do not fill the entire available space in the test box which allows for an expansion in the horizontal direction while the vertical compression is applied.
3.4
Comparison between scales
Figure 14 compares the four vertical strains already defined. The mean microscopic strain is very low compared with the macro-strain. However, with the proposed strategy it is far above the measurement uncertainty. It can thus be concluded that the micro-strain is indeed negligible compared to the macro-strain but that the grains are not rigid. The level of strain measured inside the grain is indeed related to stress which may lead to grain failure for loads of higher amplitude. 𝜖𝑚𝑒𝑠𝑜is very close to
𝜖𝑚𝑎𝑐𝑟𝑜, which is consistent with its definition. This implies that the major events are captured by the DIC measurements behind the window and that 𝜖𝑚𝑒𝑠𝑜is a good indicator of 𝜖𝑚𝑎𝑐𝑟𝑜even if the rear of the sample is not explored. One may imagine that some major rearrangements that occur (inside the loading cell or close to the observation window) have an influence limited to their
FIGURE 12 Map of mesoscopic strain (magnitude) at the end of the test.
FIGURE 13 Mean meso vertical strain as a function of vertical macro-strain.
local vicinity only and have no major impact on the displacement measurement of the plate and thus on 𝜖𝑚𝑎𝑐𝑟𝑜. However, the average mesoscopic strain 𝜖𝑚𝑒𝑠𝑜over the planes in the vicinity of the rearrangements may deviate significantly from 𝜖𝑚𝑎𝑐𝑟𝑜. For example, if the rearrangements induce a rotation of the loading plate from its initial orientation, the average of the mesoscopic strain can deviate from the macroscopic strain. The mean normalized vertical displacement of the grains⟨𝑈𝑦∕𝑦0⟩also has the same order of magnitude as 𝜖𝑚𝑎𝑐𝑟𝑜but it deviates more. The slope of the evolution of⟨𝑈𝑦∕𝑦0⟩as a function of 𝜖𝑚𝑎𝑐𝑟𝑜is observed to be lower than 1. This indicates the presence of deviations of the local mesoscopic strain (confirmed in Figure 12) from the macroscopic strain, which can be seen as the signature of the discrete nature of the media. Plotting the evolution of⟨𝑈𝑦∕𝑦0⟩ for each grain allows us then to appreciate the heterogeneity of the meso-strain field experienced by the granular material. It is
also concluded from Figure 14 that this deviation from the deformation of a continuum increases continuously as the prescribed deformation increases. This confirms that no remarkable rearrangement is visible but that the relative motion between the grains and their own deformation (micro-strain) producing heterogeneities in the mesoscopic strain field increases as well.
FIGURE 14 Comparison of various strains as a function of vertical macro-strain.
4
CONCLUSION
In this paper, we present an experimental exploratory work to understand the mechanisms of coarse granular media (gravel) deformation under oedometric compression. A DIC technique in 2D is used to explore the granular media. The challenge was then to extract quantitative information from 2D images to understand the mechanics at play, and then to elucidate and validate the pertinent scale to accomodate for the macroscopic strain. A method is developed to process the digital images: An area is defined from the center of the gravel particles proportional to the Voronoi cell deduced from the set of grain centers. The tool developed enables us to measure displacement fields in an unfriendly environment: a cell with several Plexiglas windows with dust and scratches.
The application of this tool reveals different scales of interest. Several scales are investigated (microscopic, macroscopic, mesoscopic) to understand better the granular media deformation. The DIC technique offers the possibility of monitoring the phenomena at a microscopic scale, allowing to extract information of the evolution of key properties directly from grain-scale kinematics, and thus enabling a better comprehension of the behavior of the material. This microscopic strain represents only about one thousandth of the macro-strain but it confirms that the grains are not perfectly rigid and that the stress levels corresponding to the measured micro-strain can be significant. Analyzing the micro-strain could be of interest for estimating the load failure of grains in-situ (not in an experiment involving unrealistic loadings compared with what grains are submitted to in-situ). A mesoscopic scale is introduced based on a Delaunay triangulation of the set of grain centers. The gradient of the displacement field of each triangular cell is determined and defines the mesoscopic strain field. It appears that the average meso-strain equals the macroscopic strain by construction but does not allow to appreciate the heterogeneity of the strain field experienced by the analyzed material. This can be appreciated by analyzing the mesoscopic strain field. Another microscopic parameter is computed for each grain (the normalized microscopic displacement 𝑈𝑦∕𝑦0). It has been shown that the mean normalized vertical displacement deviates from the macroscopic strain, with this deviation being a consequence of the het-erogeneity of the strain distribution at the mesoscopic scale. The experimental quantification of the scatter between this strain
plane motions are limited since the Plexiglass wall prevents motion and thus particles are in an intermediate case (between 2D and 3D). Performing tomography should help to overcome this limitation. Moreover, due to the nearly “1D compression” global deformation state, the rotation of the grains was not analyzed. To better understand granular media behavior, with more motions and rearrangements, triaxial tests whould also be more adequate; therefore triaxial tests under tomography may be the best and most elaborate way to proceed and should represent a major step forward in this issue. Advanced works on triaxial tests using X-ray tomography have been done in recent years by several researchers. For example, Vlahinić et al. 2017 [34], extracted particle morphology from 3D X-ray tomography images, but also reported with high accuracy the spatial interactions between particles (contact statistics) as well as grain-level kinematics (particle rotations and translations) as a function of load state. Wiebicke and coworkers (Wiebicke et al. 2017 [35] and [36] 2020) linked the metrology of inter-particle contacts to the investigation of the contact fabric evolution. However, to date, this cutting-edge work does not include multi-scale analysis to study the deformation of granular media.
Finally, this displacement field characterization can be used to provide a concrete, experimental basis for discrete element simulations in order to obtain force distribution in the media and thereby understand force transmission and breakage criteria. This work is in progress.
ACKNOWLEDGMENTS
The authors thank IRSTEA Aix en Provence for the technical assistance for performing oedometric tests.
Conflict of interest
The authors declare no potential conflict of interests.
APPENDIX
A ESTIMATION OF THE NORMALIZED VERTICAL DISPLACEMENT IN 1D
COMPRESSION
To have an order of magnitude of the normalized vertical grain displacement, an assumption is made to deal with a 1D com-pression test in the vertical y direction (low horizontal displacements). Let us call U this vertical displacement. Several grain displacement functions can be assumed. Let us assume different functions for grain displacements 𝑈𝑦(linear and non linear since
𝜖𝑚𝑒𝑠𝑜is not constant for each element). The final 𝜖𝑚𝑎𝑐𝑟𝑜of the sample can be written with the following notations (Equation A1):
𝜖𝑚𝑎𝑐𝑟𝑜=
𝑈𝑓
where 𝑈𝑓is the final vertical displacement of the plate and 𝐿 the initial vertical position of the plate (height of the sample) with the following definition for 𝜖𝑚𝑎𝑐𝑟𝑜and 𝜖𝑚𝑒𝑠𝑜(Equation A2):
𝜖𝑚𝑎𝑐𝑟𝑜= 1 𝐿 𝐿 ∫ 0 𝜖𝑚𝑒𝑠𝑜𝑑𝑦 (A2)
The objective of this part is to compute final⟨𝑈𝑦∕𝑦⟩for the whole 1D system as follows (Equation A3): ⟨𝑈 𝑦 𝑦 ⟩ = 1 𝐿 𝐿 ∫ 0 𝑈𝑦 𝑦 𝑑𝑦 (A3)
and compare it with the final 𝜖𝑚𝑎𝑐𝑟𝑜. Three functions (one linear and two non-linear functions that lead to 𝜖𝑚𝑎𝑐𝑟𝑜 = 𝑈𝑓∕𝐿) are
choosen for the study. Table A1 summarizes the results. When the function 𝑈𝑦is quadratic, the quantity⟨𝑈𝑦
𝑦
⟩
deviates from the macro-strain.
From this simple analysis, it appears that the average meso-strain equals the macroscopic strain by construction. Thus the
Quantity Function 𝟏 Function 𝟐 Function 𝟑
𝐔𝐲 𝑦 𝐿 𝑈𝑓 (𝑦 𝐿 )2 𝑈𝑓 𝑦 𝐿 ( −𝑦 𝐿 + 2 ) 𝑈𝑓 𝛛𝐔𝐲 𝛛𝐲 𝑈𝑓 𝐿 2𝑦 𝐿2 𝑈𝑓 2 𝐿 ( −𝐿𝑦 + 2)𝑈𝑓 𝛜𝐦𝐞𝐬𝐨 𝑈𝑓 𝐿 𝑈𝑓 𝐿 𝑈𝑓 𝐿 ⟨𝐔 𝐲 𝐲 ⟩ 𝑈 𝑓 𝐿 1 2 𝑈𝑓 𝐿 3 2 𝑈𝑓 𝐿 ⟨𝐔𝐲 𝐲 ⟩ 𝛜𝐦𝐚𝐜𝐫𝐨 1 1 2 3 2
TABLE A1 Correspondences between⟨𝑈𝑦
𝑦
⟩
, 𝜖𝑚𝑎𝑐𝑟𝑜and 𝜖𝑚𝑒𝑠𝑜.
average meso-strain does not allow to appreciate the heterogeneity of the strain field experienced by the analyzed material. The heterogeneity of the deformation experienced by the material can only be observed from the meso-strain maps, and there is no global index derived from usual strain estimates quantifying the heterogeneity of the deformation. Alternatively, for any case when the mesoscopic strain is not homogeneous, the strain measure⟨𝑈𝑦
𝑦
⟩
differs from the macroscopic strain. Hence, this is a way to quantify the heterogeneity of the mesoscopic strain field from a global point of view. Once one detects that⟨𝑈𝑦
𝑦
⟩ differs from the macroscopic strain 𝜖𝑚𝑎𝑐𝑟𝑜, a deeper inspection of the mesoscopic strain field is required.
B DIC HARDWARE AND ANALYSIS PARAMETERS
TABLE B2 DIC Hardware Parameters
DIC Software UFreckles
Image Filtering None
Subset Size Adapted to grains
Step Size At each grain center
Subset Shape Function Constant strain
Matching Criterion NSSD
Interpolant cubic
Strain Window NA
Virtual Strain Gauge Size NA
Strain Formulation Small strain
Post-Filtering of Strains NA
Displacement Noise-Floor* 0.05 px
Strain Noise-Floor* Emicro 7.5e-6, Emeso 0.003
(*) Before the test started, four images were acquired. The displacement and strain computed from the analysis of these images are used to estimate the noise-floor of the proposed methodology. The overall noise-floor for the displacement, Emicro and Emeso are obtained by computing the standard deviation of the sought field including all its components at all points and for all four images.
TABLE B3 DIC Analysis Parameters
References
[1] Andò, E., S. Hall, G. Viggiani, J. Desrues, and P. Bésuelle, 2012: Experimental micromechanics: grain-scale observation of sand deformation. Géotechnique Letters, 2, no. 3, 107–112.
[2] Andò, E., S. A. Hall, G. Viggiani, J. Desrues, and P. Bésuelle, 2012: Grain-scale experimental investigation of localised deformation in sand: a discrete particle tracking approach. Acta Geotechnica, 7, no. 1, 1–13.
[3] Arshad, M., F. Tehrani, M. Prezzi, and R. Salgado, 2014: Experimental study of cone penetration in silica sand using digital image correlation. Géotechnique, 64, no. 7, 551–569.
[4] Bagi, K., 1996: Stress and strain in granular assemblies. Mechanics of materials, 22, no. 3, 165–177.
[5] Bagi, K., 2006: Analysis of microstructural strain tensors for granular assemblies. International Journal of Solids and
Structures, 43, no. 10, 3166–3184.
[6] Cambou, B., M. Chaze, and F. Dedecker, 2000: Change of scale in granular materials. European Journal of
[7] Chaze, M. and B. Cambou, 2014: Analysis of internal state and strains in granular material at meso-scale: influence of particle shape. Granular Matter, 16, no. 5, 657–673.
[8] Desrues, J., R. Chambon, M. Mokni, and F. Mazerolle, 1996: Void ratio evolution inside shear bands in triaxial sand specimens studied by computed tomography. Géotechnique, 46, no. 3, 529–546.
[9] Durán, O., N. Kruyt, and S. Luding, 2010: Analysis of three-dimensional micro-mechanical strain formulations for granular materials: evaluation of accuracy. International Journal of Solids and Structures, 47, no. 2, 251–260.
[10] Hall, S., N. Lenoir, G. Viggiani, J. Desrues, and P. Bésuelle, 2009: Strain localisation in sand under triaxial loading: char-acterisation by x-ray micro tomography and 3d digital image correlation. Proceedings of the 1st International Symposium
on Computational Geomechanics (ComGeo I), Juan-les-Pins, Cote d’Azur, France, April.
[11] Houda, M., O. Jenck, and F. Emeriault, 2016: Physical evidence of the effect of vertical cyclic loading on soil improvement by rigid piles: a small-scale laboratory experiment using digital image correlation. Acta Geotechnica, 11, no. 2, 325–346. [12] Kruyt, N. and L. Rothenburg, 1996: Micromechanical definition of the strain tensor for granular materials. Journal of
applied mechanics, 63, no. 3, 706–711.
[13] Kruyt, N. P., 2019: A strain–displacement–fabric relationship for granular materials. International journal of solids and
structures, 165, 14–22.
[14] Kruyt, N. P., 2003: Statics and kinematics of discrete cosserat-type granular materials. International journal of solids and
structures, 40, no. 3, 511–534.
[15] Kruyt, N. P. and L. Rothenburg, 2016: A micromechanical study of dilatancy of granular materials. Journal of the
Mechanics and Physics of Solids, 95, 411–427.
[16] Kuhn, M. R., 1999: Structured deformation in granular materials. Mechanics of materials, 31, no. 6, 407–429.
[17] Kuhn, M. R. and A. Daouadji, 2018: Multi-directional behavior of granular materials and its relation to incremental elasto-plasticity. International Journal of Solids and Structures, 152, 305–323.
[18] Nguyen, N.-S., H. Magoariec, and B. Cambou, 2012: Local stress analysis in granular materials at a mesoscale.
International Journal for Numerical and Analytical Methods in Geomechanics, 36, no. 14, 1609–1635.
[19] Nguyen, N.-S., H. Magoariec, B. Cambou, and A. Danescu, 2009: Analysis of structure and strain at the meso-scale in 2d granular materials. International journal of solids and structures, 46, no. 17, 3257–3271.
[20] Nguyen, S. K., H. Magoariec, E. Vincens, and B. Cambou, 2016: Towards a new approach for modeling the behavior of granular materials: A mesoscopic-macroscopic change of scale. International Journal of Solids and Structures, 97, 256–274.
[21] Nicot, F. and F. Darve, 2011: The h-microdirectional model: accounting for a mesoscopic scale. Mechanics of materials,
43, no. 12, 918–929.
[22] Paniagua, P., E. Andó, M. Silva, A. Emdal, S. Nordal, and G. Viggiani, 2013: Soil deformation around a penetrating cone in silt. Géotechnique Letters, 3, no. 4, 185–191.
[23] Peters, W. and W. Ranson, 1982: Digital imaging techniques in experimental stress analysis. Optical engineering, 21, no. 3, 213427.
[24] Rechenmacher, A. L., 2006: Grain-scale processes governing shear band initiation and evolution in sands. Journal of the
Mechanics and Physics of Solids, 54, no. 1, 22–45.
[25] Rechenmacher, A. L., S. Abedi, O. Chupin, and A. D. Orlando, 2011: Characterization of mesoscale instabilities in localized granular shear using digital image correlation. Acta Geotechnica, 6, no. 4, 205–217.
[26] Richefeu, V., G. Combe, and G. Viggiani, 2012: An experimental assessment of displacement fluctuations in a 2d granular material subjected to shear. Géotechnique Letters, 2, no. 3, 113–118.
trends and recent results. Advanced experimental techniques in geomechanics, 3–67.
[32] Viggiani, G., M. Küntz, and J. Desrues, 2001: An experimental investigation of the relationships between grain size dis-tribution and shear banding in sand. Continuous and discontinuous modelling of cohesive-frictional materials, Springer, 111–127.
[33] Vlahinić, I., E. Andò, G. Viggiani, and J. E. Andrade, 2014: Towards a more accurate characterization of granular media: extracting quantitative descriptors from tomographic images. Granular Matter, 16, no. 1, 9–21.
[34] Vlahinić, I., R. Kawamoto, E. Andò, G. Viggiani, and J. E. Andrade, 2017: From computed tomography to mechanics of granular materials via level set bridge. Acta Geotechnica, 12, no. 1, 85–95.
[35] Wiebicke, M., E. Andò, I. Herle, and G. Viggiani, 2017: On the metrology of interparticle contacts in sand from x-ray tomography images. Measurement Science and Technology, 28, no. 12, 124007.
[36] Wiebicke, M., E. Andò, G. Viggiani, and I. Herle, 2020: Measuring the evolution of contact fabric in shear bands with x-ray tomography. Acta Geotechnica, 15, no. 1, 79–93.
[37] Xiong, H., F. Nicot, and Z. Yin, 2017: A three-dimensional micromechanically based model. International Journal for
Numerical and Analytical Methods in Geomechanics, 41, no. 17, 1669–1686.
[38] Zhu, H., F. Nicot, and F. Darve, 2016: Meso-structure evolution in a 2d granular material during biaxial loading. Granular
Matter, 18, no. 1, 3.
[39] Zhu, H., G. Veylon, F. Nicot, and F. Darve, 2017: On the mechanics of meso-scale structures in two-dimensional granular materials. European Journal of Environmental and Civil Engineering, 21, no. 7-8, 912–935.