A multi-isotope approach to determine the origin of methane and higher alkanes in groundwater of the St. Lawrence Platform, Saint-Édouard area, eastern Canada
Bordeleau, G.1. Rivard, C.1, Lavoie, D.1, Lefebvre, R2., Ahad, J. M. E.1., Xu, X.3, Mort, A.4
1Geological Survey of Canada, Natural Resources Canada, Quebec City, QC, Canada
2Institut national de la recherche scientifique (INRS), Quebec City, QC, Canada
3University of California, Irvine, CA, USA
4Geological Survey of Canada, Natural Resources Canada, Calgary, AB, Canada
Acknowledgements
The authors would like to thank the residents of the Saint-Édouard area who provided access to their water well or who allowed us to drill observation wells on their land. We are also grateful to Dr. Steve Grasby of the GSC who acted as internal reviewer, and to the four anonymous reviewers and Editor for their valuable comments. Our gratitude is extended (but not limited) to Hooshang Pakdel and Jade Bergeron from the GSC-Quebec Delta-Lab, Yves Gélinas from Concordia University, the GSC field crews involved in acquiring the data, and Marianne Molgat for her support, interest and for the sharing of information and data from Talisman Energy. The project was supported by the Ministère du Développement durable, de l’Environnement et de la
Lutte contre les changements climatiques du Québec (MDDELCC). The work was funded through the ecoEnergy Innovation Initiative (ecoEII) and the Program for Energy Research and Development (PERD) of the Energy Sector, and through regular funds of the Environmental Geoscience Program of the Lands and Minerals Sector, both of Natural Resources Canada. This is Geological Survey of Canada contribution 20170284.
Abstract
In the last decade, production of shale gas has tremendously increased and the need for local pre-exploitation baseline data on dissolved natural gas in aquifers has been stressed. This study investigated the origin of hydrocarbons naturally present in shallow aquifers of the Saint-Édouard area (Quebec, eastern Canada), where the underlying Utica Shale is known to contain important gas resources which have not yet been exploited. Groundwater and shallow bedrock gas samples were collected and analyzed for isotopic composition of alkanes (δ13C and δ2H
C1-C3), dissolved
inorganic carbon (δ13C
DIC), and radiocarbon in methane and DIC (14CDIC, 14CCH4). This multi-isotope
approach proved enlightening and results revealed that: 1) most of the methane in the region is of microbial origin; 2) partial contribution of thermogenic gas occurs in 15% of the wells; 3) processes such as late-stage methanogenesis and methane oxidation are responsible for ambiguous methane isotopic compositions; and 4) both microbial and thermogenic gas originate from the shallow bedrock aquifer, with the exception of one sample likely coming from deeper units. The thick succession of shales overlying the Utica Shale thus appears to act as an effective migration barrier for the shallow aquifers. However, evidence of upward migration of old brines
near major fault zones indicates that these may serve as preferential migration pathway over a certain depth, but most likely no more than 200 to 500 meters. The geochemical framework presented here will hopefully be useful in other research projects, especially when conventional indicators of natural gas origin provide ambiguous results.
Keywords: baseline, unconventional reservoir, Utica Shale, bedrock aquifer, formation brines
1 Introduction
In the last decade, production of shale gas through the use of horizontal drilling and hydraulic fracturing has tremendously increased in North America (Jarvie, 2012b; 2012a). During that time, there has been much debate about the risks that shale gas activities pose to groundwater quality in shallow aquifers (e.g.: Engelder, 2012; Harkness et al., 2017; Lefebvre, 2017; McMahon et al., 2017; Molofsky et al., 2011; Osborn et al., 2011b; 2011a; Saba and Orzechowski, 2011; Vengosh et al., 2014; Warner et al., 2012b; 2012a). Several studies have investigated possible connections between deep thermogenic gas reservoirs and shallow aquifers, notably using methane stable isotope composition (δ13C
CH4, δ2HCH4), to distinguish thermogenic from microbial gas (e.g.:
Aravena et al., 1995; Baldassare et al., 2014; Barker and Fritz, 1981; Humez et al., 2016a; LeDoux et al., 2016; Moritz et al., 2015; Osborn and McIntosh, 2010; Warner et al., 2013). Many of these studies were carried out in areas where shale gas exploitation has been ongoing for a number of years, and several authors have stressed the lack of local pre-exploitation baseline data for dissolved natural gas in aquifers. To better understand the possible environmental impacts of these deep activities on fresh groundwater, a number of recent studies have started
documenting baseline data prior to widespread shale gas development. In North America, such studies have been conducted in various regions of the United States including New York (Kappell and Nystrom, 2012; McPhillips et al., 2014) and Pennsylvania (Boyer et al., 2012; Li et al., 2016; Molofsky et al., 2013; Siegel et al., 2015a; Siegel et al., 2015b; Warner et al., 2012b), and in some Canadian provinces such as Ontario (McIntosh et al., 2014) and Quebec (Moritz et al., 2015; Pinti et al., 2013).
These studies, and many others, have investigated the relationship between dissolved methane in groundwater and other factors such as topography, geological units, groundwater geochemical type, and distance from a conventional or unconventional gas well in regions where exploitation is already occurring. Conclusions vary widely between studies, but factors that have commonly been associated with higher methane concentrations include 1) proximity to gas wells (Jackson et al., 2013; Osborn et al., 2011b; contradicted by Siegel et al., 2015a), 2) topographic lows (Harkness et al., 2017; Kennedy and Drage, 2015; Molofsky et al., 2016; Molofsky et al., 2013), 3) water wells drilled within or just above shallow organic-rich shale or coal-bed units, which provide substrates for microbial methane production (Humez et al., 2016a; McIntosh et al., 2014; Molofsky et al., 2013), and 4) geochemically evolved groundwater types such as Na-HCO3 and
Na-Cl (Harkness et al., 2017; Kennedy and Drage, 2015; McIntosh et al., 2014; McMahon et al., 2017; McPhillips et al., 2014; Molofsky et al., 2016; Molofsky et al., 2013; Warner et al., 2012b). While these factors are important, others have often been overlooked but may be important for baseline methane assessments. These notably include the potential of shallow bedrock units to contribute thermogenic gas to groundwater (Baldassare et al., 2014; Molofsky et al., 2013), and the role of fractures and fault zones as preferential migration pathways for deep fluids over
hundred-meter or thousand-meter scales (Gumm et al., 2016; Nicot et al., 2017). The study reported here considers these factors, as well as others.
The St. Lawrence Lowlands in southern Quebec, Canada, is an excellent candidate area to study the factors controlling the presence of naturally occurring dissolved methane in groundwater. In this area, the Upper Ordovician Utica Shale presents a good potential for gas production (Hamblin, 2006; Lavoie et al., 2008) and the industry targeted this unconventional reservoir for shale gas exploration between 2006 and 2010, until a de facto moratorium on hydraulic fracturing was imposed. A total of 28 exploration gas wells were drilled into the Utica Shale, of which 18 were hydraulically fractured, over a 10,000 km2 area (Lavoie et al., 2014). None of these
wells was put into commercial production. Due to this limited number of exploration wells and the absence of commercial shale gas production, the Utica Shale is considered a frontier play and, therefore, the St. Lawrence Lowlands can be viewed as a “virgin” area with regards to hydraulic fracturing and exploitation. No large-scale commercial hydrocarbon production from conventional reservoirs has taken place either in the region (only one conventional gas well was exploited in Ordovician dolostones from early 1970s to early 1990s, Rivard et al., 2014). The intermediate zone, located between the shale gas reservoir and the shallow rock aquifer, mainly consists of fine grained clastics with minor organic-rich shales from the Lorraine and Saint-Rosalie groups, which also contain varying proportion of free hydrocarbons (Lavoie et al., 2016). These units are capped by a thin quaternary sediment cover (usually < 10 m; Ladevèze et al., 2016). Therefore, open bedrock wells in this region tap the upper fractured portion of these shale-dominated units.
Within the St. Lawrence Lowlands, the Saint-Édouard area near Quebec City was of particular interest because 1) the most promising shale gas well drilled in the St. Lawrence Lowlands is located there, based on initial production tests, 2) groundwater of this region is highly charged in dissolved methane (Bordeleau et al., 2018; Lefebvre et al., 2015), 3) this region is quite populated and groundwater is an important source of water supply, and 4) the region has several known major faults whose potential role as preferential fluid pathways remained to be determined.
The objective of the present study is to identify the origins (thermogenic versus microbial) and processes that have affected the presence and isotopic composition of natural gas in shallow aquifers of the Saint-Édouard region. The study also aimed to assess whether methane was produced in situ, or whether it has migrated from deeper strata into the shallow aquifer, especially in the vicinity of regional faults. The general approach is based on the use of multiple isotopes in shallow groundwater and bedrock gas samples.
2 Site description
2.1 Geography and geologyThe study area covers approximately 500 km2 and is located 65 km southwest of Quebec City on
the south shore of the St. Lawrence River, Quebec, Canada (Figure 1-A). It is centered around the municipality of Saint-Édouard, where two exploration shale gas wells were drilled form the same well pad (one vertical, A267, and one horizontal, A275). The topography is flat, with slopes averaging around 2% (Lefebvre et al., 2015), from the outer edge of the Appalachian Piedmont
to the southeast, downward northwesterly to the St. Lawrence River. This region receives on average 1170 mm/y of precipitation with about 23% as snow (from the Government of Canada website: www.climate.weather.gc.ca).
Quaternary deposits in this area are very heterogeneous, both spatially and lithologically, and are mainly associated with the last glaciation episode (Lefebvre et al., 2015). The bedrock geology consists primarily of Upper Ordovician units and is divided in three tectono-stratigraphic domains (Figure 1-A/B):
1) The autochtonous domain (Lotbinière and Nicolet formations of the Sainte-Rosalie and Lorraine groups, respectively), which is part of the St. Lawrence Platform and is little tectonized. The near surface outcrop succession is constituted of black and grey shales and siltstones (Lavoie, 2008).
2) The parautochtonous domain (Les Fonds Formation of the Sainte-Rosalie Group), which is also part of the St. Lawrence Platform and consists of tectonized autochtonous units. The upper part of the succession is mainly composed of black calcareous shales (Globensky, 1987; Lavoie et al., 2016).
3) The allochtonous domain (Bourret Formation), which makes up only a small part of the southeastern end of the study area, in the Appalachian Piedmont. It is composed of highly tectonized, transported Appalachian thrust sheets containing sedimentary and volcanic rocks from the Cambrian to the Upper Ordovician with dominant variegated shales with interbeds of clayey limestone, dolomite and siltstone (Clark and Globensky, 1973; Lavoie, 2008).
The Upper Ordovician Lotbinière and Les Fonds formations of the Sainte-Rosalie Group are time and facies equivalents to the Utica Shale. The shallow bedrock units (0-150 m) in the Lotbinière, Nicolet and Les Fonds formations was shown to contain hydrocarbons (C1-C6 alkanes), with
concentrations being generally higher in the Lotbinière and Les Fonds formations. Most isotopic (δ13C
CH4) values in all three formations are representative of thermogenic or mixed
thermogenic/microbial gas, with the mixed gas values being more abundant at the shallowest depths (Lavoie et al., 2016).
Two major fault zones are present in the study area (Figure 1): a thrust - backthrust fault zone system in the southeastern part, limited by the Aston fault and Logan’s Line, and a steeply-dipping normal fault in the northwestern part called the Rivière Jacques-Cartier fault (Lavoie et al., 2016). The latter is the northeastern extension of the Yamaska fault discussed by Moritz et al. (2015). These authors interpreted these two fault zones as potential migration pathways for gas, as they had observed significantly higher methane concentrations in wells close to the faults, compared to other wells in their study area. However, higher methane concentrations were not observed along the faults in the Saint-Edouard area (Bordeleau et al., 2018).
Previous geological interpretations (Castonguay et al., 2010; Konstantinovskaya et al., 2009) suggested that the normal Rivière Jacques-Cartier fault should not extend upward close to the surface, although reprocessing of seismic lines indicated that such extension cannot be ruled out (Lavoie et al., 2016). Moreover, recent interpretation of borehole geophysical and structural data indicates that both fault zones could act as conduit-barrier systems, with a sealed fault core and a more permeable damaged zone surrounding the core (Ladevèze et al., 2018). While still
hypothetical, the presence of a several hundred-meter scale migration pathway is more likely in the vicinity of the normal fault than the thrust fault, due to: 1) the steep dip and more simple geometry of the normal fault, and 2) the presence of siltstone beds, with higher permeability than the surrounding shale, that are thought to have been dragged into the core of the normal fault. The maximum depth at which siltstone beds could have been dragged into the normal fault core is unknown, but should be limited to the upper part of the Lorraine Group, where siltstones are dominant (Ladevèze et al., 2018). Finally, groundwater geochemical data has indeed demonstrated the presence of very old, saline water in shallow observation wells around the normal fault, suggesting the existence of a migration pathway, but again the exact depth provenance of these fluids could not be determined (Bordeleau et al., 2018).
2.2 Hydrogeology
Regionally, groundwater within the fractured rock aquifer flows from southeast (Appalachian Piedmont) to northwest (St. Lawrence River) (Ladevèze et al., 2016). The shallow fractured rock aquifer permeability is usually low to moderate (10-9 to 10-7 m/s for the Sainte-Rosalie Group and
10-7 to 10-5 m/s for the Lorraine Group), and most of the water-bearing fractures are located in
the top 60 m, and especially in the top 30 m of bedrock (Ladevèze et al., 2018). Bedrock aquifer conditions are typically semi-confined to confined (Ladevèze et al., 2016). Most residential wells are tapping the fractured rock aquifer, as quaternary deposits rarely yield enough water.
In the bedrock aquifer, groundwater geochemistry exhibits mostly vertical, rather than lateral, transitions (Bordeleau et al., 2018). Four water types were identified, namely (in increasing order of geochemical evolution) Ca-HCO3, Na-HCO3, Na-HCO3-Cl, and Na-Cl types, the name indicating
the dominant cations and anions. In the upper part of the aquifer, oxygen is usually present and groundwater is of the Ca-HCO3 type, having undergone little geochemical evolution after
infiltration. For water circulating deeper into the aquifer, oxygen rapidly drops below detection limit, and cation exchange (Ca-Na) with the aquifer matrix results in Na-HCO3 type water.
Groundwater can then mix with residual water from the Champlain Sea (a major marine episode which began some 13,000 calendar years ago and lasted approximately 2,000 years; Occhietti, 2007) and, in some cases, with a small amount of formation brine (particularly along the Rivière Jacques-Cartier fault in the northern part of the study area), leading to Na-HCO3-Cl or Na-Cl type
water (Bordeleau et al., 2018).
Methane is ubiquitous in groundwater of the Saint-Édouard area. Median, average and maximum methane concentrations based on 48 sampling locations (using a geometrical mean when several results over time were available) are 4.9, 10.4, and 42.5 mg/L, respectively (Bordeleau et al., 2018), which is higher than the values reported elsewhere in the St. Lawrence Lowlands (Lefebvre et al., 2015; Pinti et al., 2013). High methane concentrations are not particularly localized near faults in the study area, and there is no apparent correlation between methane concentrations and specific geological formations (for the three shale-dominated formations) or distance from the hydraulically fractured Saint-Édouard gas wells. Instead, dissolved methane is mostly associated with water type, and thus somewhat to the sampling depth, with concentrations
increasing along the geochemical evolution path. Ethane and propane were detected at generally low concentrations in 38% and 15% of the sampling points, respectively (Bordeleau et al., 2018).
3 Materials and methods
3.1 Sample site acquisition and well drilling methods
Groundwater was sampled from a total of 30 private (residential) wells and 14 newly-drilled dedicated observation wells, between July 2013 and February 2016. The location of observation wells was carefully selected to have a good spatial distribution across the different geological formations, as well as to obtain more information in the vicinity of regional fault zones, which could represent upward fluid migration pathways (Figure 1-A).
Among the 30 residential wells, four (4) were surficial wells screened in unconsolidated sediments (depth range: 4.7 - 18.3 m) and 26 were open bedrock wells (depth range: 13.7 - 101 m). The 14 observation wells (depth range: 30 - 147 m) were open to bedrock with the casing sealed through surficial sediments. Eight of them were diamond-drilled (F1 to F4, F7, F8, F20, F21) and the others were hammer-drilled (F5, F6, F10 to F13).
Four of the observation wells were sampled at two different depths (named deep and shallow, separated by at least 25 m), bringing the total number of “sampling points” to 48 (30 residential + 10 single-depth observation wells + 4 double-depth observation wells called “shallow” and “deep”). Of note, every observation well was drilled within a single formation, so that deep and
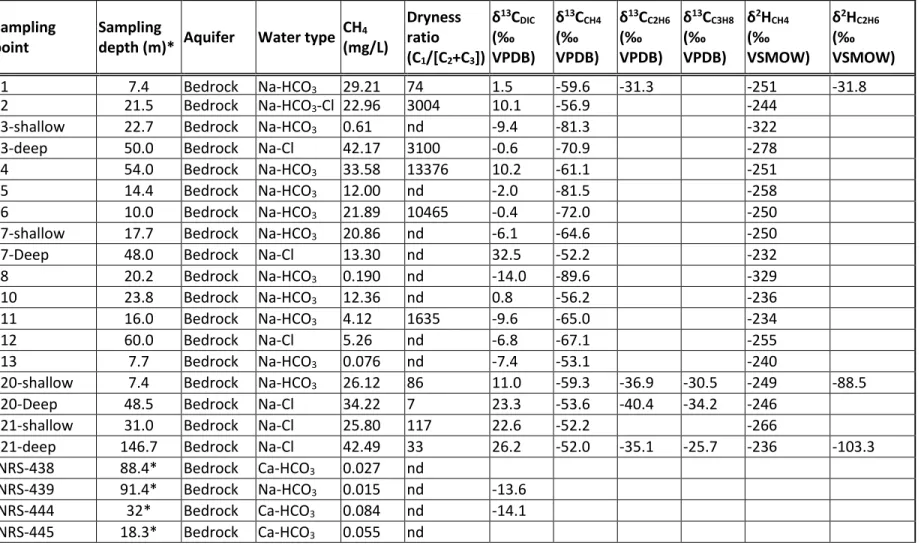
shallow samples from a given well are from the same formation. Details concerning the wells, including the sampling depths, are presented in Supplementary Information Table S1.
3.2 Sampling techniques
Most of the wells were sampled between one and three times, but some were sampled more often, up to 18 times over a 2.5-year period. Results reported in this paper correspond to the geometrical mean of all samples collected from a given sampling point. Obtaining multiple samples over time should be part of any baseline study, as both the methane concentrations and isotopic composition can vary over time, with some wells varying very little, and others exhibiting major variations (Rivard et al., 2018b).
Samples from residential wells were collected upstream from any water treatment system. The wells were purged until stabilization of field physiochemical parameters (temperature, pH, dissolved oxygen (DO), redox potential (ORP), electrical conductivity) was achieved. After purging, the flow rate was lowered to a minimum and samples were collected using a 6.25-mm (¼’’) diameter tubing.
Observation wells were sampled using either an impeller Redi-Flo2 submersible pump (Grundfos, Denmark) or a bladder submersible pump (Solinst, Ontario, Canada), both using 6.25 mm (¼’’) tubing, which yield equivalent analytical results (Rivard et al., 2018a). The pumps were carefully lowered in the well until the desired depth was reached, i.e. where the most productive fracture(s) had been identified based on downhole geophysical logging (Crow and Ladevèze,
2015). In order to target water coming from the desired fractured zone, sampling was performed at low flow (median of 230 mL/min), causing minimal drawdown in these low permeability shale units (Bordeleau et al., 2018). Pumping was maintained until field parameters had stabilized, which typically took less than 2 hours.
Samples for analysis of alkane concentrations were collected with the method recommended by the USGS for water containing dissolved gases (USGS, 2017) using 40 mL amber glass vials with a Teflon-coated septum. Briefly, the vials were placed upright in a much larger container, with the sampling tube positioned at the bottom of the vial. Water filled the vial, then the larger container until the vial was submerged. The tube was then removed and the vial was rapidly capped under water. Samples for alkane stable isotope composition (δ13C and δ2H of C
1-C3) and methane
radiocarbon (14C
CH4) were obtained in a similar manner, but were collected in 1L amber glass
bottles with a butyl rubber septum. These samples were preserved using hydrochloric acid to lower the pH to <2, to inhibit microbial activity. Samples for isotopic analysis of dissolved inorganic carbon (δ13C
DIC) were collected directly from the sampling tube. They were filtered on
a 0.45 µm nylon membrane and collected in amber-glass 40-mL vials, closed with caps containing a Teflon-coated silicon septum plus a butyl rubber septum. All samples were kept upside down (40 mL) or on their side (1L), at 4oC in darkness, until analysis.
Shallow bedrock core and cutting samples were collected from the observation wells drilled in 2015 (wells F5-F8, F10-F14, F20 (which is a twin of F1), F21, as well as F2 which was originally drilled in 2013 but was drilled a little deeper in 2015). Bedrock core or cuttings were collected at several depths in each well (except for F2 for which only the deepest interval is available), and
were each placed into several Isojars® (Isotech Laboratories, Champain, IL) to allow for multiple analyses. Samples (approximately 300 g of rock per jar) were rapidly placed within the jar, which was then filled up to the marked filling line with ultrapure water, preserved using benzalkonium chloride, tightly closed, and kept upside down. In Isojars®, the gas contained in the rock sample migrates into the water over time, and equilibrates with the headspace. Concentrations in the headspace are semi-quantitative, as they depend on the exact mass of core or cuttings placed in the jar, as well as the surface area of the rock that is exposed to the ambient water, which is function of the “physical integrity” (cores vs cuttings) of the rock sample. However, this issue does not affect the relative concentrations (dryness ratio) and isotopic composition. Values for gas concentrations, as well as isotopic composition of methane (C1; δ13C, δ2H), ethane and
propane (C2 and C3; δ13C only) were reported in Lavoie et al. (2016); these are used here for
comparison with groundwater samples. Shallow bedrock gas values for 14C
CH4, and for δ2HC2-C3,
are documented here for the first time.
3.3 Analytical methods
Concentrations of dissolved C1-C3 alkanes in groundwater were determined at the Delta-Lab of
the Geological Survey of Canada (Quebec City, QC) using a Stratum PTC (Teledyne Tekmar, Mason, OH) purge and trap concentrator system interfaced with an Agilent (Santa Clara, CA) 7890 gas chromatograph equipped with a flame ionisation detector (GC-FID). The method employed was adapted from Pennsylvania Department of Environmental Protection method PA-DEP 3686 (PA-DEP, 2012) and US Environmental Protection Agency (EPA) method RSK 175 (Kampbell and
Vandegrift, 1998). Limits of quantification (LOQ) on the samples were 0.006, 0.002 and 0.01 mg/L for methane, ethane and propane, respectively.
Analyses of δ13C
DIC were done at the University of Waterloo, using a Gilson (Middleton, WI) 222XL
auto-sampler and a MicroGas-IsoPrime (Manchester, UK) isotope ratio mass spectrometer (IRMS). The isotopic composition of samples is expressed in the usual per mil notation relative to the international Vienna Pee Dee Belemnite (V-PDB) standard. Precision is ± 0.2‰.
Carbon and hydrogen isotope ratios of C1-C3 alkanes were measured using GC-IRMS. Analyses
were done either at the Delta-Lab of the Geological Survey of Canada (Quebec City; δ13C and δ2H
of dissolved methane only), the G.G. Hatch laboratory of the University of Ottawa (δ13C and δ2H
of dissolved and gaseous methane, ethane, propane), the Applied Geochemistry Laboratory of the University of Calgary (δ13C and δ2H of gaseous methane, ethane, propane), or Concordia
University (δ13C of dissolved methane, ethane, propane). The choice of the laboratory depended
on instrument availability to ensure timely analysis. Some samples were sent in duplicate to the different labs to verify that results were comparable. Details concerning analytical techniques at each laboratory are provided in the Supplementary Information. The isotopic composition of samples is expressed in the usual per mil notation relative to V-PDB (δ13C) or the international
Vienna Standard Mean Ocean Water (V-SMOW) (δ2H) standards. The uncertainty due to
sampling, handling and analytical procedures is ±1.7‰ for δ13C and ±19‰ for δ2H (Rivard et al.,
2018b).
Methane radiocarbon (14C
CH4) and 14CDIC analyses were done at the Keck Carbon Cycle AMS
passes through a flow-through vacuum line where CO2 and CO (after oxidation to CO2) are
separated from CH4 in a series of individual cryogenic traps, after which the CH4 is also converted
to CO2. The original and CH4-derived CO2 are individually recovered, quantified and prepared for
graphitization. An aliquot of the quantified CO2 is taken for 13C analysis on a Finnigan Delta Plus
IRMS, while the remaining CO2 is prepared as described by Xu et al. (2007) using the sealed tube
Zn graphitization method, for subsequent 14C analysis on a NEC compact 0.5MV 1.5SDH-2 AMS
system (accelerator mass spectrometer). Sample preparation backgrounds have been subtracted from reported values, which were also corrected to a common δ13C value of -25‰. Results are
discussed using the percent modern carbon (pmC) notation.
4 Results and discussion
4.1 Methane δ13C and δ2H values in groundwater
Among the 48 sampling points, 36 had a sufficiently high methane concentration to allow δ13C
analyses and 30 had a sufficient methane concentration for δ2H analyses. Isotopic composition
of ethane and propane could also be measured in a few samples, and this is discussed in section 4.3.3. According to the traditional isotopic domains defined by Whiticar (1999), microbial gas formed through acetate fermentation normally has δ13C
CH4 values between -50 and -70‰ with
δ2H
CH4 values between -275 and -375‰, while microbial gas formed through CO2 reduction has
δ13C
usually has δ13C
CH4 values between -20 and -50‰ with δ2HCH4 values between -125 and -275‰
(Figure 2-A).
4.1.1 Relationship with shallow geological formations
In the study area, groundwater δ13C
CH4 values vary between -97.5 and -41.6‰, and δ2HCH4 values
range between -322 and -113‰ for δ2H (Figure 2-A and Supplementary Information Table S1).
Within the observed δ13C
CH4 range, high (more thermogenic) and intermediate values are found
in each of the three shale-dominated formations of the St. Lawrence Platform (Nicolet, Lotbinière and Les Fonds formations). However, the lower values (below approximately -65‰, therefore clearly microbial) are concentrated in the Nicolet Formation, resulting in an average δ13C
CH4 of
-67.3‰ for this formation, compared to -56.6‰ for the Les Fonds Formation and -57.9‰ for the Lotbinière Formation. In contrast, average δ2H
CH4 values are similar for these three formations.
Samples from the non shale-dominated Bourret Formation (located in the Appalachian Piedmont) usually did not have enough methane to perform isotopic analyses. Wells located in the vicinity of the normal fault and the thrust – backthrust fault zone exhibit a large variety of isotopic compositions, and are not distinct from wells located further away from the faults.
4.1.2 Origin of the gas and methanogenic pathway
The vast majority of samples fall between the typical domains of thermogenic gas and microbial gas formed via both methanogenic pathways (Figure 2-A). However, while the two general domains for microbial gas span a large range of δ2H
CH4 values (Whiticar, 1999), these can be
refined for a given geographical region, knowing that the δ2H
determined by the δ2H
H2O value of the associated groundwater and by the methanogenic
pathway, according to the following relationships:
CO2 reduction: δ2HCH4 (‰) = δ2HH2O -160 (±10) (Golding et al., 2013; Whiticar, 1999)
(Eq. 1)
Acetate fermentation: δ2H
CH4 (‰) = 0.675 δ2HH2O -284 (±6) (Waldron et al., 1999)
(Eq. 2)
Considering the range of δ2H
H2O values in this area (-65 to -87‰; Bordeleau et al., 2018; Lefebvre
et al., 2015), the expected δ2H
CH4 values are between -215 and -260‰ for CO2 reduction, and
between -322 and -351‰ for acetate fermentation (colored bands on Figure 2-A). Only two sampling points (observation wells F3 and F8, in the middle of the Nicolet Formation and containing <1 mg/L CH4) have δ2HCH4 values corresponding to acetate fermentation, although
their δ13C
CH4 values are lighter than the documented domain. The rest of samples, although
sometimes being at the limit or even out of the typical δ2H
CH4 domain documented for microbial
methane (Whiticar, 1999), are in fact consistent with methane formed via CO2 reduction using
the local groundwater. Therefore, the CO2 reduction methanogenic pathway appears to be highly
dominant over acetate fermentation in this region. However, the δ13C
CH4 values in many samples
are heavier than what would be expected for this process. This could be the result of mixing with thermogenic gas, or other processes involving microbial gas only. In any case, such processes appear to be important in the study area, as samples with the highest methane concentrations generally have δ13C
4.2 Processes enriching the isotopic composition of dissolved methane
4.2.1 Mixing between thermogenic and microbial gas
The presence of thermogenic gas in samples was assessed based on the presence of ethane and/or propane. Indeed, methanogens are known to be unable to produce significant amounts of C2+ hydrocarbons (Tazaz et al., 2013). Hence, the dryness ratio, corresponding to the molar
concentration of methane over ethane and propane (C1/[C2+C3]) is commonly used as an
indication of thermogenic versus microbial gas, with ratios ≤100 being indicative of thermogenic gas, and ratios ≥1000 being indicative of microbial gas (Golding et al., 2013 and authors therein). Intermediate ratios likely reflect mixing between thermogenic and microbial gas.
The dryness ratio was quantified for 17 out of the 48 sampling points (Figure 3), because the other 31 sampling points contained either no quantifiable C1, C2 and C3 (2 samples) or did contain
C1 but no C2 and C3 (29 samples). However, considering the sum of the molar quantification limits
for C2 (0.067 µmol/L) and C3 (0.227 µmol/L), any sample with at least 1000 times this amount of
methane (CH4≥ 293 µmol/L, or 4.7 mg/L) and with C2+C3 below detection limit would necessarily
produce a dryness ratio ≥ 1000, indicating microbial gas. Among the 31 samples with unquantified ratios (not shown on Figure 3), 7 have methane concentration ≥ 4.7 mg/L, hence a microbial origin can be inferred for these samples. The origin of the 24 other samples remains undefined.
Therefore, based on dryness ratios, there are 4 sampling points with methane of predominantly thermogenic origin (F1, F20-shallow, F20-deep, F21-deep), 3 with methane from mixed thermogenic and microbial origins (F21-shallow, Zone 13R, INRS-447), 17 with microbial methane
(10 with quantified ratios visible on Figure , plus 7 with unquantified ratios as discussed above), and 24 with undefined origin. Therefore, 15% of sampling points contain at least some thermogenic gas, while the rest is constituted solely of microbial gas, or is undefined (see Supplementary Table S-1 for complete results). Samples containing some thermogenic gas are mostly found within the Lotbinière (F1, F20-shallow, F20-deep, INRS-447) and Les Fonds (F21-shallow and F21-deep) formations of the Sainte-Rosalie Group (where (F21-shallow bedrock thermogenic gas concentrations were shown to be higher; Lavoie et al., 2016), but one sample (Zone 13R) is located in the Nicolet Formation of the Lorraine Group.
Wells with thermogenic gas are not particularly located near major faults. Well F21 (deep and shallow), which is located in the thrust – backthrust fault system, does contain thermogenic gas, but it is the deepest observation well (147 m deep). Hence, no other well is available at this depth for comparison, to determine whether thermogenic gas, as well as small amounts of brines, are ubiquitous at this depth throughout the region, or whether they could be related to the fault zone. Another noteworthy well is residential well Zone 9R, located in the Nicolet Formation, along the Rivière Jacques-Cartier fault. This well is considered to have an undefined dryness ratio, as 11 out of 12 samples collected from this location had no ethane or propane. The mean isotopic values are -65.5‰ for δ13C
CH4 and -243‰ for δ2HCH4, corresponding to microbial gas. However,
the very first sample collected in this well did contain propane and had a dryness ratio of 49, with a δ13C
CH4 value of -43.5‰ (no δ2HCH4 result is available for this sample), which is strongly
indicative of thermogenic gas. This first dissimilar result could have been caused by a sporadic pulse of thermogenic gas (Bordeleau et al., 2018).
In general, the dryness ratio in groundwater is not correlated with well depth, and samples with thermogenic ratios were collected at depths varying between 12.8 and 147 m. The dryness ratio does not seem related to the water type either (Figure 3), except for the Ca-HCO3 type samples
which all have undefined ratios, as they contain little C1, and no detectable C2 or C3. Likewise,
there is no apparent relationship between methane concentration and dryness ratio, indicating that the highest concentrations detected in the study area can be of either thermogenic or microbial origin, or a mixture of both (Figure 3). Moreover, samples containing some thermogenic gas make up only part of the group of samples with enriched δ13C
CH4 (between -50
and -60‰; see red outline on Figure 2-B). Hence, other processes must be considered for the samples with thermogenic-like δ13C
CH4 values, but with dryness ratios ≥1000.
4.2.2 Oxidation
One process that can enrich the C and H isotope ratios in methane is microbial oxidation, which can occur under both aerobic and anaerobic conditions (Kotelnikova, 2002). This process can eventually result in microbial methane being mistaken for thermogenic methane (Humez et al., 2016b; Kotelnikova, 2002; Whiticar, 1999), as molecules containing the light isotopes are preferentially consumed by methanotrophs, resulting in progressively heavier δ13C
CH4 and δ2HCH4
values in the residual methane.
In our samples, the highest δ13C
CH4 values were observed in the Ca-HCO3 water type (from wells
in the bedrock and granular aquifers), some of them being well within the typical thermogenic δ13C
CH4 domain (Figure 2-B). However, these samples have undefined dryness ratios (no C2 or C3),
bedrock aquifer, and even more unlikely in the granular aquifer, compared to deeper horizons in the bedrock aquifer. Oxidation is therefore likely to be responsible for the high δ13C
CH4 values in
these samples, but unfortunately further validation using δ2H values was not possible because
CH4 concentrations were too low to allow accurate δ2HCH4 measurements.
For the remaining samples, two theoretical oxidation trends were computed (arrows on Figure 2-A), using documented isotopic fractionation factors (Alperin et al., 1988; Kinnaman et al., 2007) or predicted theoretical δ2H vs δ13C relationships (Coleman et al., 1981; Whiticar, 1999). It is
herein assumed that initial (non-oxidized) δ13C
CH4 and δ2HCH4 values were -85 and -325‰,
respectively, for CH4 formed through acetate fermentation, and -80 and -260‰, respectively, for
CH4 formed through CO2 reduction. These initial values are representative of the lowest values
in this study area, for the two presumed methanogenic pathways (Figure 2-A). The widening of the arrows accounts for the different fractionation factors or δ2H vs δ13C relationships
documented in the afore-mentioned publications. Considering the isotopic composition of samples, it seems at least plausible, but not unequivocal, that a few samples within the Na-HCO3
group may have been affected by oxidation. However, because 1) there is no clear alignment of samples along the oxidation trends, and 2) nearly all δ2H
CH4 values are consistent with regular
(non-oxidized) microbial methane formed in the ambient groundwater, oxidation is not considered a major process in this region, except for shallow Ca-HCO3 samples.
Another process which may affect the isotopic composition of microbial methane is late-stage methanogenesis, which is the result of kinetic isotope effects occurring during transformation of substrates (mostly CO2 in this region) into methane, in a closed or nearly closed reservoir where
the reactant pool is limited (Whiticar, 1999). Methanogens preferentially use isotopically light (12CO
2) molecules, leaving a larger proportion of heavy (13CO2) molecules in the remaining
reactant pool. In parts of the aquifer with active groundwater flow, recharge will bring in fresh DIC, and the isotopic composition of the DIC and CH4 pools may not be perceptibly affected over
time. In contrast, in confined parts of the aquifer where groundwater residence time is long compared to methanogenesis rate, the original reactant pool will be significantly used up and will not be replenished through addition of fresh carbon from recharge. As a result, both the δ13C
DIC
and the δ13C
CH4 will gradually increase. This effect is not observed on the δ2HCH4, as the hydrogen
molecules come from the ambient water (Balabane et al., 1987; Daniels et al., 1980), which is in comparatively unlimited supply. δ13C
DIC values higher than +10‰ are generally considered
unequivocally related to methanogenesis (Sharma and Baggett, 2011), and values as high as +32‰ have been reported (Martini et al., 1998). Reduction of isotopically heavy DIC by methanogens can lead to microbial δ13C
CH4 values in the order of -40‰, i.e. well into the usual
thermogenic domain (Golding et al., 2013; Kotelnikova, 2002).
The evolution of δ13C values in the closed reactant and product pools may be approximated from
Rayleigh’s equations:
Rr,t= Rr,i∙ 𝑓(𝛼∗−1) Eq. 3
Rp,t= Rr,i(1−𝑓𝛼∗
Where R is the isotope ratio (13C/12C) of the reactant (r) or product (p) at time t or initially (i), f is
the fraction of initial substrate remaining at time t, and α* is the reciprocal kinetic isotope fractionation factor. Fractionation factors are usually provided in values >1. In Eq. 3 and 4, to account for the fact that the δ13C in the reactant pool becomes progressively heavier, the
reciprocal of α (α*= 1/α) must be used (Kendall and Caldwell, 1998).
In the Saint-Édouard area, the typical “unaltered” pool of DIC, which is the reactant for the CO2
reduction methanogenic pathway, is expected to have δ13C values in the order of -11 to -16‰
(orange band on Figure 4-A). This is due to the mixing of roughly equal parts of Upper Ordovician marine shaly carbonates (δ13C
DIC ≈ 0‰) and soil CO2 from the decay of modern C3 plants (δ13CDIC
≈ -23 to -27‰) (Clark and Fritz, 1997; Sharma et al., 2013). Even if the proportion of DIC coming from carbonates was to be much higher, it could not produce δ13C
DIC values above ≈ 0‰.
Considering published fractionation factors (α) between 1.050 and 1.100 for the CO2 reduction
methanogenic pathway (Whiticar, 1999), the resulting δ13C
CH4 should be between 60 and
-122‰, i.e. within the usual microbial δ13C
CH4 domain (orange band on Figure 4-A). Part of our
samples are within this expected range, and these are exclusively found in the Na-HCO3 water
type. Several other samples of the Na-HCO3, Na-HCO3-Cl, and Na-Cl water types have
comparatively enriched δ13C
DIC values, reaching up to +32.5‰ in sample F7-deep. The sampling
points with high δ13C
DIC also exhibit some of the highest δ13CCH4.
To verify whether these samples are consistent with late-stage methanogenesis, the theoretical evolution of DIC and CH4 isotopic composition in a closed reservoir was computed. The initial
1760) which are considered “pristine” microbial gas, on the basis of their δ13C
CH4, δ2HCH4 and
δ13C
DIC values, and absence of C2 or C3. These samples are unlikely to be affected by mixing with
thermogenic gas, methane oxidation or late-stage methanogenesis. The δ13C
DIC values in these 7
samples range between -12.3 and -17.5‰. The fractionation factors (α) for transformation of DIC into CH4 were assessed based on the observed isotopic separation factor (Δ= δ13CDIC - δ13CCH4),
considering that:
Δ ≈ 103ln α Eq. 5
The initial δ13C
DIC value used for the late-stage methanogenesis theoretical trend (grey arrow on
Figure 4-A) is the median of the subset of 7 samples (-14.6‰), and the width of the arrow covers the range of computed fractionation factors (1.045 to 1.086).
A large number of samples fit this trend. Particularly, those with δ13C
DIC values >0‰ (which could
therefore not be explained by carbonate dissolution) include F1, F2, F4, F7-deep, F10, F20-shallow, F20-deep, F21-F20-shallow, F21-deep, Zone 10R, and Zone 11R2; they are scattered among the three shale-dominated formations. Five of them (F1, F20-shallow/deep, F21-shallow/deep), located within the Lotbinière and Les Fonds formations of the Sainte-Rosalie Group, were also shown to contain some thermogenic gas. Of note, the thermogenic component within these samples might not shift the δ13C
CH4 values in the samples to a large extent, due to the relatively
similar values associated with late-stage microbial gas (up to -52‰ in well F7-deep, which contains no C2 or C3), especially if the thermogenic gas comes from relatively shallow depths (see
The samples showing high δ13C
DIC also exhibit the highest total dissolved solids (TDS; Figure 4-B),
suggesting a relationship between groundwater salinity and late-stage methanogenesis. The source of salinity in this aquifer was previously identified as being mainly residual Champlain Sea water, which is ubiquitous below a certain depth in the study area (Lefebvre et al., 2015). There is also a small contribution of deep formation brines in some wells (based on Cl/Br ratio and 36Cl
analyses), like in the deepest monitoring well (F21, located near the A267/A275 gas wells pad), or along the Rivière Jacques-Cartier fault and north of it, especially in samples F7-deep and F20-deep (Bordeleau et al., 2018). Samples with the highest salinity were collected in parts of the aquifer where hydraulic conductivities are very low and flow conditions are confined, and where groundwater was among the oldest in the region, based on radiocarbon and tritium data (tritium ≤ 4.7 TU, radiocarbon ≤ 12.2 pmC; Bordeleau et al., 2018). The groundwater age and aquifer characteristics are therefore consistent with an old reservoir where input of fresh carbon from younger water is very limited.
4.3 Alkanes in bedrock versus groundwater
Thermogenic gas was detected in 15% of the groundwater samples; it was therefore important to determine whether it comes from the deep Utica Shale or rather from the overlying thick sequence of shales of the Lorraine or Sainte-Rosalie groups, which constitute the intermediate zone and fractured rock aquifer in their upper part. To do so, groundwater gas data was compared with gas extracted from available shallow core and cuttings samples (0-150 m) and with deep formation gas samples from the Lorraine (600-1900 m) and Utica (1900-2664 m) shales
published by Chatellier et al. (2013) for the following Talisman wells: Saint-Édouard vertical (well A267; 600-2523 m), Saint-Édouard horizontal (well A275; 955-2664 m), and Leclercville horizontal (well A276; 600-1947 m). The latter is located 7 km west of the Saint-Édouard wells.
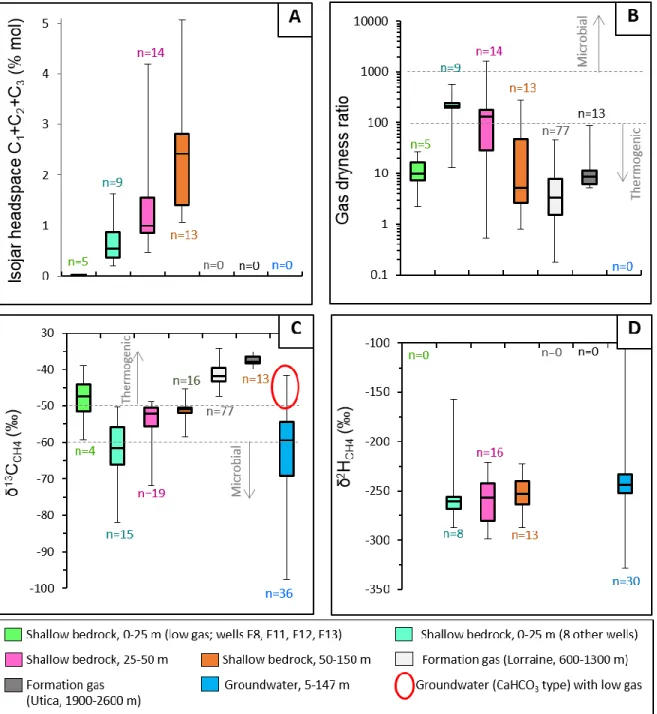
The shallow bedrock gas samples were further subdivided into groups corresponding to depths of 0-25 m, 25-50 m, and 50-150 m, outlining the fact that there is a clear decrease in gas concentrations towards shallower depths (Figure 5-A and Lavoie et al., 2016). Within the shallowest depth range (0-25 m), some of the samples (from wells F8, F11, F12, F13) have remarkably low alkane concentrations; these have been attributed their own category on Figure 5, as they share some distinctive characteristics in terms of dryness ratio and isotopic composition. The general decrease in gas concentrations contained in the bedrock at shallower depths in the aquifer was interpreted to be the result of gas diffusion into groundwater, as most of the groundwater flow takes place at shallow depths (less than 60 m, and especially less than 30 m, due to the higher density and connectivity of open fractures (Ladevèze et al., 2018).
4.3.1 Dryness ratio
Unlike groundwater samples, the dryness ratio in shallow bedrock gas samples is depth-related, with samples from the 50-150 m range having ratios mostly in the thermogenic domain (<100), and shallower samples having increasingly higher ratios, mostly within the mixed thermogenic/microbial gas domain (Figure 5-B). However, the shallowest samples with very low gas concentrations (F8, F11, F12, F13) have low dryness ratios, well within the thermogenic domain. This was interpreted to be caused by oxidation of the gas in the shallower portion of the
aquifer (as was hypothesized for the shallow, Ca-HCO3 type groundwater samples), with
preferential oxidation of methane over higher alkanes (Lavoie et al., 2016). For the deep formation gas samples, the Lorraine samples have lower dryness ratios than the Utica samples, but both are within the thermogenic domain (Figure 5-B). Dryness ratio statistics are not shown for groundwater samples, as 31 out of the 48 samples have unquantified values (see section 4.2.1); the computed values range from 7 to 20,000, therefore spanning the thermogenic and microbial ranges.
4.3.2 Stable isotopic composition of methane
The δ13C
CH4 values in groundwater samples span the same range as those found in shallow
bedrock gas (Figure 5-C), but also contain lower values, indicating a larger contribution of microbial methane in some groundwater samples compared to bedrock. Noteworthy, the relatively high (39 to -59‰) δ13C
CH4 values in samples with very low gas concentration are similar
in both the shallow bedrock and groundwater (Figure 5-C; see red outline for concerned groundwater samples), likely due to methane oxidation. When excluding these particular samples, the range of δ13C
CH4 values in the deep formation gas (from both the Lorraine Group
and Utica Shale) is distinct from the groundwater and shallow bedrock gas.
Of note, the first groundwater sample collected in well Zone 9R (δ13C
CH4= -43.5‰; not shown on
graph) is an exception, as it is isotopically heavier than any of the values found in the shallow bedrock gas samples throughout the area. The value in this sample resembles those of the Lorraine Group gas samples published by Chatellier (2013), and corresponds more precisely to the upper part of the intermediate zone succession where data is available (600-1300 m depth range, as no data is available above 600 m). The result from this Zone 9R sample is different from
the available Utica Shale samples (δ13C
CH4=-35.2 to -39.8‰). However, the gas wells from which
formation gas data (Lorraine and Utica) were obtained are located more to the south, where the Utica Shale is at approximately 2 km depth, while along the Rivière Jacques-Cartier fault where residential well Zone 9R is located, it is much shallower (approximately 500 m on the north side of the fault; Figure 1-B). The lack of formation gas data in the vicinity of the normal fault therefore limits the interpretation of depth provenance for the gas in this groundwater sample. Nonetheless, if it is to correspond to the intermediate-zone Lorraine Group shales in this area, it should not originate from depths greater than approximately 200 to 500 meters.
Methane-δ2H values are similar for shallow bedrock gas samples over the full 0-150 m depth
range, and are within the range of groundwater samples (Figure 5-D). The range for groundwater has a few more extreme values (both heavier and lighter) than shallow bedrock; these values occur in samples with very low methane concentrations. Methane-δ2H values are unfortunately
not available for deep formation gas.
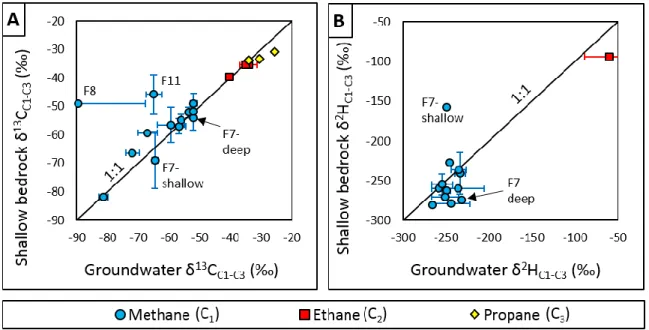
While the isotopic composition of methane in groundwater is consistent with shallow bedrock gas samples, the observed range is very large (Figure 5-C, 5-D). To clearly identify the origin of the gas in groundwater, it was therefore useful to scrutinize data on a well-by-well basis. Groundwater samples were therefore paired with the shallow bedrock gas sample that was collected from the nearest depth in the same well, yielding 13 paired sampling points (Figure 6). Most wells were sampled several times for groundwater, and most bedrock gas samples were collected and analyzed in duplicate or triplicate. All results for a sampling point were combined;
the data symbols on Figure 6 represent the geometric mean, while the full range of values is represented by the error bars.
Generally, δ13C
CH4 values in groundwater samples are similar to, or slightly more negative than
the corresponding bedrock samples (Figure 6-A). The similarity between the two datasets strongly suggests that most of the gas in groundwater comes from diffusion of the gas contained in the bedrock, while more negative values in water samples indicate that there is additional microbial gas production in groundwater. This is particularly apparent in wells F8 and F11, which have very low methane concentrations both in groundwater and in bedrock. The higher bedrock δ13C
CH4 values at these sampling points have been interpreted as partial oxidation of methane.
Considering the very low methane concentration in the bedrock, this gas may not contribute significantly to the gas concentration in groundwater, which is rather produced by microbes directly in the aquifer.
Methane-δ2H values in groundwater also tend to be similar to, or slightly higher than, values in
shallow bedrock gas (Figure 6-B). The exception is well F7-shallow, where the groundwater sample is markedly more negative than the shallow bedrock gas sample. This well is located along the Rivière Jacques-Cartier fault, where an upward flow of saline water (17 000 mg/L TDS) containing a small proportion of formation brine was observed. The methane in groundwater in the upper part of the well (sample F7-shallow, 17.7 m), where fresh water is flowing, is regular microbial gas (no C2-C3, δ13CCH4= -64.6‰, δ13CDIC=-6.1‰). At the bottom of the well (F7-deep, 48
δ13C
DIC= +32.5‰). There seems to be two distinct sources of microbial methane in this well and,
therefore, the upward flow of saline water may be responsible for a decoupling between δ2H
values from the same sampling depth for bedrock and groundwater. Such decoupling is less apparent with δ13C.
4.3.3 Stable isotopic composition of ethane and propane
Ethane and propane concentrations in groundwater were sufficient to allow isotopic analyses in four wells of the Lotbinière Formation, and one well of the Les Fonds Formation (Supplementary Table S-1). Figure 6-A/B, showing the paired groundwater/shallow bedrock samples, confirms that ethane and propane isotopic values are quite similar between bedrock and groundwater samples collected in the same wells. However, the available isotopic values in groundwater and shallow bedrock span the same range as in deep formation gas (results not shown). Therefore, ethane and propane isotopic composition cannot be used to distinguish gas from different formations in our study area, contrary to methane.
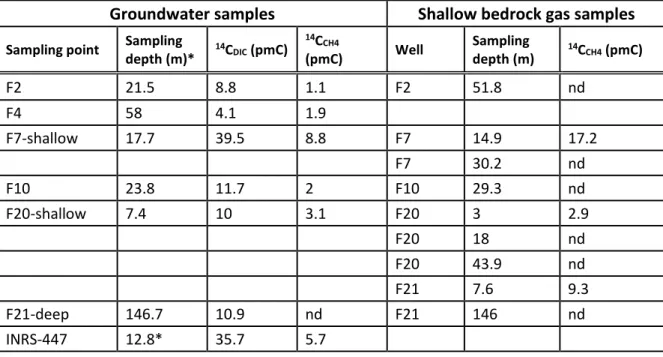
4.3.4 Methane radiocarbon
Methane radiocarbon (14C
CH4) was analysed in seven groundwater samples (F2, F4, F7, F10,
F20-shallow, F21-deep, INRS-447) and nine shallow bedrock gas samples (from wells F2, F7, F10, F20, F21). The objective was to quantify the component of fossil carbon (i.e., no detectable 14C, dating
to more than approximately 50 000 years ago) in methane samples. Individual results are provided in Supplementary Information Table S2, along with corresponding 14C
the 14C
CH4 and 14CDIC values are corrected for fractionation (by converting the measured values to
a common δ13C value of -25‰; section 3.3), direct comparison is possible between the 14C values
of both compounds, thus providing key information about the origin and timing of methane production.
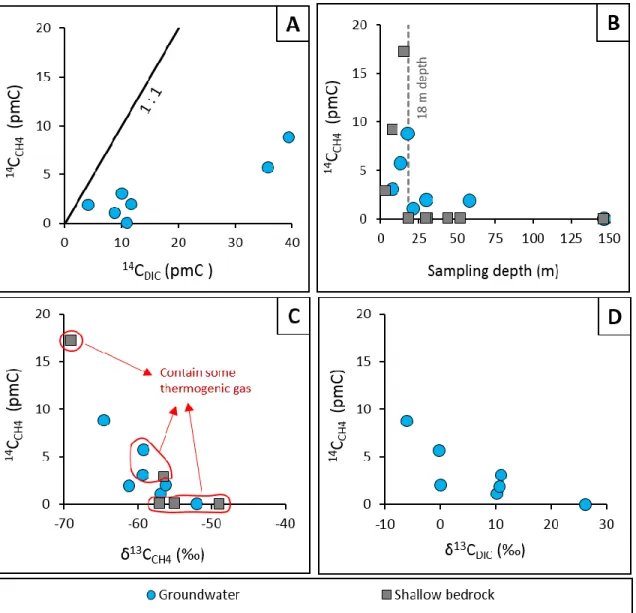
All seven groundwater samples contained detectable 14C in DIC, whereas six contained detectable 14C in methane. While the 14C activity is quite low in most samples, with values between 0 and
39.5 pmC, the presence of 14C confirms a non-fossil (14C-bearing) component to both the
methane and DIC. The measured 14C values do not necessarily represent the “true age” of DIC
and CH4, but most likely an “apparent age” resulting from the combination of more recently fixed
carbon from recharge having occurred in the last few thousand years, and fossil carbon from either the aquifer material or from recharge older than 50 000 years. The occurrence of “recent” recharge (having occurred since the 1950’s) was confirmed by the presence of tritium in all parts of the aquifer, even when under confined conditions (Bordeleau et al., 2018; Lefebvre et al., 2015).
To produce methane via CO2 reduction, which is the dominant pathway in this region, microbes
use the mix of non-fossil and fossil DIC present in the aquifer. This results in the presence of detectable 14C in CH
4, and as long as methane keeps being produced from the available DIC, the 14C
CH4 and 14CDIC activity should be similar. This is not the case in our samples, where the 14CDIC
activity is systematically higher than the 14C
CH4 activity, meaning that methane is comparatively
produced in the distant past (its original 14C having decayed since then), and therefore it does
not correspond to the 14C
DIC currently available in the aquifer. The presence of a fossil (completely 14C-free) methane component of either thermogenic or microbial (via CO
2 reduction) origin in the
aquifer is demonstrated by the absence of 14C
CH4 in well F21-deep. In other wells, fossil methane
may be mixing with some more recent, 14C-bearing methane, which must necessarily be of
microbial origin. Not surprisingly, the proportion of modern methane is greater at shallower depths, being most important within the first 18 m (Figure 7-B).
The fossil methane present in the aquifer may be the result of a contribution of thermogenic gas being released from the fractured rock matrix, in wells where thermogenic gas was detected (Figure 7-C). In other wells, this older methane must have been produced through microbial methanogenesis, indicating that there is both fossil and non-fossil microbial methane in this set of samples. The fossil microbial methane is likely associated with late-stage methanogenesis, as shown by the inverse relationship between δ13C
DIC and 14CCH4 (Figure 7-D). This is not surprising,
as late-stage methanogenesis occurs in old, isolated groundwater reservoirs receiving very little recent recharge.
In bedrock gas samples, 14C
CH4 was only detected in the three shallowest samples (Figure 7-B),
where the δ13C
CH4 values below -60‰ indicate a predominantly microbial origin for methane.
While these three samples were collected in the top part of the aquifer, where the density of fractures is highest and most of the groundwater flow takes place, the groundwater conditions
in these specific wells are nonetheless reducing, and oxygen and sulfate are undetected or very low, which represent favorable conditions for microbial methane production.
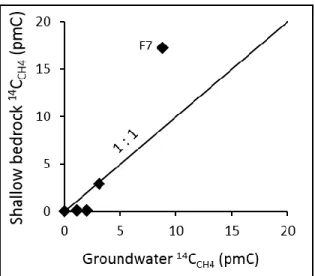
Once again, groundwater samples were matched with bedrock gas samples for a given well and depth, yielding 5 paired sampling points for which 14C
CH4 analyses are available (Figure 8). For
four of these paired sampling points (F2, F10, F20, F21), 14C
CH4 values in groundwater and shallow
bedrock gas are close, providing an additional indication that methane in groundwater is sourced from the local bedrock. In these wells, groundwater methane tends to be slightly more modern than bedrock methane (with maximum differences of 2 pmC), which is to be expected considering that bedrock gas contains comparatively more thermogenic (therefore 14C-free)
methane than groundwater. Opposite results are observed for the fifth paired sampling point (well F7), where the bedrock 14C
CH4 is 17.2 pmC, and groundwater CH4 is comparatively less
modern, with 8.8 pmC. In this well, the shallow bedrock is composed of siltstone and shale interbeds and has the highest hydraulic conductivity of all observation wells (Ladevèze et al., 2016). Therefore, the bedrock aquifer at this location receives significant recharge containing modern DIC and, like in many other wells, the bedrock gas is composed of both thermogenic and microbial methane. In contrast, the water inside the well is greatly influenced by the upward flow of very old, saline groundwater containing late-stage microbial gas, entering the bottom of the well, probably through fractures observed at 45 and 48 m depths. This upward flow causes a decoupling between the groundwater and bedrock gas, as was observed for δ2H
CH4 values (Figure
5 Conclusion
A multi-isotope approach was used to investigate the origins and processes affecting methane in shallow aquifers of the Saint-Édouard area within the St. Lawrence Lowlands (Quebec, eastern Canada). While groundwater in some wells unequivocally contained methane of exclusively microbial origin, the majority had an ambiguous origin, which could not be resolved using only traditional indicators such as gas dryness ratio or δ13C
CH4.
The use of additional parameters (δ2H
CH4, δ2HH2O, δ13CDIC, 14CCH4 and 14CDIC) was key in identifying
processes affecting the isotopic signature of methane in groundwater, such as possible oxidation in shallowest parts of the aquifer where Ca-HCO3 type water is present, or formation of late-stage
microbial gas in deeper parts of the aquifer. Without the use of these parameters, this methane could have been mistaken for thermogenic gas, the latter being truly only present in 15% of the wells.
Furthermore, comparison of isotopic data between groundwater, shallow bedrock gas and deep formation gas made it possible to determine the source (local versus migrated) of the thermogenic gas in the shallow aquifer, which is critical for evaluating aquifer vulnerability to shale gas activities. Comparison of these values strongly suggests that the methane in groundwater is generated within the shallow aquifer (microbial gas) or released from the shallow bedrock matrix (thermogenic or mixed gas). This was observed in all three shale-dominated shallow geologic formations present in the region.
Most importantly, the known regional faults cutting through the shale succession do not seem to convey thermogenic gas from great depths (such as the Utica Shale) towards the surface.
Nonetheless, one sample collected along the normal fault contained thermogenic gas whose isotopic composition advocate for a provenance from the intermediate zone, most probably in the 200-500 meter depth range. The presence of very old, saline water was also observed in another shallow well along this fault, but the methane in this water is of late-stage microbial origin. It therefore appears that the thick succession of locally organic-rich shales constituting the intermediate zone in the Saint-Edouard area acts as an effective barrier (caprock) separating the Utica Shale and the shallow groundwater resources. However, the uncertainty related to the fault zones certainly warrants caution for drilling and hydraulic fracturing in these areas.
Results from this project underline the necessity of conducting comprehensive baseline studies taking into account shallow bedrock geology and major geological features, in order to understand the natural variability of methane in a given region and the vulnerability of aquifers to deep industrial activities. The geochemical framework presented here will hopefully be useful in other research projects, especially when traditional indicators of methane origin provide ambiguous results. To our knowledge, this is the first report of such a diverse set of parameters analyzed both in groundwater and shallow bedrock gas. This was made possible by the drilling of dedicated observation wells, which were critical in acquiring key information on the source of methane, but also to the sampling of residential wells, which provided the spatial coverage necessary in order to grasp the complexity of methane spatial distribution and origins.
Figures
Figure 1. A) Location of the study area, including bedrock geology (based on Thériault and Beauséjour, 2012), major fault zones (Jacques-Cartier River normal fault, and thrust-backthrust fault zone delimited by the Aston Fault and Logan’s Line), the position of the sampled residential and observation wells, and the two shale gas wells, A267 (vertical) and A275 (horizontal), both located on the same well pad. The dotted line represents the cross-section shown below. B) Geological cross-section of the Saint-Edouard area, including the major fault zones, shale gas well A267, the formations constituting the caprock or intermediate zone (Lorraine and Sainte-Rosalie Groups), and the Utica Shale (modified from Lavoie et al., 2016).
Figure 2. A) δ13C
CH4 versus δ2HCH4 values for groundwater samples from the different water types. Ca-HCO3 type samples are not represented as none of them contained sufficient methane for δ2H
CH4 analyses. Typical isotopic domains for thermogenic and microbial gas (shown in black) are based on Whiticar (1999). “Ferment” is for fermentation. B) Dissolved methane δ13C values for the different water types as a function of methane concentration. Samples surrounded by a red outline contain thermogenic gas, based on the presence of C2 and C3.
Figure 3. Dryness ratio (C1/[C2+C3]) of dissolved gas for the different water types, as a function of methane concentration. Of note, 31 out of 48 sampling points (including all Ca-HCO3 type samples) have unquantified ratios and therefore do not appear on the graph.
Figure 4. δ13C
DIC values as a function of A) δ13CCH4, and B) total dissolved solids (TDS). On A), the orange shaded area represents the expected unaltered local δ13CDIC and δ
13
CCH4 range, and the gray arrow represents the late-stage methanogenesis trend.
Figure 5. Gas data from shallow bedrock gas (Lavoie et al., 2016), deep formation gas (Chatellier et al., 2013) and groundwater, including: A) alkane (C1+C2+C3) concentrations in Isojar® headspace, B) gas dryness ratios, C) methane δ13C, and D) methane δ2H. Boxplot whiskers represent minimum and maximum values, box limits correspond to the 25th and 75th percentiles, while the central line corresponds to the median value.
Figure 6. Isotopic values for A) carbon and B) hydrogen contained in methane, ethane and propane for matched groundwater and shallow bedrock samples. Data symbols represent the geometric mean of all samples analyzed for a given sampling point, while the error bars represent the full range of measured values. Sampling points that are specifically addressed in the text are identified.
Figure 7. Methane radiocarbon (14C
CH4) in groundwater and/or shallow bedrock gas samples, as a function of: A) 14C
DIC, B) sampling depth, C) δ13CCH4, and d) δ13CDIC. The error bars representing the analytical uncertainty are not visible as they are smaller than the data symbols.
Figure 8. Methane radiocarbon (14C
References
Alperin, M. M., W. S. Reeburgh, and M. J. Whiticar, 1988, Carbon and hydrogen isotope fractionation resulting from anaerobic methane oxidation: Global Biogeochemical Cycles, v. 2, p. 279-291.
Aravena, R., L. I. Wassenaar, and J. F. Barker, 1995, Distribution and isotopic characterization of methane in a confined aquifer in southern Ontario, Canada: Journal of Hydrology, v. 173 no. 1-4, p. 51-70. Balabane, M., E. Galimov, M. Hermann, and R. Letolle, 1987, Hydrogen and carbon isotope fractionation
during experimental production of bacterial methane: Organic Geochemistry, v. 11, p. 115-119. Baldassare, F. J., M. A. McCaffrey, and J. A. Harper, 2014, A geochemical context for stray gas
investigations in the northern Appalachian Basin: Implications of analyses of natural gases from Neogene-through Devonian-age strata: AAPG Bulletin, v. 98 no. 2, p. 341-372, doi: 10.1306/06111312178.
Barker, J. F. and P. Fritz, 1981, The occurrence and origin of methane in some groundwater flow systems: Canadian Journal of Earth Sciences, v. 18 no. 12, p. 1802-1816.
Bordeleau, G., C. Rivard, D. Lavoie, R. Lefebvre, X. Malet, and P. Ladevèze, 2018, Geochemistry of groundwater in the Saint-Édouard area, Quebec, Canada, and its influence on the distribution of methane in shallow aquifers: Applied Geochemistry, v. 89, p. 92-108.
Boyer, E. W., B. R. Swistock, J. Clark, M. Madden, and D. E. Rizzo, 2012, The impact of Marcellus gas drilling
on rural drinking water supplies.
http://www.rural.palegislature.us/documents/reports/marcellus_and_drinking_water_2012.pdf, accessed December 5, 2017.
Castonguay, S., J. Dietrich, D. Lavoie, and J. Y. Laliberté, 2010, Structure and petroleum plays of the St. Lawrence Platform and Appalachians in southern Quebec: Insights from interpretation of MRNQ seismic reflection data: Bulletin of Canadian Petroleum Geology, v. 58 no. 3, p. 219-234, doi: 10.2113/gscpgbull.58.3.219.

![Figure 3. Dryness ratio (C 1 /[C 2 +C 3 ]) of dissolved gas for the different water types, as a function of methane concentration](https://thumb-eu.123doks.com/thumbv2/123doknet/2933545.78160/39.918.114.751.171.472/figure-dryness-ratio-dissolved-different-function-methane-concentration.webp)