UNIVERSITÉ DU QUÉBEC À RIMOUSKI
Hybridation des sources d’énergie pour la réduction des
émissions des gaz à effet de serre
Mémoire présenté
dans le cadre du programme de maîtrise en ingénierie en vue de l’obtention du grade de maître en sciences appliquées
(M. Sc. A.)
PAR
© Joseph Pemndje
iii
Composition du jury :
Mohamed Yasser Hayyani, président du jury, Université du Québec à Rimouski Adrian Ilinca, directeur de recherche, Université du Québec à Rimouski
Hussein Ibrahim, examinateur externe, ITMI
UNIVERSITÉ DU QUÉBEC À RIMOUSKI Service de la bibliothèque
Avertissement
La diffusion de ce mémoire ou de cette thèse se fait dans le respect des droits de son auteur, qui a signé le formulaire « Autorisation de reproduire et de diffuser un rapport, un mémoire ou une thèse ». En signant ce formulaire, l’auteur concède à l’Université du Québec à Rimouski une licence non exclusive d’utilisation et de publication de la totalité ou d’une partie importante de son travail de recherche pour des fins pédagogiques et non commerciales. Plus précisément, l’auteur autorise l’Université du Québec à Rimouski à reproduire, diffuser, prêter, distribuer ou vendre des copies de son travail de recherche à des fins non commerciales sur quelque support que ce soit, y compris l’Internet. Cette licence et cette autorisation n’entraînent pas une renonciation de la part de l’auteur à ses droits moraux ni à ses droits de propriété intellectuelle. Sauf entente contraire, l’auteur conserve la liberté de diffuser et de commercialiser ou non ce travail dont il possède un exemplaire.
A ma chère et tendre épouse, Christiane Carole, A mes enfants, Perrine, Ryan et Marie Emmanuelle, A mes parents Pierre et Maximilienne.
REMERCIEMENTS
Je rends grâce à Dieu Tout Puissant et Miséricordieux qui m’accompagne tous les jours de ma vie, me donne la force, la santé, l’intelligence et la sagesse pour braver toutes les épreuves qui se dressent devant moi, me relève quand je suis faible et m’ouvre les portes du bonheur et de salut.
Je voudrais adresser mes sincères remerciements à mon directeur de recherche, Professeur Adrian Ilinca, qui a cru en moi en m’accueillant dans son laboratoire et en créant pour moi toutes les conditions optimales pour réaliser ce projet. Merci pour le temps qu’il a bien voulu me consacrer, pour sa patience et ses conseils qui ont contribué à alimenter ma réflexion et redoubler ma motivation pour la réussite de ce travail.
Mes remerciements les plus chaleureux à mes enseignants du département de Génie et à tout le personnel administratif de l’UQAR pour la disponibilité, l’encadrement, l’accompagnement et la promptitude à répondre à toutes mes sollicitations.
Mes remerciements à tous mes collègues de maitrise pour tous les bons et chaleureux moments passés ensemble durant ces deux années d’études.
Je voudrais dire toute ma gratitude à ma chère et tendre épouse Christiane Carole et à mes trésors Perrine, Ryan et Marie Emmanuelle pour leur indéfectible soutien pendant toutes ces deux années études passées loin d’eux. Merci à mes parents, à mes frères et à mes sœurs pour leur prière pour ma réussite.
Enfin, je voudrais remercier tous ceux et toutes celles qui de près ou de loin ont contribué à la réussite du présent travail
RÉSUMÉ
Le présent travail traite des systèmes hybrides de production d’énergies dans deux des secteurs réputés comme les plus polluants : la production de l’électricité et le transport. Le but recherché est de réduire l’impact de l’énergie fossile trop polluante avec des réserves épuisables et dont les coûts sont de plus en plus élevés. A cet effet, des systèmes hybrides (éolien et photovoltaïque avec un système de stockage bien adapté) et un moteur hybride pneumatique ont été développés et simulés respectivement à l'aide des logiciels Homer et GT-Power. Globalement, nous avons démontré que l’utilisation des systèmes hybrides et l’hybridation pneumatique des moteurs diesel ont amélioré les performances de ces systèmes, réduit la consommation des carburants fossiles et les émissions des particules polluantes dans l’atmosphère.
Mots clés: Système Hybride, Énergie Éolienne, Énergie Photovoltaïque, Homer,
ABSTRACT
This paper studies hybrid energy production systems in two of the most polluting sectors: electricity generation and transportation. The aim is to reduce the impact of fossil energy excessively polluting with exhaustible reserves and increasingly high costs. For this purpose, hybrid systems (wind and photovoltaic systems with a well-adapted storage system) and a hybrid pneumatic motor were developed and simulated using the Homer and GT-Power software respectively. Overall, we have demonstrated that the use of hybrid systems and the pneumatic hybridization of diesel engines have improved the performance of these systems, reduced the consumption of fossil fuels and emissions of pollutant particles into the atmosphere
Keywords: Hybrid System, Wind Energy, Photovoltaic Energy, Homer, Diesel
TABLE DES MATIÈRES
REMERCIEMENTS ... IX RÉSUMÉ ... XI ABSTRACT ... XIII TABLE DES MATIÈRES ... XV LISTE DES TABLEAUX ... XVII LISTE DES FIGURES ... XIX LISTE DES ACRONYMES ET DES SYMBOLES ... XXI INTRODUCTION GÉNÉRALE... 1
CHAPITRE 1 IMPACT DE L’UTILISATION DES ENERGIES
RENOUVELABLES SUR LE COUT D’ELECTRICITE ET
L’ENVIRONNEMENT DANS LE NORD CAMEROUN... 5 RESUME DU PREMIER ARTICLE... 5 IMPACT OF USING RENEWABLE ENERGY ON THE COST OF ELECTRICITY AND
ENVIRONMENT IN NORTHERN CAMEROON ... 7 CHAPITRE 2 SIMULATION NUMÉRIQUE SUR GT-POWER DE
L’HYBRIDATION PNEUMATIQUE D’UN MOTEUR DIESEL
FONCTIONNANT EN MODE DE SURALIMENTATION ... 29 2.1 RESUME DU DEUXIEME ARTICLE ... 29 2.2 SIMULATION NUMERIQUE SUR GT-POWER DE L’HYBRIDATION PNEUMATIQUE
D’UN MOTEUR DIESEL FONCTIONNANT EN MODE DE SURALIMENTATION ... 30 CHAPITRE 3 CONCLUSION ... 67 3.1CONCLUSION ET SYNTHESE ... 67
xvi
3.2TRAVAUX FUTURS ... 68 RÉFÉRENCES BIBLIOGRAPHIQUES ... 69
LISTE DES TABLEAUX
Chapitre 1
Table 1 : The geographical coordinates of the selected localities. Erreur !
Signet non défini.
Table 2. Distribution of average hourly energy consumption of the four loads. ... Erreur !
Signet non défini.
Table 3. Annual average need of water and storage capacity. ...Erreur ! Signet non défini. Table 4. Technical Specifications of devices ...Erreur ! Signet non défini. Table 5. Summary of software inputs – Garoua. ...Erreur ! Signet non défini. Table 7. Summary of software inputs – Yagoua. ...Erreur ! Signet non défini. Table 6. Summary of software inputs – Maroua. ...Erreur ! Signet non défini. Table 8. Summary of software inputs – Kousseri. ...Erreur ! Signet non défini. Table 9. Garoua optimization results, in a categorized form, ranking according to the NPC
of each system type. ...Erreur ! Signet non défini. Table 10. Maroua optimization results, in a categorized form, ranking according to the NPC
of each system type. ...Erreur ! Signet non défini. Table 11. Yagoua optimization results, in a categorized form, ranking according to the NPC
of each system type ...Erreur ! Signet non défini. Table 12. Kousseri optimization results, in a categorized form, ranking according to the
NPC of each system type. ...Erreur ! Signet non défini. Table 13. Comparative emission of polluting particles between the two solutions in the four
areas of the study. ...Erreur ! Signet non défini.
Chapitre 2
Tableau 1: Calcul des coefficients pour le transfert de chaleur [36] ... 49 Tableau 2 : Paramètres de base du prototype du moteur étudié ... 54 Tableau 3 : Masse spécifique indiquée des émissions de gaz ... 61
LISTE DES FIGURES
Figure 1: Emissions globales du CO2 dans le monde issues de la combustion des fossiles
par secteur d'activités en 2014 [1] ... 1
Fig. 1. Example of a small-scale Wind-PV system. ... 8
Fig. 2. Map of Northern Cameroon showing the four locations of the study. ... 9
Fig. 3. Monthly variations of average wind speed at 50 m height. ... 11
Fig. 4. Daily radiation and clearness index in (a) Garoua; (b) Maroua; (c) Yagoua; and (d) Kousseri. ... 12
Fig. 5. Schematic illustration of PV-Wind based energy system. ... 16
Fig. 6. Monthly average electric production in the case of the BRF for (a) Garoua; (b) Maroua; (c) Yagoua; and (d) Kousseri. ... 22
Figure 1: Concentration moyenne mensuelle en dioxyde de carbone mesurée au volcan Mauna-Loa (Hawaï) [1]. ... 30
Figure 2: Cours du baril de pétrole en dollars (moyennes mensuelles) [4] ... 32
Figure 3: Moteur diesel 645E3B[7] ... 35
Figure 4: Le New Train japonais et sa gestion énergétique [3] ... 36
Figure 5: Architecture des Green Goats (GG20B) [3] ... 37
xxi
Figure 7: Diagrammes pression-volume mesurés et simulés par I. Vasile [26]. (a): Moteur
pneumatique 2-temps et (b): Pompe pneumatique 2-temps ... 41
Figure 8: Mesures de pression réalisée par S Trajkovic [30] dans le port de charge. (a) : Mode pompe pneumatique et (b) : mode moteur pneumatique ... 42
Figure 9: Mesures de diagrammes p-V réalisées par C Donitz [9]. (a) : Moteur pneumatique 4-temps et (b) : Pompe pneumatique 4-temps ... 43
Figure 10: Cycles théoriques 4-temps (a): mode pompe pneumatique; (b): mode moteur pneumatique et (c): mode suralimentation [4] ... 46
Figure 11: Barré de Saint Venant [5] ... 51
Figure 12: Géométrie d'une soupape [38] ... 52
Figure 13: Modèle d'un moteur hybride pneumatique sur GT-Power ... 53
Figure 14 : Profil d’ouverture et de fermeture de la soupape de charge ... 55
Figure 15: Diagramme p-V du moteur en mode combustion pour N=3500 tr/min ... 56
Figure 16: Performances indiquées du moteur en mode combustion conventionnelle ... 56
Figure 17: Consommation spécifique indiquée du carburant ... 57
Figure 18: Diagramme p-V en mode moteur hybride. Pression du réservoir: 2.5 bars (a); 3.5 bars (b) et 5 bars (c). ... 58
Figure 19: Pression moyenne indiquée. (a) Moteur conventionnel ; (b) Mode moteur hybride, Pression du réservoir = 5 bars ... 59
Figure 20: La puissance du moteur à différentes valeurs de la pression ... 60
Figure 21: La consommation spécifique indiquée du carburant prise à différentes valeurs de la pression d’admission ... 61
LISTE DES ACRONYMES ET DES SYMBOLES
Note : Une grande partie des acronymes et symboles sont définis dans le texte au fur et à
mesure qu’ils apparaissent. Nous donnons ci-après les définitions de ceux qui ne sont pas définis dans le texte.
ACRONYMES
FTP Federal test procedure GES Gaz à effet de serre GPL Gaz de pétrole liquéfié
NASA National Aeronautics and Space Administration PME Pression moyenne effective
SYMBOLES
Aj Aire de surface à la frontière j
D Diamètre du piston
L Bielle
Mvéhicule Masse du véhicule
P Pression
Patm Pression atmosphérique
P0 Pression de la chambre de combustion à la fermeture de la soupape d’admission
PSC Pression des gaz dans la chambre avant la combustion
R Constante des gaz parfaits T Température
U Energie interne du système
U0 Energie interne de l’environnement
V0 Volume de la chambre de combustion à la fermeture de la soupape d’admission
xxiii
𝜁 Entropie du système
𝜁0 Entropie de l’environnement 𝛾 Indice adiabatique
INTRODUCTION GÉNÉRALE
La production et l’utilisation des énergies issues des combustions sont la plus importante source humaine d’émission de polluants atmosphériques : elles comptent pour 85% des émissions de particules et pour la quasi-totalité de celles d’oxydes de soufre et d’azote. Deux secteurs d’activités humaines produisent à elle seule près des deux tiers des émissions globales de CO2 dans l’atmosphère : le secteur de production de l’électricité et de la chaleur qui compte pour 45% des émissions polluantes et celui des transports qui compte pour 23%. (Figure 1).
Figure 1: Emissions globales du CO2 dans le monde issues de la combustion des fossiles par secteur d'activités en 2014 [1]
2
Le secteur de l'électricité est unique parmi les secteurs industriels à cause de ses émissions qui contribuent largement à la quasi-totalité des problèmes de qualité de l'air. La production d'électricité est à l'origine d'une grande partie des émissions d'oxydes d'azote et de dioxyde de soufre, qui contribuent au smog, aux pluies acides et à la formation de particules fines. C'est la plus grande source industrielle non réglementée d'émissions de mercure. Les centrales électriques émettent aussi du dioxyde de carbone, un gaz qui contribue au changement climatique. En outre, le secteur a des impacts considérables sur les plans d'eau, les habitats et les espèces. Par exemple, les barrages hydroélectriques et les lignes à haute tension ont une influence majeure sur les cours d'eau et la biodiversité. Les installations qui produisent de l'électricité sont les centrales thermiques au charbon, au mazout et au gaz naturel (énergies renouvelables à faible impact). Ces unités peuvent également produire d'autres formes d'énergie comme de la chaleur et de l'énergie mécanique dans les systèmes de production combinés énergie-chaleur.
Le secteur des transports pèse fortement dans le bilan global des émissions des GES et des substances impliquées dans la pollution atmosphérique. En effet, la quasi-totalité des moyens de transport (automobile, ferroviaire, maritime, aérien…) utilise la combustion des fossiles pour leur propulsion. Par ailleurs, les trois-quarts des émissions de TSP (particules totales en suspension) proviennent de l’usure de la route, des plaquettes de freins et des pneus. Les émissions liées à l’abrasion représentent plus de la moitié des PM10 (particules en suspension de taille inférieure ou égale à 10 m) et plus du tiers des PM2,5 (particules en suspension de taille inférieure ou égale à 2,5 m). Les émissions de polluants des transports sont d’autant plus nocives pour la santé que les rejets se produisent surtout en milieu urbain, à proximité des populations. Les particules, notamment les plus fines, sont un indicateur pertinent pour les risques sanitaires du fait de leur nocivité. C’est aussi le cas des émissions d’oxydes d'azote (NOx) parce qu’elles sont fortement corrélées aux émissions de nanoparticules provenant des pots d’échappement.
La volonté de maîtrise de l’amplitude du réchauffement climatique, associée à la sévérité de plus en plus accrue des normes anti-polluantes et l’augmentation des prix des
3
carburants d’origine fossile ont conduit à des mutations culturelles et technologiques importantes. Ce qui justifie l’intérêt, toujours en progression, de la communauté scientifique mondiale sur cette thématique.
Le présent travail s’inscrit dans cette continuité. Il s’agit d’investiguer et de proposer des solutions qui combinent les systèmes de production d’énergies conventionnelles (fossiles), dont l’efficacité jusqu’à ce jour ne souffre d’aucune contestation malgré le mauvais impact sur l’environnement, et des solutions nouvelles issues des sources renouvelables et/ou non polluantes afin de réduire la part de l’énergie des fossiles tout en boostant le rendement et l’efficacité desdits systèmes. De tels systèmes sont dits hybrides à sources d'énergie renouvelables (SHSER) [2]. De façon générale, on définit un système hybride à sources d'énergie renouvelables comme étant un système électrique, comprenant plus d'une source d’énergie, parmi lesquelles une au moins est renouvelable. Le système hybride peut comprendre un dispositif de stockage. Si cette définition renvoie plus à la production de l’électricité, notons que l’hybridation peut aussi concerner les secteurs du transport tels l’industrie automobile ou encore le ferroviaire pour ne citer que ceux deux-là.
Notre travail se décline en deux parties portant respectivement sur la production de l’électricité et le transport, les deux secteurs les plus polluants tels qu’expliqué plus haut (Figure 1). La première partie détermine et compare le coût de revient l'énergie (COE) de divers systèmes hybrides (Wind-PV) pour quatre installations hors réseau dans les régions du Nord et de l’Extrême Nord du Cameroun en intégrant des sources renouvelables et des systèmes de stockage avec des générateurs diesel modélisées à partir du logiciel HOMER. La deuxième partie porte sur une étude numérique de l’hybridation pneumatique d’un moteur diesel utilisé dans le ferroviaire. L’étude se base sur le concept de récupération de l’énergie de freinage pour le stocker sous forme d’air comprimé en vue de son utilisation pour suralimenter le moteur. Les simulations ont été réalisées sur le logiciel GT-Power.
CHAPITRE 1
IMPACT DE L’UTILISATION DES ENERGIES RENOUVELABLES SUR LE COUT D’ELECTRICITE ET L’ENVIRONNEMENT DANS LE NORD
CAMEROUN
RESUME DU PREMIER ARTICLE
Cet article détermine et compare les coûts de revient de production d’énergie par des systèmes hybrides constitués de sources d’énergie renouvelables et systèmes de stockage combinés à des générateurs diesel dans quatre sites hors réseau situés dans les régions du Nord et de l’Extrême Nord du Cameroun. Une estimation des potentiels énergétiques éolien et solaire photovoltaïque basée sur les données météorologiques fournies par la NASA est également faite. Ainsi, des modèles de systèmes hybrides constitués de panneaux PV, d’éoliennes, de batteries, de convertisseurs et de générateurs diesel ont été réalisés et simulés à l’aide du logiciel HOMER pour fournir de l’énergie dans ces sites. Les paramètres retenus pour l’étude à savoir l’investissement initial, le coût de revient, le taux de pénétration en énergie renouvelable, la consommation du fuel et les émissions des gaz à effet de serre ont été comparés sur une période fonctionnement de 25 ans avec les données résultantes de l’utilisation du diesel uniquement. Il a été démontré l’utilisation des énergies, malgré le fait qu’elle nécessite de gros investissement au départ, est la plus économique, la plus rentable et laisse un faible impact sur l’environnement.
Ce premier article, intitulé « Impact of Using Renewable Energy on the Cost of Electricity and Environment in Northern Cameroon», a été rédigé par moi-même sous la supervision du professeur Adrian Ilinca. Il a été accepté pour publication dans sa version finale en mai 2017 par les éditeurs de la revue Journal of Renewable Energy and
6
Environment (JREE) et est actuellement sous presse. En tant que premier auteur, ma contribution à ce travail fut l’essentiel de la recherche sur l’état de l’art, le développement de la méthode, la recherche des données météorologiques, l’exécution des tests de simulation et la rédaction de l’article. Le professeur Adrian Ilinca, second auteur, a fourni l’idée originale, supervisé tout le travail et aidé à la révision de l’article. Théophile Rufin Tene, troisième auteur, a contribué à la collection des données sur les charges au niveau des différents sites au Cameroun sous la supervision du professeur René Tchinda.
7
IMPACT OF USING RENEWABLE ENERGY ON THE COST OF ELECTRICITY AND ENVIRONMENT IN NORTHERN CAMEROON
J. Pemndje1a,b A. Ilincab , T. R. Tene Fonganga, R. Tchindac
a Local Materials Promotion Authority/MIPROMALO, PO Box: 2396, Nkolbikok, Yaoundé, Cameroon b Wind Energy Research Laboratory (WERL), UQAR, 300, allée des Ursulines, Québec, Canada G5L 3A1
c IUT Fotso Victor of Bandjoun, University of Dschang, P.O. Box 134, Bandjoun, Cameroon
Abstract
This paper determines and compares the cost of energy (COE) of various hybrid systems for several off-grid facilities in North and Far North regions of Cameroon by integrating renewable sources and/or storage with diesel generators. The estimated annual energy production by solar PV systems and wind turbines, based on meteorological data provided by NASA, is also discussed. A hybrid system using photovoltaic panels, wind turbines, diesel generators, batteries and converter was designed using HOMER software to supply electricity to these off-grid facilities. Parameters such as investment, cost of energy, total cost, renewable energy fraction, fuel consumption, and greenhouse gas (GHG) emission have been compared over 25 years operation with the use of diesel generators only. It is shown that the use of renewable energies (wind and photovoltaic), despite the fact that it requires large investments initially, is the most economical, most profitable and least polluting system.
Key words: Hybrid System, Cameroon, Wind Energy, Photovoltaic Energy, Homer.
1. Introduction
Energy is considered as a prime agent in the generation of wealth, a significant factor in the economic development, and as a driving force for industrialization [1]. Cameroon is well known for its reserves of oil and gas, abundance of firewood and for its
8
capability to produce hydroelectric energy. It should be recalled that Cameroon has the second-largest hydropower potential in Africa after the Democratic Republic of Congo. Yet, according to statistics from the Ministry of Water resources and Energy of Cameroon, only 5% of these resources are currently developed. Furthermore, fossil fuels are becoming increasingly expensive each year and are not readily available in some remote areas. This causes a low electricity access rate, estimated at 22% [2]. The great gap between supply and demand results in electricity rationing and intermittent power outages across the country.
It is clear that the solutions proposed to date are essentially based on the use of fossil fuels and hydropower. Yet, recent studies have revealed other alternatives [3] through wind power in the northern regions [4, 5] or solar energy [6] for the production of electricity. The present work covers the design of a solar-wind hybrid energy system and energy storage producing usable electricity as a support system and redress in case of failure of the existing network (Fig. 1). The aim is to set up a system with a high penetration of renewable energy sources to replace existing diesel generators, frequently used as the only alternative energy. This project is underway as part of Local Materials Promotion Authority/MIPROMALO activities aimed to contribute to sustainable development in accordance with the Kyoto Protocol [7, 8].
9
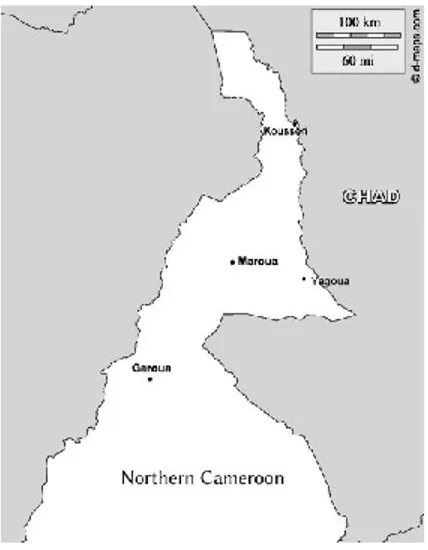
Data collected in four facilities in the North and Far North regions of Cameroon (Fig. 2) was used in this study [9]. There is a research center in Garoua, a small-medium size enterprise (SME) specialized in the production of agricultural equipment in Maroua, a poultry farm in Yagoua and a health center in Kousseri. The Northern part of Cameroon is part of the Sahel region with high potential in solar [6] and wind energies. The annual and monthly mean wind speeds are the highest in the country. For each of these four facilities, hybrid system models were developed to get the most energy according to weather data and at the lowest possible cost.
Fig. 3. Map of Northern Cameroon showing the four locations of the study.
Different approaches and/or software solutions have been used to simulate and optimize the performance of hybrid energy production systems such as ARENA, Opt-Quest tool [10-12], Matlab / Simulink [13], Response Surface Metamodels (RSM) [10] or Genetic Algorithms (GA) [14]. In this project we have used HOMER [15, 16] which is a design and analysis software for hybrid systems. It is worth mentioning that Kenfack et al. [17] studied a hybrid PV micro-hydro system at Batocha in Cameroon using HOMER software for design and optimization. Kanase-Patil et al. [18] studied the electrification of seven villages, off the grid in the district of Almora Uttarakhand state, India. Moreover, biomass, solar, hydroelectric sources and wind energy have been examined and analyzed using
10
LINGO and HOMER software. Bakos [19] studied the feasibility of a hydro-wind hybrid system to electrify remote islands in Greece using the Monte Carlo simulation program. Connolly et al. [20] and Chauhan et al. [21] have made a comparative study of several computer tools for the integration of renewable resources in the different energy systems. HOMER software is one of the most used software for optimization, feasibility and analysis of hybrid power systems.
2. Areas of Study and Meteorological Data
The geographical coordinates of the selected locations are given in Table 1. These are the towns of Garoua, Maroua, Kousseri and Yagoua. All four cities are located in the North of Cameroon. Meteorological data (wind speed, solar radiation, and clearness index) used in this study are those provided by NASA through Homer software [22]. The data represents the monthly average solar values of Global Horizontal Irradiance over a 22-year period (July 1983 – June 2005) and the monthly average wind speed data over a 10-year period (July 1983 – June 1993). Recent work of Kidmo et al. [23-26] in this region has shown that this data has not undergone any significant changes in the last twenty years.
Table 1 . The geographical coordinates of the selected localities. locations Latitude °N Longitude °E Elevation (m)
Garoua 9.3 13.4 332
Maroua 10.6 14.3 394
Yagoua 10.4 15.2 311
Kousseri 12.08 15.03 295
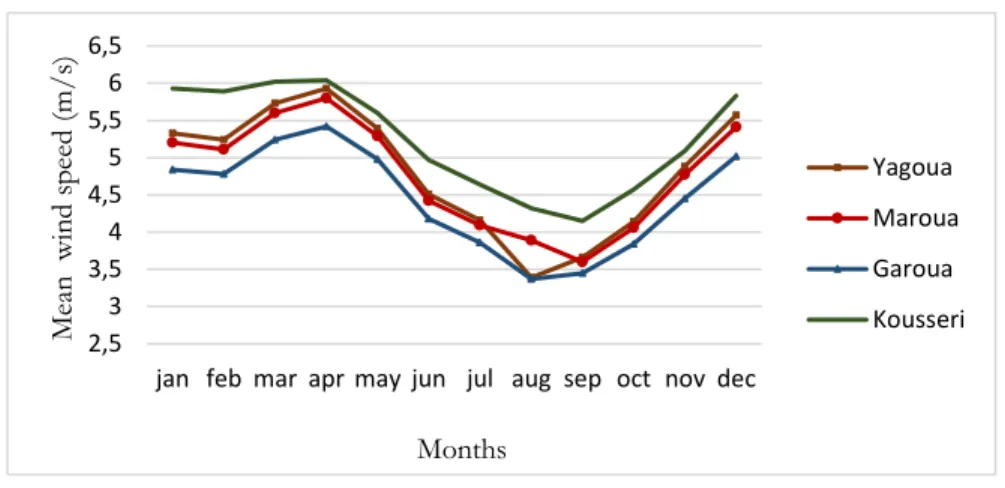
The average monthly wind speeds, measured at 50 m height, vary almost identically during the year in the four locations (Fig. 3). They all reach their maximum values in April. The highest monthly average speed is recorded in Kousseri with 6.04 m/s while the lowest was observed in Garoua with 3.37 m/s [27].
11
Fig. 4. Monthly variations of average wind speed at 50 m height.
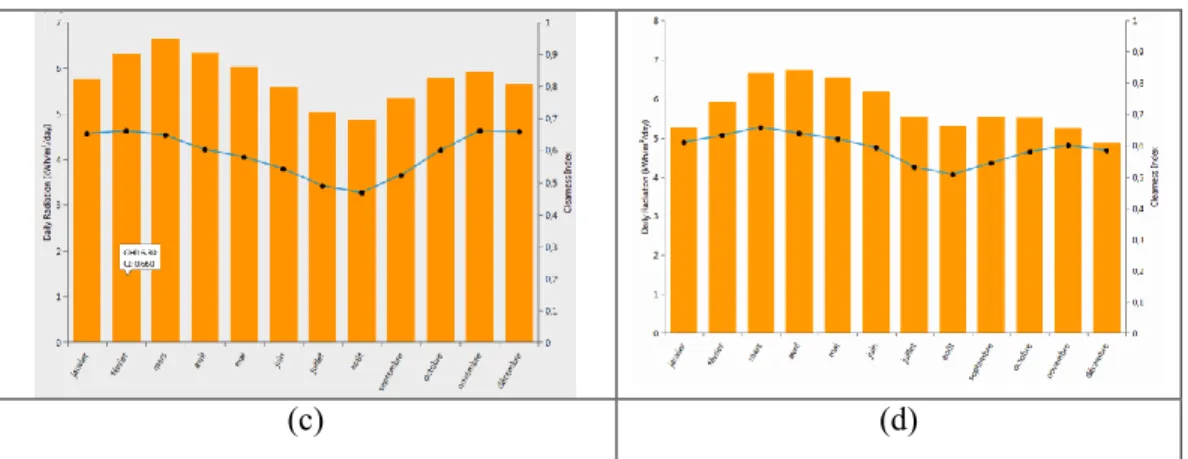
Fig. 4 shows the monthly average daily solar radiation horizontal and clearness indices at the four locations. The greatest value of solar radiation is 6.73 kWh/m2/d in
Kousseri during the month of April while the smallest value, 4.83kWh/m2/d, is in Garoua
during the month of August. In general, the annual average value in the four locations is above the 5.70 kWh/m2/d.
On a scale from 0 to 1, we see that the monthly average of sky clearness index is around 0.5. This tells us that the sky is always clear. The highest value was observed in Garoua with 0.681, while the lowest value was observed in Garoua and Maroua with 0.465.
(a) (b) 2,5 3 3,5 4 4,5 5 5,5 6 6,5
jan feb mar apr may jun jul aug sep oct nov dec
Me an win d sp ee d (m/ s) Months Yagoua Maroua Garoua Kousseri
12
(c) (d)
Fig. 5. Daily radiation and clearness index in (a) Garoua; (b) Maroua; (c) Yagoua; and (d) Kousseri.
3. Mathematical Model for Renewable Energy Sources 3.1. Mathematical model of the wind power system
The wind speed is a factor that varies continuously at a given site. It depends on the physical and geographical characteristics (topography, canopy, hydrography, etc.), the weather and the height from the ground. It is crucial to correctly estimate the variations and control the production of wind energy. There are different probability density functions that can be used to statistically describe the wind speed data. The most common is Weibull distribution with its particular case (for a shape factor k=2) the Rayleigh distribution. Weibull function is a special case of the generalized gamma distribution with two parameters. Rayleigh distribution is a subset of the Weibull distribution characterized by one parameter. Therefore, Weibull distribution is more flexible while Rayleigh is easier to use if not enough data is available [28, 29]. Weibull distribution is the most used as it provides the best fit on most sites for the monthly measurements of wind speed [28, 30, 31]: f(V, k, c) = (k c) ( V c) k−1 exp [− (V c) k ] (1)
13
Where, 𝑓(𝑉, 𝑘, 𝑐) = the probability of observing the wind speed ; 𝑐 = scale factor (m/s) and 𝑘 = shape factor (dimensionless). An acceptable approximation of 𝑘 is given by the following expression [32]:
k = (σ
Vm)
−1,086
(2) Where, 𝜎 is the standard deviation and 𝑉𝑚 is the average wind speed (m/s). For values of k between 1.6 and 3.0, the factor c can be calculated within an error of approximately 1% by the following expression [33]:
c ≅2Vm
√π (3)
The output power (𝑃𝑜,𝑤𝑒) and the capacity factor (𝐶𝑓) are two important parameters of wind energy conversion system (WECS). (𝑃𝑜,𝑤𝑒) determines the total amount of produced energy, and the (𝐶𝑓) is the fraction of the output power over the nominal electric
power 𝑃𝑒𝑅 of the turbine [28, 32, 34]. These two parameters are calculated using the following formulas [28, 32]: Po,we = PeR( e(Vcc) k −e(Vrc) k (Vr c) k −(Vc c) k − e (Vfc) k ) (4) Cf= Po,we PeR (5)
Where, 𝑉𝑐, 𝑉𝑟 and 𝑉𝑓 are the cut-in wind speed, rated wind speed, and cut-off wind speed, respectively.
The total annual energy production is given by: E̅a,we = 365 × 24 × (∑Vf Pout
V=0 × f(V, k, c)) (6)
In most situations, the measurement height of wind speeds is different from the height of the hubs installed wind turbines. These speeds may be adjusted using the following relation [4, 28, 32]:
14 V V0 = ( h h0) α (7) Here, 𝑉 is the wind speed at the height h of the turbine hub, 𝑉0 is the wind speed at the reference height ℎ0 and 𝛼 is the coefficient that characterizes the roughness of the site. It is taken to be 0.20 in most cases [32].
3.2. Mathematical Model of the Solar System
Photovoltaic energy originates from the solar radiation that reaches the surface of the earth. The solar radiation depends on the orientation and inclination of the incident surface, the latitude of the location and degree of pollution, the period of year, the time of day, and the nature of the cloud layers. The total hourly solar radiation 𝐼𝑡 over a sloping surface is estimated as [18, 21]:
It = IbRb+ IdRd+ (Ib+ Id)Rr (8)
where, 𝐼𝑡 is expressed in kWh/m2, 𝐼
𝑏 and 𝐼𝑑 are respectively the beam part of solar radiation
and the diffused part of solar radiation, both expressed in kWh/m2, 𝑅
𝑏, 𝑅𝑑 and 𝑅𝑟 are
respectively the tilt factor for beam radiation, the tilt factor for diffused radiation and the tilt factor for reflected radiation.
The power output of a PV system 𝑃𝑝,𝑠𝑒 is calculated from the expression [18, 21]:
Pp,se = ηItA (9)
Where, 𝜂 is the conversion efficiency of the photovoltaic system and A is the area of the photovoltaic system.
The total annual energy produced by the system is given by the following expression:
E
̅a,se= ∑8760Pp,se(i)
i=1 (10)
4. Loads Definition
It is important to define the electrical loads of the photovoltaic–wind (PV-W) system as they affect the cost, size, and project feasibility. The capacity of the energy
15
storage component (such as batteries) depends on the number of hours of operation of the PV-W system per day. In this work, the following four loads are considered:
- A research center in Garoua with major laboratory equipment, a water pumping station, computer equipment, air conditioning, lighting, etc.;
- A SME in Maroua specialized in the production of agricultural equipment with several high-power machines, a water pumping station, computer equipment, air conditioning, lighting, etc.;
- A poultry farm in Yagoua with an electric heating system, several medium-power machines, a water pumping station, lighting, etc.;
- A health center in Kousseri with medical equipment, air conditioning, a water pumping station, lighting, etc.
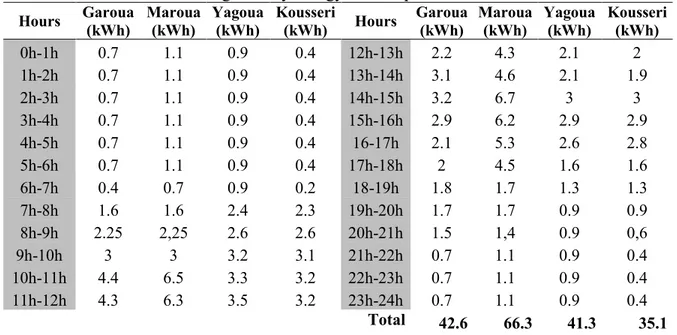
Table 2 shows the average hourly distribution of energy consumption in the four loads. Maroua has the highest load with daily energy consumption of 66.65 kWh; this is the result of the frequent use of high power transformer machines at this location. The lowest charge is that of Kousseri at 35.2 kWh per day. In general, the average hourly energy consumption distribution in a day's work shows that the energy consumption is higher in the intervals of 10 to 12 a.m. and 2 to 4 p.m., which corresponds to the periods of more intense activity.
Table 2. Distribution of average hourly energy consumption of the four loads.
Hours Garoua (kWh) Maroua (kWh) Yagoua (kWh) Kousseri (kWh) Hours Garoua (kWh) Maroua (kWh) Yagoua (kWh) Kousseri (kWh)
0h-1h 0.7 1.1 0.9 0.4 12h-13h 2.2 4.3 2.1 2 1h-2h 0.7 1.1 0.9 0.4 13h-14h 3.1 4.6 2.1 1.9 2h-3h 0.7 1.1 0.9 0.4 14h-15h 3.2 6.7 3 3 3h-4h 0.7 1.1 0.9 0.4 15h-16h 2.9 6.2 2.9 2.9 4h-5h 0.7 1.1 0.9 0.4 16-17h 2.1 5.3 2.6 2.8 5h-6h 0.7 1.1 0.9 0.4 17h-18h 2 4.5 1.6 1.6 6h-7h 0.4 0.7 0.9 0.2 18-19h 1.8 1.7 1.3 1.3 7h-8h 1.6 1.6 2.4 2.3 19h-20h 1.7 1.7 0.9 0.9 8h-9h 2.25 2,25 2.6 2.6 20h-21h 1.5 1,4 0.9 0,6 9h-10h 3 3 3.2 3.1 21h-22h 0.7 1.1 0.9 0.4 10h-11h 4.4 6.5 3.3 3.2 22h-23h 0.7 1.1 0.9 0.4 11h-12h 4.3 6.3 3.5 3.2 23h-24h 0.7 1.1 0.9 0.4 Total 42.6 66.3 41.3 35.1
16
The water pumping is considered as a deferrable load. Table 3 presents the annual average need of water per day and the storage capacity of each site. The pump used in this study draw 1300 W of electric power and pumps 4.5 m3 per hour. The minimum load ratio
for each site is 25%.
Table 3. Annual average need of water and storage capacity.
Sites Garoua Maroua Yagoua Kousseri
Annual average (kWh/d) 0.9 1.07 1.13 1.03
Storage capacity (kWh/d) 2.5 2.5 3.75 2.75
5. Technical Specifications of the Hybrid Solar-Wind (PV-W) System
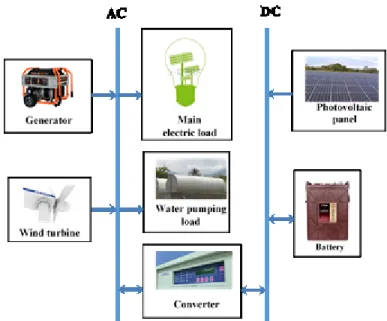
Fig. 5 shows the basic outline of the integrated PV-W with optional diesel generator. The control system is at the heart of the PV-W. It provides communication between the various system components.
17
The proposed configuration for HOMER simulation uses a DC and an AC bus as illustrated in Fig. 6. PV solar panels and batteries are connected to the DC bus while diesel generator, wind turbines and loads are connected to AC bus. The size of the different components of the hybrid system with battery storage and backup diesel generator is chosen to (1) maximize the percentage of renewable power in total annual energy (2) provide a significant reduction of the use of the diesel generator and on/off cycling, (3) provide a significant reduction in fuel consumption and GHG emissions compared to diesel operation only, (4) maintain high reliability of electric power supply as required by the load systems [35-38]. The system has been designed so that the batteries provide at least 20 hours of autonomy to full load. The operating capacity power (generators, wind turbine and photovoltaic panels) is always greater than the load. Therefore, the capacity shortage is null. Technical specifications of devices (wind turbines and solar panels) are presented in Table 3. The Aeolos-H 3kW wind turbine selected in the present study has the advantage to operate in low wind speed as it is the case in all sites. To increase system reliability during generator maintenance and to avoid the operation under the minimum load ratio of the generator (25%), we selected two generators of different sizes in each site so that the smallest size can operate at lower load. We model both Load Following (LF) and Cycling Charging (CC) strategies available in Homer software so that the optimal one is chosen for each case [16].
Table 4: Technical Specifications of devices
The wind turbine Aeolos-H 3kW The photovoltaic panel THINK-240
Power 3 kW Power class 240 Wp
Type 3 phases permanent magnetic generator Open circuit voltage (Voc) 36.8 V
Rotor diameter 5.0 m Short circuit current (Isc) 8.32 A
Start wind speed 2.5 m/s Maximum voltage (Vmp) 30.0 V
Rated wind speed 10 m/s Maximum current (Imp) 7.83 A
Working speed 2.5-45 m/s Module efficiency (%) 14.8
voltage 220V-240V Maximum system voltage 600 V
18
6. Simulation Results and Discussion
6.1. Presentation of the simulation software HOMER
HOMER is the design and analysis software used in this study to analyze the performance of the hybrid system. Based on an hourly balance between power production and load demand, it explores a large number of technical configurations and compares them based on kWh price, renewable fraction, etc.
For financial analysis, we used 8% interest rate and 2% inflation rate (these values are common for the financial analysis of such type of project; some adjustments may be required at further stage of project development) [39]. The cost of fuel used in the analysis is 1.3$/liter, the market price in Cameroon starting January 2016 [40].
Technical specifications, prices (given in Canadian dollars), lifetime expectancy and parameters used in HOMER simulation for the four sites are presented in Tables 4 to 7. The information was gathered from web sites or direct communication with equipment manufacturers [41]
Table 5. Summary of software inputs – Garoua.
Item Capacity (kW) Capital($) Replacement ($)
O & M cost
($/yr) Size considered (kW) considered Quantities Life time THINK-240 PV 1 5 000 5 000 40 0-5-6-7-7.5 25 years Aeolos-H 3kW wind turbine 1 (unit) 13 500 13 500 100 0-3 0-1 25 years Generator (Generac 5kW) 1 800 800 0.08 ($/hr) 0-5 25 000 h Generator (Generac 1kW) 1 800 800 0.08 ($/hr) 0-1 25 000 h Battery (Trojan L16P) 1(unit) 500 500 0.5 0-20-25-30
Converter (Leonics) 1 800 800 40 0-5-6 15 years
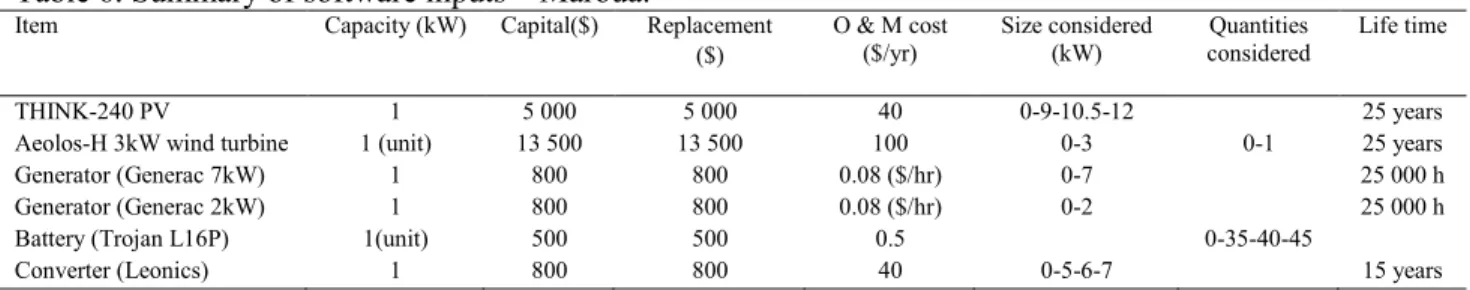
Table 6. Summary of software inputs – Maroua.
Item Capacity (kW) Capital($) Replacement ($)
O & M cost
($/yr) Size considered (kW) considered Quantities Life time THINK-240 PV 1 5 000 5 000 40 0-9-10.5-12 25 years Aeolos-H 3kW wind turbine 1 (unit) 13 500 13 500 100 0-3 0-1 25 years Generator (Generac 7kW) 1 800 800 0.08 ($/hr) 0-7 25 000 h Generator (Generac 2kW) 1 800 800 0.08 ($/hr) 0-2 25 000 h Battery (Trojan L16P) 1(unit) 500 500 0.5 0-35-40-45
19
6.2 Results analysis
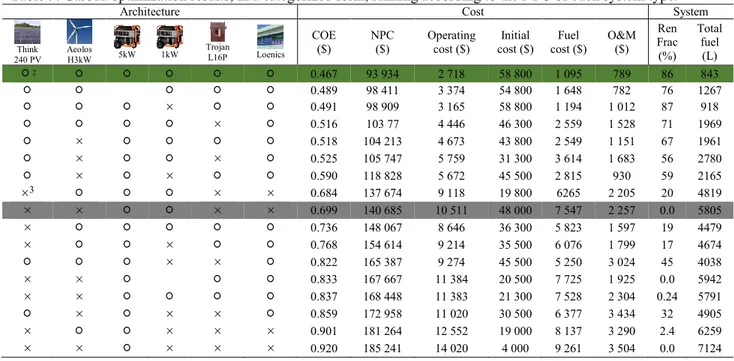
HOMER simulates system configurations with all combinations of the components specified in Tables 5 to 8. Tables 9 to 12 illustrate the best configurations for each site, classified according to the NPC (Net Present Cost) or COE (Cost of Energy). Each line in Tables 9 to 12 represents an alternative solution computed with HOMER. As justified in section 5, we eliminated the solutions where only one generator operates, either higher or lower power. Also, we eliminated all configurations without battery storage when renewable sources are present because the renewable penetration is high enough to cause stability problems (Homer software that recommend this!). In addition to the lowest COE system, two others are of particular interest, the DO (Diesel Only) system, using only generators as energy source without battery storage and BRF (Best Renewable Fraction) system with the highest annual fraction of renewable energy. In Tables 9 to 12, the DO solution corresponds to gray color line (line 9 in Garoua, line 10 in Maroua, line 15 in Yagoua, and line 12 in Kousseri) while BFR solution is in the first line in each table colored in green, being the one with the lowest COE.
Table 7. Summary of software inputs – Yagoua.
Item Capacity (kW) Capital($) Replacement ($)
O & M cost
($/yr) Size considered (kW) considered Quantities Life time
THINK-240 PV 1 5 000 5 000 40 0-5-6 25 years
Aeolos-H 3kW wind turbine 1 (unity) 13 500 13 500 100 0-3 0-1 25 years Generator (Generac 4kW) 1 800 800 0.08 ($/hr) 0-4 25 000 h Generator (Generac 1kW) 1 800 800 0.08 ($/hr) 0-1 25 000 h Battery (Trojan L16P) 1(unity) 500 500 0.5 0-20-25
Converter (Leonics) 1 800 800 40 0-4-5 15 years
Table 8. Summary of software inputs – Kousseri.
Item Capacity (kW) Capital($) Replacement ($) O & M cost ($/yr) Size considered (kW) Quantities considered Life time THINK-240 PV 1 5 000 5 000 40 0-4-4.5 25 years Aeolos-H 3kW wind turbine 1 (unit) 13 500 13 500 100 0-3 0-1 25 years Generator (Generac 3.5kW) 1 800 800 0.08 ($/hr) 0-3.5 25 000 h Generator (Generac 1kW) 1 800 800 0.08 ($/hr) 0-1 25 000 h Battery (Trojan L16P) 1(unit) 500 500 0.5 0-20-25
20
Table 9. Garoua optimization results, in a categorized form, ranking according to the NPC of each system type.
Architecture Cost System
Think 240 PV Aeolos H3kW 5kW 1kW Trojan L16P Loenics COE ($) NPC ($) Operating cost ($) Initial cost ($) Fuel cost ($) O&M ($) Ren Frac (%) Total fuel (L) 2 0.467 93 934 2 718 58 800 1 095 789 86 843 0.489 98 411 3 374 54 800 1 648 782 76 1267 × 0.491 98 909 3 165 58 800 1 194 1 012 87 918 × 0.516 103 77 4 446 46 300 2 559 1 528 71 1969 × 0.518 104 213 4 673 43 800 2 549 1 151 67 1961 × × 0.525 105 747 5 759 31 300 3 614 1 683 56 2780 × × 0.590 118 828 5 672 45 500 2 815 930 59 2165 ×3 × × 0.684 137 674 9 118 19 800 6265 2 205 20 4819 × × × × 0.699 140 685 10 511 48 000 7 547 2 257 0.0 5805 × 0.736 148 067 8 646 36 300 5 823 1 597 19 4479 × × 0.768 154 614 9 214 35 500 6 076 1 799 17 4674 × × 0.822 165 387 9 274 45 500 5 250 3 024 45 4038 × × 0.833 167 667 11 384 20 500 7 725 1 925 0.0 5942 × × 0.837 168 448 11 383 21 300 7 528 2 304 0.24 5791 × × × 0.859 172 958 11 020 30 500 6 377 3 434 32 4905 × × × × 0.901 181 264 12 552 19 000 8 137 3 290 2.4 6259 × × × × × 0.920 185 241 14 020 4 000 9 261 3 504 0.0 7124
Table 10. Maroua optimization results, in a categorized form, ranking according to the NPC of each system type.
Architecture Cost System
Think 240 PV Aeolos H3kW 5kW 1kW Trojan L16P Loenics COE ($) NPC ($) Operating cost ($) Initial cost ($) Fuel cost ($) O&M ($) Ren Frac (%) Total fuel (L) 0.438 139 817 4 588 80 500 1 893 1 254 84 1456 × 0.475 151 640 6 601 66 300 3 600 1 626 70 2769 × 0.506 161 615 6 337 79 700 2 461 1 766 83 1893 × 0.535 171 003 8 354 63 000 4 988 2 691 64 3837 × × 0.552 176 514 9 717 50 900 6 219 1 835 44 4784 × × 0.555 177 390 9 947 48 800 6 208 2 917 53 4775 × 0.558 178 280 8 693 65 900 5 109 1 925 56 3930 × × 0.586 187 192 9 537 63 900 4 473 2 573 68 3441 × × × 0.678 216 657 15 042 22 200 10 517 3 468 14 9090 × × × × 0.710 226 772 16 985 7 200 12 104 3 694 0.0 9310 × 0.715 228 418 14 289 43 700 9 615 2 784 18 7396 × × 0.746 238 290 16 213 28 700 11 391 2 860 0.0 8762 × × × 0.776 247 851 15 583 46 400 9 137 4 802 37 7028 × × 0.781 249418 16 037 42 100 10 297 3 494 16 7921 × × 0.90 252 526 14 784 61 400 8 540 4 688 42 6569 × × × 0861 275 259 19 196 27 100 12 906 3 854 0.0 9928
2The corresponding device is taken into account in the architecture
3The corresponding device is not taken into account in the architecture
21
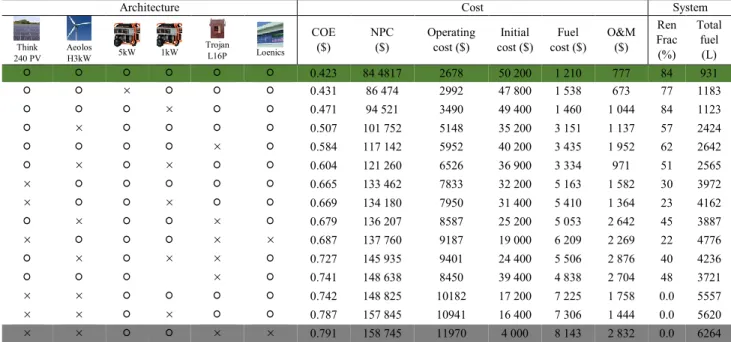
Table11: Yagoua optimization results, in a categorized form, ranking according to the NPC of each system type
Architecture Cost System
Think 240 PV Aeolos H3kW 5kW 1kW Trojan L16P Loenics COE ($) NPC ($) Operating cost ($) Initial cost ($) Fuel cost ($) O&M ($) Ren Frac (%) Total fuel (L) 0.423 84 4817 2678 50 200 1 210 777 84 931 × 0.431 86 474 2992 47 800 1 538 673 77 1183 × 0.471 94 521 3490 49 400 1 460 1 044 84 1123 × 0.507 101 752 5148 35 200 3 151 1 137 57 2424 × 0.584 117 142 5952 40 200 3 435 1 952 62 2642 × × 0.604 121 260 6526 36 900 3 334 971 51 2565 × 0.665 133 462 7833 32 200 5 163 1 582 30 3972 × × 0.669 134 180 7950 31 400 5 410 1 364 23 4162 × × 0.679 136 207 8587 25 200 5 053 2 642 45 3887 × × × 0.687 137 760 9187 19 000 6 209 2 269 22 4776 × × × 0.727 145 935 9401 24 400 5 506 2 876 40 4236 × 0.741 148 638 8450 39 400 4 838 2 704 48 3721 × × 0.742 148 825 10182 17 200 7 225 1 758 0.0 5557 × × × 0.787 157 845 10941 16 400 7 306 1 444 0.0 5620 × × × × 0.791 158 745 11970 4 000 8 143 2 832 0.0 6264
Table 12. Kousseri optimization results, in a categorized form, ranking according to the NPC of each system type.
Architecture Cost System
Think 240 PV Aeolos H3kW 5kW 1kW Trojan L16P Loenics COE ($) NPC ($) Operating cost ($) Initial cost ($) Fuel cost ($) O&M ($) Ren Frac (%) Total fuel (L) 0.412 70 477 1 948 45 300 712 560 89 548 × 0.413 70 522 2 168 42 500 954 500 83 734 × 0.435 74 383 2 312 44 500 823 676 89 633 × × 0.525 89 667 4 871 26 700 3 140 854 46 2415 × 0.525 89 717 4 271 34 500 2 379 1354 69 1830 × 0.563 96 161 5 156 29 500 3 243 1018 47 2494 × × 0.591 101 084 6 311 19 500 3 804 1680 46 2925 × × 0.592 101 255 5 551 29 500 3 166 871 46 2435 × 0.609 104 029 6 608 18 600 4 325 1549 35 3327 × × × 0.610 104 227 5 664 31 000 3 445 1115 45 2650 × × 0.610 104 276 5 730 30 200 3 680 963 38 2830 × × × × 0.706 120 658 9 055 3 600 6 324 1796 0.0 4864 × × × 0.750 128 203 8 741 15 200 6 090 1269 0.0 4684 × × 0.767 131 198 7 542 33 700 4034 2235 49 3103 × × 0.781 133 548 9 093 16 000 6117 1554 0.0 4705 × × × 0.820 140 186 9 398 18 700 5277 2559 30 4059
The DO solution is the one that is currently being operating at the four sites in absence of main grid electricity (nonexistent network, network failure, load shedding,
22
power rationing, etc.). The DO solution is the one with the lowest initial capital of $4 800 in Garoua, $7,200 in Maroua, $4,000 in Yagoua, and $3,600 in Kousseri. However, when considering the operation over 25-year period, it is the most expensive system ($140, 685 in Garoua, $226,772 in Maroua, $158,745 in Yagoua, and $120,650 in Kousseri), mostly for fuel purchase.
(a)
(b)
(c)
(d)
Fig. 7. Monthly average electric production in the case of the BRF for (a) Garoua; (b) Maroua; (c) Yagoua; and (d) Kousseri.
Best Renewable Fraction (BRF) solution is the one that requires the highest initial investment, approximately $58,800 in Garoua, $80,500 in Maroua, $50,200 in Yagoua, and
23
$45,300 in Kousseri. However, even with the largest initial investment, this is by far the most economical system with the lowest NPC, up to one and half times less than DO solution. The results show a very high renewable energy penetration rate; more than 80% in all sites (see Tables 9, 10, 11, and 12, column “Renewable Fraction”).
Additional data about BRF operation is illustrated in Fig. 7. Fig. 7 shows the monthly average electricity production from each energy source, wind, solar and diesel, respectively. It appears that PV is the most important source for the four sites with average annual production rate of 67.18% in Garoua, 70.05% in Maroua, 56.36% in Yagoua, and 47.76% in Kousseri. The largest average annual production rate of wind energy is recorded in Kousseri (42.5%), which benefits of the best wind potential of all sites (see Fig. 3).
For the BRF System, the combined contribution of renewable sources and battery storage results in minimal use of diesel generators and translates into significant fuel savings, i.e., annual consumption of 843L in Garoua, 1456L in Maroua, 931L in Yagoua and 548 L in Kousseri over the 25-year operation
In addition to the economic aspects, the use of renewable energy also results in GHG emission reduction. Table 13 provides a comparison between DO and BRF solutions of the pollutant emissions: carbon dioxide, carbon monoxide, unburned hydrocarbons, particular matter, sulfur dioxide, and nitrogen oxides [42]. The reduction of the environmental impact by using BRF compared to DO solution is significant.
24
Table 13. Comparative emission of polluting particles between the two solutions in the four areas of the study.
Pollutants
Emissions (kg/yr)
Garoua Maroua Yagoua Kousseri
DO solution BRF solution DO solution BRF solution DO solution BRF solution DO solution BRF solution Carbon dioxide 15 288 2 032 23 299 3 512 14 522 2 485 12 464 1 447 Carbon monoxide 37.7 5.02 57.51 8.67 35.8 6.13 30.8 3.57 Unburned hydrocarbon 4.18 0.556 6.37 0.96 3.97 0.679 3.41 0.396 Particular matter 2.84 0.378 4.34 0.65 2.7 0.462 2.32 0.269 Sulfur dioxide 30.7 4.08 46.79 7.05 29.2 4.99 25 2.91 Nitrogen oxides 337 44.8 513.18 77.35 320 54.7 275 31.9 7. Conclusion
The wind speed and solar data from NASA weather database for four sites (Garoua, Maroua, Yagoua and Kousseri) of the North and Far North of Cameroon have been used to study the potential of using renewable sources in addition to diesel generators. The wind energy potential is small but usable if turbines are installed at least at 20 m height. On the other hand, solar energy is abundant in the four sites and use of photovoltaic panels is suitable.
The feasibility of using renewable energy to replace diesel has been explored for specific existing off-grid facilities in each of the four sites (Table 2). The comparison of different configurations of renewable energy and battery storage was done using HOMER software. It is shown that the use of renewable energies presents the lowest cost per kWh of all solutions, i.e., $0.467 in Garoua, $0.438 in Maroua, $0.423 in Yagoua, and $0.412 in Kousseri. These costs of energy which also include the water supply cost, a rare and expensive commodity in these areas, are highly competitive compared with the one from the national grid considering the many inconveniencies already mentioned [43]. It also presents the minimum environmental impact in terms of GHG emissions with 2642.28 kg/yr in Garoua, 3606.6 kg/yr in Maroua, 2546.97 kg/yr in Yagoua, and 1486.05 in Kousseri of polluting particles emitted i.e., on average seven times less than the use of diesel alone.
25
Acknowledgements
The authors of this article wish to acknowledge the financial support from the Local Materials Promotion Authority/MIPROMALO, PO Box: 2396, Nkolbikok, Yaoundé, Cameroon and Natural Sciences Research Council of Canada (NSERC).
References
1. Yüksel, I., Hydropower for sustainable water and energy development. Renewable and Sustainable Energy Reviews, 2010. 14(1): p. 462-469.
2. Rapport du groupe de travail « Développement de l’offre énergétique de la zone Franc», Ouagadougou. 2009.
3. Tchinda, R. and E. Kaptouom, Situation des énergies nouvelles et renouvelables au Cameroun. Revue de l’Energie, 1999. 510(8): p. 653-658.
4. Tchinda, R. and E. Kaptouom, Wind energy in Adamaoua and North Cameroon provinces. Energy Conversion and Management, 2003. 44(6): p. 845-857.
5. Tchinda, R., et al., Estimation of mean wind energy available in far north Cameroon. Energy Conversion and Management, 2000. 41(17): p. 1917-1929. 6. Njomo, D., Estimation du potentiel énergétique solaire du Cameroun. . Séminaire
Sous régional sur l’énergie solaire du Service du développement., 1986: p. 42-61. 7. Kamseu, E., et al., Cumulative pore volume, pore size distribution and phases
percolation in porous inorganic polymer composites: Relation microstructure and effective thermal conductivity. Energy and Buildings, 2015. 88(0): p. 45-56.
8. Tene Fongang, R.T., et al., Cleaner production of the lightweight insulating composites : Microstructure, pore network and thermal conductivity. Energy and Buildings, 2015. 107: p. 113-122.
9. Mandelli, S., et al., Off-grid systems for rural electrification in developing countries: Definitions, classification and a comprehensive literature review. Renewable and Sustainable Energy Reviews, 2016. 58: p. 1621-1646.
10. Ekren, B.Y. and O. Ekren, Simulation based size optimization of a PV/wind hybrid energy conversion system with battery storage under various load and auxiliary energy conditions. Applied Energy, 2009. 86(9): p. 1387-1394.
11. Ekren, O. and B.Y. Ekren, Size optimization of a PV/wind hybrid energy conversion system with battery storage using response surface methodology. Applied Energy, 2008. 85(11): p. 1086-1101.
12. Hochart, C., et al., Wind turbine performance under icing conditions. Wind Energy, 2009(11): p. 319-333.
13. Saheb-Koussa, D., M. Haddadi, and M. Belhamel, Economic and technical study of a hybrid system (wind–photovoltaic–diesel) for rural electrification in Algeria. Applied Energy, 2009. 86(7–8): p. 1024-1030.
26
14. Yang, H., Z. Wei, and L. Chengzhi, Optimal design and techno-economic analysis of a hybrid solar–wind power generation system. Applied Energy, 2009. 86(2): p. 163-169.
15. Abramson MA, et al. The NOMAD project. Software available at
http://www.gerad.ca/nomad. 2012.
16. Barley CD and W. CB, Optimal dispatch strategy in remote hybrid power systems. Solar Energy, 1996. 58: p. 165-179
17. Kenfack, J., et al., Microhydro-PV-hybrid system: Sizing a small hydro-PV-hybrid system for rural electrification in developing countries. Renewable Energy, 2009.
34(10): p. 2259-2263.
18. Kanase-Patil, A.B., R.P. Saini, and M.P. Sharma, Sizing of integrated renewable energy system based on load profiles and reliability index for the state of Uttarakhand in India. Renewable Energy, 2011. 36(11): p. 2809-2821.
19. Bakos, G.C., Feasibility study of a hybrid wind/hydro power-system for low-cost electricity production. Applied Energy, 2002. 72(3–4): p. 599-608.
20. Connolly, D., et al., A review of computer tools for analysing the integration of renewable energy into various energy systems. Applied Energy, 2010. 87(4): p. 1059-1082.
21. Chauhan, A. and R.P. Saini, A review on Integrated Renewable Energy System based power generation for stand-alone applications: Configurations, storage options, sizing methodologies and control. Renewable and Sustainable Energy Reviews, 2014. 38(0): p. 99-120.
22. Vagliani, R. and A. Ilinca, Étude et conception des outils aidant à compléter
l’utilisation d’AnémoScope Available from:
http://biblio.uqar.qc.ca/archives/30110643.pdf, 2009.
23. Kidmo, D.K., et al., Performance Assessment of Twoparameter Weibull Distribution Methods for Wind Energy Applications in the District of Maroua in Cameroon. Basic and Applied Research, 2014. 17(1): p. 39-69.
24. Kidmo, D.K., et al., Statistical analysis of wind speed distribution based on six Weibull Methods for wind power evaluation in Garoua, Cameroon. Revue des Energies Renouvelables 2015. 18(1): p. 105-125.
25. Kidmo, D.K., et al., ‘Assessment of wind energy potential for small scale water pumping systems in the north region of Cameroon. International Journal of Basic and Applied Sciences, 2014. 3(1): p. 38-46.
26. Kidmo, D.K., et al., Comparison of Five Numerical Methods for Estimating Weibull Parameters for Wind Energy Applications in the District of Kousseri, Cameroon. Asian Journal of Natural and Applied Sciences, 2014. 3(1): p. 72-87
27. Kidmo, D.K., et al., Statistical analysis of wind speed distribution based on six Weibull Methods for wind power evaluation in Garoua, Cameroon. Revue des Energies Renouvelables. 18(1): p. 105-125.
27
28. Akpinar, E.K. and S. Akpinar, An assessment on seasonal analysis of wind energy characteristics and wind turbine characteristics. Energy Conversion and Management, 2005. 46(11–12): p. 1848-1867.
29. Jonhson, G., Wing energy systems. Electronic edition. 2001: Manhattan KS.
30. Akdağ, S.A., H.S. Bagiorgas, and G. Mihalakakou, Use of two-component Weibull mixtures in the analysis of wind speed in the Eastern Mediterranean. Applied Energy, 2010. 87(8): p. 2566-2573.
31. Elliott DL, H.C., Barchet WR, Foote HP, Sandusky WF, Wind energy resource atlas of the United States. DOE/CH10094-4. 1987.
32. Ohunakin, O.S., M.S. Adaramola, and O.M. Oyewola, Wind energy evaluation for electricity generation using WECS in seven selected locations in Nigeria. Applied Energy, 2011. 88(9): p. 3197-3206.
33. Boweden G. J., B.P.R., Shestopal V. O., Twidell J.W, The Weibull distribution function and wind statistics. Wind Eng. , 1983(7): p. 85–98.
34. Ucar, A. and F. Balo, Evaluation of wind energy potential and electricity generation at six locations in Turkey. Applied Energy, 2009. 86(10): p. 1864-1872.
35. Ibrahim, H. and A. Ilinca, Techno-Economic Analysis of Different Energy Storage Technologies. Energy Storage, editor InTech, 2013.
36. Ibrahim, H., A. Ilinca, and J. Perron, Energy storage systems—Characteristics and comparisons. Renewable and Sustainable Energy Reviews, 2008. 12(5): p. 1221-1250.
37. Ibrahim, H., et al., Study and design of a hybrid wind–diesel-compressed air energy storage system for remote areas. Applied Energy, 2010. 87(5): p. 1749-1762.
38. Weis, T.M. and A. Ilinca, The utility of energy storage to improve the economics of wind–diesel power plants in Canada. Renewable Energy, 2008. 33(7): p. 1544-1557.
39. Akinboadea, O.A. and E.C. Kinfacka, Interest rate reforms, financial deepening and economic growth in Cameroon: an empirical investigation. Applied Economics, 2013. 45(25): p. 3574-3586.
40. Trajkovic, S., P. Tunestål, and B. Johansson, Simulation of a pneumatic hybrid powertrain with VVT in GT-power and comparison with experimental data. 2009, SAE Technical Paper.
41. Ibrahim, H., et al., Investigation des générateurs hybrides d’électricité de type éolien-air comprimé. Numéro spécial CER, 2007.
42. Şahin, Z. and O. Durgun, Improving of diesel combustion-pollution-fuel economy and performance by gasoline fumigation. Energy Conversion and Management, 2013. 76(0): p. 620-633.
43. Oladokun, V.O. and O.C. Asemota, Unit cost of electricity in Nigeria: A cost model for captive diesel powered generating system. Renewable and Sustainable Energy Reviews, 2015. 52: p. 35-40.
CHAPITRE 2
SIMULATION NUMÉRIQUE SUR GT-POWER DE L’HYBRIDATION PNEUMATIQUE D’UN MOTEUR DIESEL FONCTIONNANT EN MODE DE
SURALIMENTATION
2.1 RESUME DU DEUXIEME ARTICLE
Le présent travail s’intéresse à l’hybridation pneumatique d’un moteur diesel. Un modèle de moteur hybride pneumatique dont les caractéristiques sont proches du moteur 645E3B porté par les locomotives EMD a été développé et simulé avec l’outil GT-Power en mode de suralimentation pneumatique (ou moteur hybride pneumatique). Les résultats obtenus ont été comparés à ceux d’un moteur de combustion conventionnel. Il a été
démontré que le passage au mode moteur hybride pneumatique a amélioré les performances du moteur avec un gain en puissance de l’ordre de 40%, entrainé une baisse de près de la moitié de la consommation spécifique indiquée du carburant et enfin près du quart les émissions polluantes dans la nature.
Ce travail est un projet d’article qui sera soumis très prochainement dans une revue à comité de lecture adaptée au thème traité. Il a été rédigé par moi-même sous la supervision du professeur Adrian Ilinca. En tant que premier auteur, ma contribution à ce travail fut l’essentiel de la recherche sur l’état de l’art, le développement de la méthode, l’exécution des tests de simulation et la rédaction de l’article. Le professeur Adrian Ilinca, second auteur, a fourni l’idée originale, supervisé tout le travail et va aider à la révision de l’article. [Insérer ici le résumé du deuxième article
30
2.2 SIMULATION NUMERIQUE SUR GT-POWER DE L’HYBRIDATION PNEUMATIQUE D’UN MOTEUR DIESEL FONCTIONNANT EN MODE DE SURALIMENTATION
1. Introduction 1.1 Contexte
Les préoccupations croissantes en matière d'environnement, conjuguées à la hausse des prix du carburant, ont conduit à la recherche des moyens de transport alternatifs plus propres en termes d’impact sur l’environnement et plus efficaces que les systèmes de propulsion actuels basés essentiellement sur la combustion des fossiles. En effet, toutes les études menées jusqu’à ce jour prouvent que l’augmentation moyenne de la température du globe est conséquente à la concentration mesurée en gaz à effet de serre (GES) émis par l’activité humaine. La concentration en dioxyde de carbone (CO2) dans l’atmosphère mesurée en continu depuis 1959 au volcan Mauna-Loa (Hawaï) présente une allure croissante et monotone (Figure 1).
Figure 8: Concentration moyenne mensuelle en dioxyde de carbone mesurée au volcan Mauna-Loa (Hawaï) [1].
Le secteur des transports représente la deuxième source la plus polluante après la production de l’électricité et la chaleur avec une contribution estimée à 23% des émissions
![Figure 1: Emissions globales du CO2 dans le monde issues de la combustion des fossiles par secteur d'activités en 2014 [1]](https://thumb-eu.123doks.com/thumbv2/123doknet/7469498.222689/25.918.279.668.547.792/figure-emissions-globales-issues-combustion-fossiles-secteur-activités.webp)