Science Arts & Métiers (SAM)
is an open access repository that collects the work of Arts et Métiers Institute of Technology researchers and makes it freely available over the web where possible.
This is an author-deposited version published in: https://sam.ensam.eu
Handle ID: .http://hdl.handle.net/10985/18385
To cite this version :
Claudio VERGARI, Mohammad KARAM, Raphaël PIETTON, Raphaël VIALLE, Ismat GHANEM, Wafa SKALLI, Ayman ASSI - Spine slenderness and wedging in adolescent idiopathic scoliosis and in asymptomatic population: an observational retrospective study European Spine Journal -Vol. 29, n°4, p.726-736 - 2020
Any correspondence concerning this service should be sent to the repository Administrator : archiveouverte@ensam.eu
Spine slenderness and wedging in adolescent idiopathic scoliosis
and in asymptomatic population: an observational retrospective study
Claudio Vergari1 · Mohammad Karam2 · Raphael Pietton3 · Raphael Vialle3 · Ismat Ghanem2 · Wafa Skalli1 · Ayman
Assi2
Abstract
Purpose The origin of the deformity due to adolescent idiopathic scoliosis (AIS) is not known, but mechanical instability of the spine could be involved in its progression. Spine slenderness (the ratio of vertebral height to transversal size) could facilitate this instability, thus playing a role in scoliosis progression. The purpose of this work was to investigate slenderness and wedging of vertebrae and intervertebral discs in AIS patients, relative to their curve topology and to the morphology of control subjects.
Methods A total of 321 AIS patients (272 girls, 14 ± 2 years old, median Risser sign 3, Cobb angle 35° ± 18°) and 83 controls were retrospectively included (56 girls, median Risser 2, 14 ± 3 years). Standing biplanar radiography and 3D reconstruction of the spine were performed. Geometrical features were computed: spinal length, vertebral and disc sizes, slenderness ratio, frontal and sagittal wedging angles. Measurement reproducibility was evaluated.
Results AIS girls before 11 years of age had slightly longer spines than controls (p = 0.04, Mann–Whitney test). AIS verte-brae were significantly more slender than controls at almost all levels, almost independently of topology. Frontal wedging of apical vertebrae was higher in AIS, as expected, but also lower junctional discs showed higher wedging than controls. Conclusion AIS patients showed more slender spines than the asymptomatic population. Analysis of wedging suggests that lower junctional discs and apex vertebra could be locations of mechanical instability. Numerical simulation and longitudinal clinical follow-up of patients could clarify the impact of wedging, slenderness and growth on the biomechanics of scoliosis progression.
Graphic abstract
These slides can be retrieved under Electronic Supplementary Material.
Introduction
Adolescent idiopathic scoliosis (AIS) is a deformity of the spine, which is characterized by a typical three-dimen-sional pattern: a lateral displacement of the apical verte-bra, a torsion of the vertebral column and a flattening of the sagittal profile. This type of deformation is often com-pared to a buckling of the spine [7, 9, 12, 13]: a mechani-cal phenomenon that may occur in slender structures under compressive loading and is characterized by a lateral dis-placement of parts of the structure. Buckling is due to a structural instability, and it can happen with low loads [27]. In this framework, spine stability and its tendency to buckle depend on its shape, its mechanical properties and its slenderness. The Scoliosis Research Society defines the vertebral slenderness as “the ratio of transverse vertebral diameters to vertebral height […] combined into various slenderness ratio” [23]. The slenderness ratio is higher in tall and thin structures and lower in short and stout ones.
Slenderness is suspected to be a factor in scoliosis onset and progression because AIS patients tend to be taller than asymptomatic adolescents of the same age [1, 32], although the role of spinal length has been questioned [15, 22]. Moreover, AIS is much more common in girls, who tend to have more slender spines than boys [20, 26]. Indeed, it has been shown that thoracic idiopathic scoliotic spines (or at least the T6 vertebra) tend to be more slender than their asymptomatic counterpart [3, 22].
Moreover, vertebra and disc wedging could be both causes and effects of the lateral spinal displacement which characterizes scoliosis. Wedging is part of the vicious cycle leading to the progression of the deformity [24]: the asymmetrical loading due to the spinal curvature can induce asymmetrical growth of vertebrae (i.e., to wedg-ing), which in turn can increase the spinal curvature in a self-perpetuating cycle.
There is a vast literature analysing wedging in AIS. However, apart from in vitro measurements on anatomi-cal specimen [17, 18], most in vivo studies used 2D radio-graphic imaging to measure vertebral shape [14, 25, 31]. The main limitation of this method is the projection bias: the orientation of the vertebrae on the radiograph might not correctly represent the actual three-dimensional shape [4]. Computerized tomography, on the other hand, gives access to accurate 3D shape of vertebrae [10], but the patient is in supine position, thus affecting disc shape, and the imaging is highly irradiating. The same limitation applies to previous assessments of spinal slenderness.
Low-dose biplanar radiography and 3D reconstruction methods give access to vertebral shape of standing patient [5, 8]. Such method can be used to extract vertebral body size and wedging. The hypothesis of the present work was
that the scoliotic spine presents specific differences rela-tive to asymptomatic spines, in terms of slenderness and wedging, that could be measured with biplanar radiogra-phy. The aim of this work was to characterize vertebral and disc geometrical features in a large cohort of AIS scoliotic patients of different curve topologies and to compare them to asymptomatic controls.
Methods
SubjectsData were collected retrospectively from two hospitals, after approval of the ethical committees (IRB CEHDF 717-2015). Inclusion criteria for scoliotic patients were the same as rec-ommended by the Scoliosis Research Society [19]: diagnosis of AIS and Cobb angle higher than 10°. No specific crite-ria on Risser sign were imposed. Nonidiopathic scoliosis was excluded through clinical and neurological assessment and magnetic resonance imaging. Further exclusion criteria were the presence of supernumerary vertebrae and tran-sition anomalies. Patients were classified by major curve topology, according to the location of the apex: thoracic (T, apex between T2 and T11), thoracolumbar (TL, apex in T12 or L1) and lumbar (L, apex between L2 and L4) [16]. All patients underwent a low-dose biplanar radiography (EOS®, EOS Imaging, Paris, France) in the standardized freestand-ing position [6], as part of the clinical routine. Age- and Ris-ser sign-matched asymptomatic subjects were also included; they underwent biplanar radiography for unrelated reasons (volunteering, trauma, etc.), and they were free of spinal pathologies.
3D reconstruction
The spine of each subject (T1–L5) was reconstructed from biplanar X-rays using previously validated methods [8], by experienced users (> 5 years’ experience). Briefly, the reconstruction is initialized by the digitization in both frontal and lateral views of the spinal line, T1 upper endplate and L5 lower endplate, pelvic acetabula and sacral plate. The method then proposes a first estimate of spinal 3D recon-struction which is projected on the biplanar X-rays, and the user can translate and rotate all vertebrae to fit the con-tours of the 3D models on both radiographs simultaneously. Finally, the user can fine-adjust the shape of each vertebra, in the two views, through control points placed on anatomical landmarks such as spinous process, pedicles, at the four cor-ners of the endplates, etc. The operators were blinded from the output values (slenderness ratios, spinal lengths, etc.)
This reconstruction allowed automatic calculation of Cobb angle, but it also provided 3D models for all vertebrae
(Fig. 1). Pelvis acetabula were also reconstructed in 3D, and they were used to calculate the patient’s coronal and sagittal planes: coronal plane is vertical and it passes through both acetabula, while sagittal plane is orthogonal to the coronal one and passing through the midpoint between acetabula. Vertebral slenderness
Slenderness ratio was calculated for each vertebra and intervertebral disc. For each vertebra, lateral width and anteroposterior depth of both vertebral endplates were meas-ured to obtain average vertebral width and depth, as shown in Fig. 1. Vertebral body height was measured between the centres of the endplates. To compare vertebral size of patients of different ages, these measurements were normal-ized by dividing them by the developed length of the spine;
this length was calculated by summing the distances between all vertebral endplates.
The vertebral slenderness ratio represents the ratio of ver-tebral height to transversal size, accounting for the cross-sectional shape. It was calculated as r = H ∗ √A∕I , where H is the vertebra body height, A is the average area of the two endplates and I is the average of the smallest second moment of area of each endplate [27, 28]. More details on this defini-tion are provided in “Appendix”. Figure 2 shows two T12 vertebrae with high and low slenderness ratios, respectively. The more slender vertebra is taller and with a smaller cross-sectional area than the stouter one.
The same calculations were performed for intervertebral discs, using the endplates of two vertebrae adjacent to the disc (i.e., the lower endplate of the upper vertebra and the upper endplate of the lower vertebra).
Fig. 1 Example of vertebra measurements. W1 and W2 are the plateau widths, while D1 and D2 are the plateau depths; the averages of these lengths were retained as vertebral body width and depth. H is vertebral height. The upper and lower plateaus, which were used to calculate vertebral cross-sec-tional area and moment of area, were highlighted in blue
Fig. 2 Example of T12 vertebrae with high (a) and low (b) slender-ness ratios. Vertebral body height, average endplate cross-sectional area (CSA) and slenderness ratio (r) are reported. Vertebral body
a is taller and less deep than b, with a smaller cross-sectional area.
Indeed, vertebra a is more slender than b, which is reflected in their slenderness ratios (4.2 against 2.3)
Wedging
To calculate wedging, first a plane was fit to each endplate through least square regression to define a 3D vector nor-mal to the endplate. Frontal and lateral vertebral wedging was calculated by measuring the angle between endplates’ normal vectors projected in the patient’s coronal and sagit-tal planes; the same was done for intervertebral discs, using those endplates adjacent to the disc. Wedging was measured for all vertebrae of the asymptomatic subjects and for the junctions and apex of scoliotic patients.
Reliability
A reliability study was conducted on a subset of 32 patients (Cobb angle = 43° ± 30°, range 10°–109°). Three-dimen-sional reconstruction of the spine was repeated three times by three trained operators (orthopaedic residents), for a total of 288 reconstructions. Interoperator reproducibility of slen-derness and wedging for all vertebral levels was evaluated, according to ISO 5725 standard, in terms of standard tion of uncertainty. The error estimate on the standard devia-tion of uncertainty was less than 10% [11].
Statistics
Normality corridors for all parameters were calculated between the first and third quartiles of each parameter in the asymptomatic population. Age and curve severity (Cobb angle) between groups (T, TL and L) was compared with Kruskal–Wallis tests. Differences between the slenderness and wedging of AIS patients and asymptomatic subjects were analysed by curve topology at all vertebral levels with Mann–Whitney tests. Correlations between geometrical parameters and subjects’ age and Cobb angle were quantified with Spearman’s rank test. Nonparametric tests were used because not all parameters followed normal distributions
(Lilliefors normality test). Post hoc power analysis was performed. Calculations were carried out using MATLAB 2016b (The MathWorks Inc., Natick, MA, USA), and sig-nificance was set at 0.05.
Results
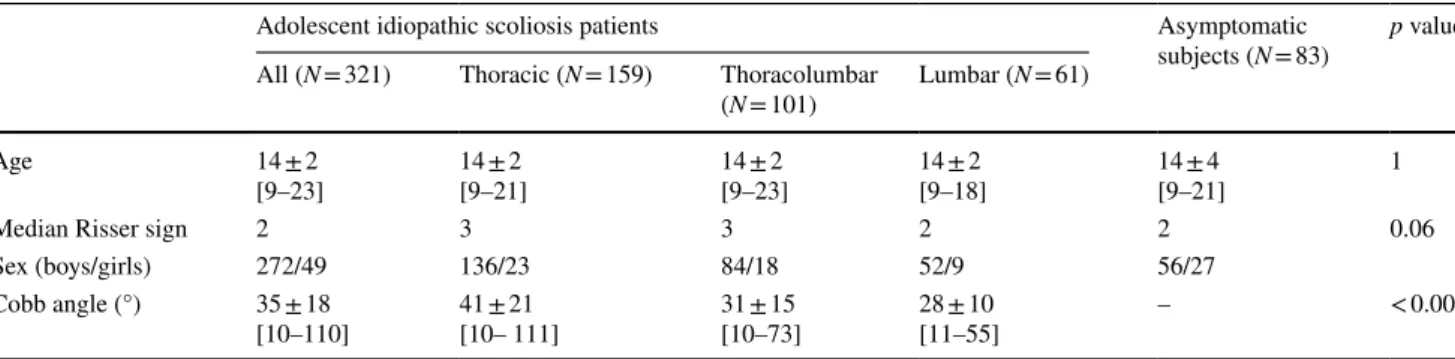
SubjectsThree-hundred and twenty-one AIS patients (272 girls, 49 boys) were included, ages ranging between 9 and 21 years old (14 ± 2 years old, median Risser sign 3), average Cobb angle 35° ± 18° (range 10°–111°). Eighty-three asymp-tomatic control subjects were also included, (56 girls, 27 boys), ageing between 9 and 21 (14 ± 3 years old, median Risser sign 2). Table 1 reports demographic data; all groups had the same age and Risser sign (p > 0.05), but thoracic curves were significantly more severe than thoracolumbar and lumbar curves (p < 0.001).
Spine length
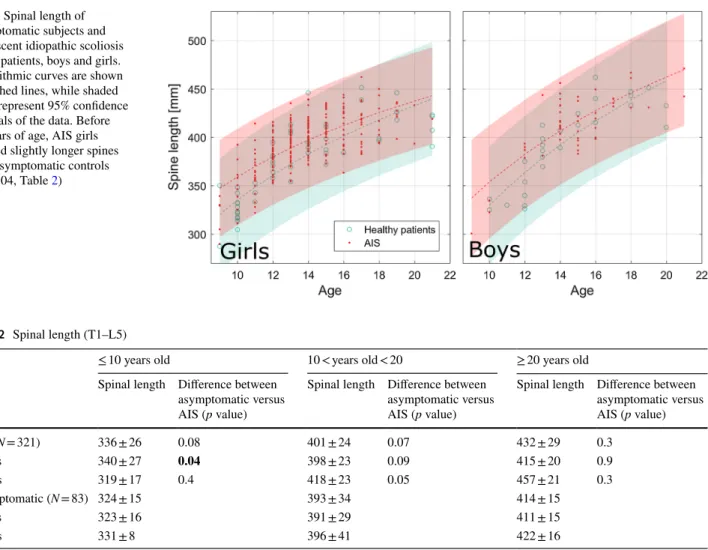
Interoperator reproducibility of spinal length was 1 mm, cor-responding to 0.3% coefficient of variation. Figure 3 shows the relationship between spinal length and subject age and sex, while quantitative data are reported in Table 2. Spine length in asymptomatic population increased from 324 cm before 10 years of age to 414 cm after 20 years. AIS girls before 11 years of age had slightly longer spines (340 ± 15) than asymptomatic girls (323 ± 16 cm, p = 0.04), while AIS boys showed slightly shorter spines than asymptomatic boys, albeit not significantly (p = 0.4, Table 2). However, differ-ences after 20 years of age were not significant, neither for boys nor girls.
Table 1 Demographics (mean ± SD, ranges are reported between brackets)
Groups had similar age, while thoracic curves were more severe than lumbar and thoracolumbar ones
p values result from Krukal–Wallis tests between groups: all groups had the same age, but thoracic curves were significantly more severe than
thoracolumbar and lumbar
Adolescent idiopathic scoliosis patients Asymptomatic
subjects (N = 83) p value All (N = 321) Thoracic (N = 159) Thoracolumbar
(N = 101) Lumbar (N = 61)
Age 14 ± 2
[9–23] 14 ± 2[9–21] 14 ± 2[9–23] 14 ± 2[9–18] 14 ± 4[9–21] 1
Median Risser sign 2 3 3 2 2 0.06
Sex (boys/girls) 272/49 136/23 84/18 52/9 56/27
Cobb angle (°) 35 ± 18
Slenderness
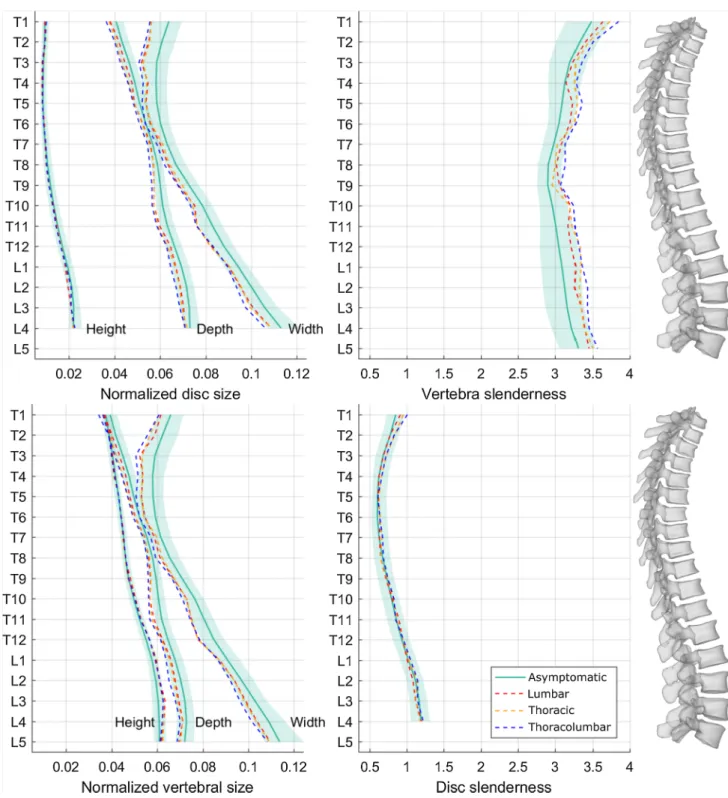
Figure 4 reports median sizes and slenderness ratios at all vertebral and disc levels for the asymptomatic population and for each AIS curve topology. Table 3 reports the statis-tical significance of the differences between scoliotic and asymptomatic population vertebral size and slenderness at all levels. TL curves had significantly smaller vertebrae (i.e., smaller width and depth) than asymptomatic ones at all vertebral levels, while T curves showed the same pat-tern, but the differences were less marked in the T6–T9 and L4–L5 segments. Lumbar curves had smaller verte-brae in the thoracolumbar and lower lumbar segments; these patients also had lower vertebral width in the T1–T2 segment. All topologies had taller vertebrae in the lumbar region (L2–L4), while T and TL curves also had some taller vertebrae in the T11–L1 segment (Table 3). Verte-brae were more slender in TL patients at all levels, and in T patients at all levels except for T7–T8. Lumbar patients had more slender vertebrae between T5 and L4.
Intervertebral discs showed the same patterns as the vertebrae for width and depth. Scoliotic discs height was significantly higher only at the L2–L3 and L3–L4 levels in all groups relative to asymptomatic population. Disc slen-derness was not different from asymptomatic population (Fig. 2).
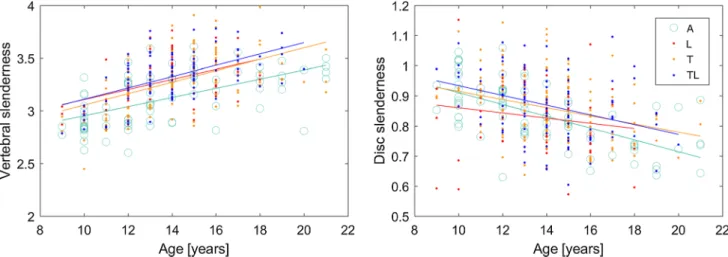
When pooling all spinal levels for each patient, vertebral size, vertebral and disc slenderness were all correlated with patient age (Table 4, Fig. 4). Average disc slenderness was also correlated with Cobb angle in T (Spearman’s rho = 0.3,
p < 0.001) and TL scoliosis (rho = 0.3, p = 0.0045), but not
in L ones (p = 1). It is also interesting to notice that verte-bral slenderness tended to significantly increase with age in all curve topologies and in asymptomatic subjects (Table 4, positive sign of Spearman’s rho), while disc slenderness tended to decrease (Fig. 2).
Slenderness showed a reproducibility below 0.17 (5% coefficient of variation) for all vertebral levels except T1, for which reproducibility was 0.2 (6%). Study power for groups comparison of slenderness and vertebral
Fig. 3 Spinal length of asymptomatic subjects and adolescent idiopathic scoliosis (AIS) patients, boys and girls. Logarithmic curves are shown as dashed lines, while shaded areas represent 95% confidence intervals of the data. Before 11 years of age, AIS girls showed slightly longer spines than asymptomatic controls (p = 0.04, Table 2)
Table 2 Spinal length (T1–L5)
Differences were evaluated with Mann–Whitney tests
≤ 10 years old 10 < years old < 20 ≥ 20 years old Spinal length Difference between
asymptomatic versus AIS (p value)
Spinal length Difference between asymptomatic versus AIS (p value)
Spinal length Difference between asymptomatic versus AIS (p value) AIS (N = 321) 336 ± 26 0.08 401 ± 24 0.07 432 ± 29 0.3 Girls 340 ± 27 0.04 398 ± 23 0.09 415 ± 20 0.9 Boys 319 ± 17 0.4 418 ± 23 0.05 457 ± 21 0.3 Asymptomatic (N = 83) 324 ± 15 393 ± 34 414 ± 15 Girls 323 ± 16 391 ± 29 411 ± 15 Boys 331 ± 8 396 ± 41 422 ± 16
dimensions was higher than 0.9 at all vertebral lev-els, except for the analysis of vertebral dimensions of upper thoracic (T1–T3) and L5 concerning the L group (power ≤ 0.5), which had less patients.
Wedging
Wedging showed a reproducibility lower than 2.6° for all vertebral levels except L5 for which reproducibility was 3°. Figure 5 reports frontal and sagittal wedging of junctional
Fig. 4 Normalized disc and vertebral sizes (width, depth and height, divided by spinal length), and vertebral and disc slenderness ratios. Shaded areas represent the normality corridors (first and third quartiles) of the asymptomatic population, while lines are median values
and apex vertebrae and discs. As expected, vertebral and disc frontal wedging was the highest at the apexes. Frontal wedging of the junctional vertebrae was similar to asymp-tomatic ones, both in terms of median value and spread of data (first and third quartiles), but inferior junctional discs showed much higher wedging than asymptomatic discs, especially in the L1–L4 segment. Moreover, all discs showed higher variability in frontal wedging (i.e., higher third quar-tile, Fig. 5).
Sagittal disc and vertebra wedging of scoliotic patients was similar to asymptomatic subjects, although the former show slightly higher variability and a tendency to higher disc wedging than asymptomatic subjects.
Average frontal vertebral wedging was correlated with Cobb angle for all curve topologies (Table 4), while disc wedging showed a weak correlation only for lumbar discs. Wedging was not correlated with age (Table 4).
Discussion
The slenderness ratio represents the potential instability of each vertebra. It increases with vertebral height, and it is affected by the cross-sectional shape and area of the ver-tebral body. A rounded cross section will be more stable than a thin and wide cross section (Fig. 3). In this study, it was hypothesized that AIS spines could show markers of
Table 3 Differences of vertebral size and slenderness between asymptomatic population and scoliotic patients by curve topology (L lumbar curves, T thoracic curves, TL thoracolumbar curves)
The symbols represent the sign of the difference (plus sign indicating that value for scoliosis is higher than asymptomatic population), while the number of signs represents statistical significance (1: p < 0.05, 2: p < 0.01; 3: p < 0.001). Empty cells represent nonsignificant differences
T1 T2 T3 T4 T5 T6 T7 T8 T9 T10 T11 T12 L1 L2 L3 L4 L5 Vertebral width L --- -- -- -- -- --- --- -- - -- --- TL --- --- --- --- --- --- --- --- --- --- --- --- --- --- --- --- --- T --- --- - -- -- --- -- --- --- --- --- -- -- --- ---Vertebral depth L - -- --- -- - - - - TL --- --- --- --- --- --- --- --- --- --- --- --- --- --- --- --- -- T --- -- -- --- --- - - -- --- --- --- -- -- -- -Vertebral height L ++ +++ ++ TL + +++ +++ ++ T + ++ + +++ +++ +++ Vertebral slenderness L + + + + +++ ++ ++ ++ + ++ +++ ++ TL +++ ++ +++ ++ +++ +++ +++ +++ +++ +++ +++ +++ +++ +++ +++ +++ + T ++ + ++ ++ +++ +++ ++ +++ +++ +++ +++ +++ +++ +++ +
Table 4 Correlations of subjects Cobb angle and age with average vertebral size, vertebral and disc slenderness and wedging
Only significant Spearman’s rho values are reported (p vales between parentheses). Results are grouped according to curve topology (T thoracic, TL thora-columbar, L lumbar) and for asymptomatic subjects. For the latter, wedging was averaged on all vertebral levels (since an apex could not be defined)
Cobb angle Age
T TL L T TL L Asymptomatic Vertebral depth – – – 0.3 (< 0.001) 0.4 (< 0.001) 0.3 (0.0068) 0.4 (< 0.001) Vertebral width – – – 0.3 (< 0.001) 0.3 (< 0.001) 0.3 (0.0079) 0.3 (0.0044) Vertebral height – – – 0.7 (< 0.001) 0.7 (< 0.001) 0.6 (< 0.001) 0.5 (< 0.001) Vertebral slenderness – – – 0.5 (< 0.001) 0.4 (< 0.001) 0.6 (< 0.001) 0.4 (0.001) Disc slenderness 0.3 (< 0.001) 0.3 (0.0045) – − 0.3 (< 0.001) − 0.4 (< 0.001) − 0.3 (0.0202) − 0.4 (< 0.001) Frontal vertebral wedging (apex) 0.6 (< 0.001) – 0.3 (0.01) – – – –
geometrical instability, such as increased slenderness and wedging relative to the asymptomatic population. A three-dimensional analysis, based on low-dose X-ray imaging, confirmed that AIS patients have more slender spines due to small vertebrae and discs cross-sectional areas. Different patterns were observed depending on curve topology.
Spinal length was normal in AIS, although AIS girls showed slightly longer spines than asymptomatic controls at younger age (p = 0.04, Table 2). This seems to corroborate previous studies reporting that AIS girls tend to have slightly longer spines [15, 22].
Reliability of the measurements was assessed; reproduc-ibility of slenderness ratio was below 6% and lower than 3° for wedging. Accuracy of the vertebral shape was previously assessed by comparison with computerized tomography reconstruction: point to surface uncertainty was 1.2 ± 3 mm [8]. Previous studies analysed vertebral wedging using bipla-nar radiography [2, 30]. The sagittal wedging observed in this study (Fig. 5) is between those reported by Aubin et al. on 34 AIS patients with mild scoliosis (2.0°, max Cobb angle 45°) and those reported by Villemure et al. on 28 more severe cases (11.2° ± 11, average Cobb angle 51° ± 8.5°). Sagittal wedging in this study appeared normal, which is consistent with previous in vitro studies [17].
Frontal wedging of apex vertebrae was correlated with Cobb angle in T and TL curves (Table 4), which is expected as more severe scoliosis is accompanied by more deformed vertebrae and is also consistent with previous studies [14].
Average disc slenderness increased with Cobb angle only in T and TL curves; no correlation was observed in L curves, possibly because of their lower severity relative to the other topologies (Table 1). Slenderness increased with Cobb angle even if it tended to decrease with age; here, ageing represents a confounding factor because curves progress in time and therefore Cobb angle increases with age (Spearman’s rho = 0.14, p = 0.01). In other words, it appears that the increase in disc slenderness with curve severity is sufficiently high to counter its tendency to decrease with age, since the ending result is an increase in slenderness with severity. This finding suggests that slen-derness could play a role in the progression of the severity; still, causality cannot be demonstrated at this time. Long follow-up of patients is necessary to show the potential link between early increased slenderness and later progres-sion. A study is ongoing to follow patients from diagno-sis to either skeletal maturity without progression (stable patients) or to decision of bracing (progressive patients) [21]; results should help clarify whether increased slen-derness can be considered as a risk factor for scoliosis progression.
Vertebral size increased with age in all AIS groups and in asymptomatic population, but vertebral height increased more than the cross-sectional area because vertebral slender-ness increased in each group (Table 4, Fig. 6).
Frontal wedging was high at apex, as expected, but also at lower junctional disc. This finding might be of interest when choosing the lower level of instrumentation in spinal fusion surgery, which is a controversial issue. Care should be taken to include the lowest vertebra and junctional disc of the curve within the fusion to limit the risk of post-operative frontal imbalance. Algorithms already exist to help the surgeon to choose the last instrumented vertebra, and they often include
Fig. 6 Correlation of vertebral and disc slenderness with age in asymptomatic subjects (A), lumbar (L), thoracolumbar (TL) and thoracic (T) scoliosis patients. Regression lines are reported for each group. Correlations were significant in all groups (p < 0.05, Spearman’s rank test)
Fig. 5 Frontal and sagittal vertebral and disc wedging of apex, supe-rior (Jsup) and inferior junctional vertebrae (Jinf). Shaded are
repre-sents the normality corridors (first and third quartiles) of the asymp-tomatic population, while error bars represent first and third quartiles ◂
qualitative assessment of wedging [29]. Since the 3D recon-struction allows measuring vertebral wedging, quantitative morphological analysis of discs and vertebrae could improve those algorithms. Further studies should look at the relation-ship between vertebral morphology and post-surgery re-equi-libration of the patient. Finally, sagittal wedging in junctional and apex vertebrae and disc was normal, suggesting that the characteristic “flat back” of AIS patient is not mainly caused by these key vertebrae.
Table 3 shows that vertebral slenderness is a characteris-tic of the scoliocharacteris-tic spine at almost all vertebral levels, almost irrespective of curve topology; only in lumbar curves, upper thoracic vertebrae seem unaffected, where the deformity is much lower in the spine.
The main limitation of this study is that the size of interver-tebral discs was inferred from the size of the adjacent verte-brae, since discs are not visible in X-ray imaging. While disc height and wedging remain accurate, as they are calculated from the adjacent endplates, width and depth might be under-estimated since the disc tends to bulge and the annulus inserts on the outer part of the endplate. This is why disc width and depth show similar patterns as the adjacent upper vertebrae (Fig. 4).
Another limitation is that geometrical analysis of slender-ness and wedging considers the spine as a passive structure; stabilization due to muscular activity and its potential asym-metry, neuromuscular control and changes in mechanical prop-erties of the vertebrae and the discs are not taken into account. Nevertheless, such preliminary and geometrical approach gives an insight on the pathology.
In conclusion, it appears that AIS patients have more slen-der spines than the asymptomatic population, mostly because of smaller vertebral widths and depths. Lumbar vertebrae also appeared taller than in the normal population, irrespective of curve topology. While discs did not show alterations relative to the normal population, analysis of wedging suggests that lower junctional discs, together with the apex, could be locations of geometrical instability given the high coronal wedging. Numerical simulation and longitudinal clinical follow-up of patients could clarify how the combination of wedging, slen-derness and growth could impact the biomechanical mecha-nism of scoliosis progression.
Acknowledgements The authors are grateful to the BiomecAM chair programme on subject-specific musculoskeletal modelling (with the support of ParisTech and Yves Cotrel Foundations, Société Générale, Covea and Proteor) and to the DHU MAMUTH for funding. Compliance with ethical standards
Conflict of interest Dr. Skalli has a patent related to biplanar X-rays and associated 3D reconstruction methods, with no personal financial benefit (royalties rewarded for research and education) licensed to EOS
Imaging. Dr. Vialle reports personal fees and grants (unrelated to this study) from EOS Imaging.
Appendix
The slenderness ratio of a rod was defined by Timoshenko and Gere as r = H ⋅ √A∕I , where H is the rod length (or height), A is the cross-sectional area and I is the smallest second moment of area [27]. It is thus defined to take into account not only the cross-sectional area, but also its shape. An example can illustrate the physical meaning of slender-ness ratio; imagining a rod with a perfectly elliptical cross-sectional area, of radiuses a and b, the two second moments of inertia would be I1 = 𝜋∕4 ⋅ ab
3 and I
2= 𝜋∕4 ⋅ a 3
b .
Assuming a > b, then I1< I2, so the smallest second moment of area is I1. Remembering that the area of an ellipse is
A = πab, the slenderness ratio reduces to:
Therefore, the slenderness ratio of a rod with an ellipti-cal cross section is directly proportional to its length and inversely proportional to its smallest dimensions. In order words, the rod’s instability increases with an increase in length and with a decrease in its smallest side. Indeed, the rod’s feature leading to instability will be its smallest side, not its largest.
Of course, the vertebral cross-sectional area is not ellipti-cal; however, the second moments of inertia of each endplate can be calculated through integral calculus, and they will retain their sensitivity to the shape of the area. Moreover, since the two endplates do not have the same shape and size, the average of their respective minimum second moments of inertia can be calculated. Finally, the vertebral body height can be used to replace the rod’s length.
References
1. Archer IA, Dickson RA (1985) Stature and idiopathic scoliosis. A prospective study. J Bone Joint Surg Br 67:185–188
2. Aubin CE, Dansereau J, Petit Y, Parent F, De Guise JA, Labelle H (1998) Three-dimensional measurement of wedged scoliotic vertebrae and intervertebral disks. Eur Spine J 7:59–65 3. Chen H, Schlösser TPC, Brink RC, Colo D, van Stralen M, Shi
L, Chu WCW, Heng P-A, Castelein RM, Cheng JCY (2017) The height–width–depth ratios of the intervertebral discs and vertebral bodies in adolescent idiopathic scoliosis vs controls in a Chinese population. Sci Rep 7:46448. https ://doi.org/10.1038/srep4 6448
4. Deacon P, Flood BM, Dickson RA (1984) Idiopathic scoliosis in three dimensions. A radiographic and morphometric analysis. J Bone Joint Surg Br 66-B:509–512. https ://doi.org/10.1302/0301-620X.66B4.67466 83 r= H ⋅ √ 𝜋 ab 𝜋∕4 ⋅ ab3 = H √ 4 b2 = 2H b .
5. Dubousset J, Charpak G, Dorion I, Skalli W, Lavaste F, Deguise J, Kalifa G, Ferey S (2005) A new 2D and 3D imaging approach to musculoskeletal physiology and pathology with low-dose radia-tion and the standing posiradia-tion: the EOS system. Bull Acad Natl Med 189:287–300
6. Faro FD, Marks MC, Pawelek J, Newton PO (2004) Evaluation of a functional position for lateral radiograph acquisition in ado-lescent idiopathic scoliosis. Spine 29:2284–2289
7. Goto M, Kawakami N, Azegami H, Matsuyama Y, Takeuchi K, Sasaoka R (2003) Buckling and bone modeling as factors in the development of idiopathic scoliosis. Spine 28:364–370. https :// doi.org/10.1097/01.BRS.00000 48462 .90775 .DF
8. Humbert L, De Guise JA, Aubert B, Godbout B, Skalli W (2009) 3D reconstruction of the spine from biplanar X-rays using para-metric models based on transversal and longitudinal inferences. Med Eng Phys 31:681–687
9. Karnezis IA (2011) Flexural-torsional buckling initiates idiopathic scoliosis. Med Hypotheses 77:924–926. https ://doi.org/10.1016/j. mehy.2011.08.013
10. Kojoma T, Kurokawa T (1992) Quantitation of three-dimensional deformity of idiopathic scoliosis. Spine 17:22–29. https ://doi. org/10.1097/00007 632-19920 3001-00005
11. McAlinden C, Khadka J, Pesudovs K (2015) Precision (repeat-ability and reproducibility) studies and sample-size calculation. J Cataract Refract Surg 41:2598–2604
12. Meakin JR, Hukins DWL, Aspden RM (1996) Euler buckling as a model for the curvature and flexion of the human lumbar spine. Proc R Soc Lond Ser B Biol Sci 263:1383–1387
13. Millner PA, Dickson RA (1996) Idiopathic scoliosis: biomechan-ics and biology. Eur Spine J 5:362–373
14. Modi H, Suh S, Song H-R, Yang J-H, Kim H-J, Modi C (2008) Differential wedging of vertebral body and intervertebral disc in thoracic and lumbar spine in adolescent idiopathic scoliosis—a cross sectional study in 150 patients. Scoliosis 3:11
15. Nicolopoulos K, Burwell R, Webb J (1985) Stature and its com-ponents in adolescent idiopathic scoliosis. Cephalo-caudal dispro-portion in the trunk of girls. J Bone Joint Surg Br 67-B:594–601.
https ://doi.org/10.1302/0301-620X.67B4.40308 57
16. O’Brien MF, Kulklo TR, Blanke KM, Lenke LG (2008) Radio-graphic measurement manual. Medtronic Sofamor Danek USA, Inc, Memphis
17. Parent S, Labelle H, Skalli W, de Guise J (2004) Vertebral wedg-ing characteristic changes in scoliotic spines. Spine 29:E455–E462 18. Parent S, Labelle H, Skalli W, Latimer B, de Guise J (2002) Morphometric analysis of anatomic scoliotic specimens. Spine 27:2305–2311
19. Richards BS, Bernstein RM, D’Amato CR, Thompson GH (2005) Standardization of criteria for adolescent idiopathic sco-liosis brace studies: SRS committee on bracing and nonoperative management. Spine 30:2067–2068. https ://doi.org/10.1097/01. brs.00001 78819 .90239 .d0
20. Schultz AB, Sörensen S-E, Andersson GBJ (1984) Measurements of spine morphology in children, ages 10–16. Spine 9:70–73 21. Skalli W, Vergari C, Ebermeyer E, Courtois I, Drevelle X, Kohler
R, Abelin-Genevois K, Dubousset J (2017) Early detection of pro-gressive adolescent idiopathic scoliosis. Spine 42:823–830 22. Skogland LB, Miller JAA (1981) The length and proportions of
the thoracolumbar spine in children with idiopathic scoliosis. Acta Orthop Scand 52:177–185
23. Stokes IA (1994) Three-dimensional terminology of spinal deformity. A report presented to the scoliosis research society by the scoliosis research society working group on 3-D terminology of spinal deformity. Spine 19:236–248
24. Stokes IA, Spence H, Aronsson DD, Kilmer N (1996) Mechanical modulation of vertebral body growth. Implications for scoliosis progression. Spine 21:1162–1167
25. Stokes IAF, Aronsson D (2001) Disc and vertebral wedging in patients with progressive scoliosis. J Spinal Disord 14:317–322.
https ://doi.org/10.1097/00002 517-20010 8000-00006
26. Taylor JR, Twomey LT (1984) Sexual dimorphism in human ver-tebral body shape. J Anat 138(Pt 2):281–286
27. Timoshenko S, Gere J (1985) Theory of elastic stability. McGraw-Hill, New York
28. Townsend PR, Rose RM, Radin EL (1975) Buckling studies of single human trabeculae. J Biomech 8:199–200. https ://doi. org/10.1016/0021-9290(75)90025 -1
29. Trobisch PD, Ducoffe AR, Lonner BS, Errico TJ (2013) Choosing fusion levels in adolescent idiopathic scoliosis. J Am Acad Orthop Surg 21:519–528
30. Villemure I, Aubin CE, Grimard G, Dansereau J, Labelle H (2001) Progression of vertebral and spinal three-dimensional deformi-ties in adolescent idiopathic scoliosis: a longitudinal study. Spine 26:2244–2250
31. Xiong B, Sevastik JA, Hedlund R, Sevastik B (1994) Radiographic changes at the coronal plane in early scoliosis. Spine 19:159–164 32. Ylikoski M (2003) Height of girls with adolescent idiopathic scoliosis. Eur Spine J 12:288–291. https ://doi.org/10.1007/s0058 6-003-0527-x
Affiliations
Claudio Vergari1 · Mohammad Karam2 · Raphael Pietton3 · Raphael Vialle3 · Ismat Ghanem2 · Wafa Skalli1 ·
Ayman Assi2
* Claudio Vergari c.vergari@gmail.com
1 Institut de Biomécanique Humaine Georges Charpak, Arts et
Métiers, 151 bd de l’Hôpital, 75013 Paris, France
2 Laboratory of Biomechanics and Medical Imaging, Faculty
of Medicine, University of Saint-Joseph, Beirut, Lebanon
3 Department of Paediatric Orthopaedics, Armand Trousseau
Hospital, Université Pierre et Marie Curie-Paris 6, 75571 Paris, France