UNIVERSITÉ DU QUÉBEC À RIMOUSKI
Scaling MoE and MoR measurements for white spruce (
P
icea
glauca)
from mini-c1ear samples to fulliength lumber and
relating the results to tree-Ievel variables
Mémoire présenté
dans le cadre du programme de maîtrise en gestion de la faune et de ses habitats en vue de l'obtention du grade de maître ès sciences
PAR ©Li Li
Avertissement
La diffusion de ce mémoire ou de cette thèse se fait dans le respect des droits de son auteur, qui a signé le formulaire
«
Autorisation de reproduire et de diffuser un rapport, un mémoire ou une thèse». En signant ce formulaire, l'auteur concède à l'Université du Québec à Rimouski une licence non exclusive d'utilisation et de publication de la totalité ou d'une partie importante de son travail de recherche pour des fins pédagogiques et non commerciales. Plus précisément, l'auteur autorise l'Université du Québec à Rimouski à reproduire, diffuser, prêter, distribuer ou vendre des copies de son travail de recherche à des fins non commerciales sur quelque support que ce soit, y compris l'Internet. Cette licence et cette autorisation n'entraînent pas une renonciation de la part de l'auteur à ses droits moraux ni à ses droits de propriété intellectuelle. Sauf entente contraire, l'auteur conserve la liberté de diffuser et de commercialiser ou non ce travail dont il possède un exemplaire.Composition du jury:
Alain Caron, président du jury, Université du Québec à Rimouski
Robert Schneider, directeur de recherche, Université du Québec à Rimouski
Alexis Achim, codirecteur de recherche, Université Laval
Alain Cloutier, examinateur externe, Université Laval
AVANT-PROPOS
Cette étude a été réalisée sous la direction de Robert Schneider, cotitulaire de la Chaire de recherche sur la forêt habitée au Département de biologie, geographie et chimie de l'Université du Québec à Rimouski et sous la codirection d'Alexis Achim, professeur au Département des sciences du bois et de la forêt de l'Université Laval. Le présent travail s'intègre dans le cadre du réseau stratégique CRSNG sur l'aménagement forestier pour les produits à valeur ajoutée.
Le document a été rédigé dans le cadre d'une maîtrise menant au grade de maître ès sciences (M.Sc.). Il se compose de trois chapitres. Le premier chapitre propose une mise en contexte général et une revue de littérature. Le chapitre 2 vise à explorer l'effet du changement d'échelle sur les propriétés mécaniques. Ce chapitre a été écrit sous la forme d'un article en anglais qui sera soumis pour publication. Le dernier chapitre présente un retour sur les hypothèses ainsi que des recommandations.
J'aimerais d'abord remercier mon directeur. Il m'a permis de venir au Québec en m'offrant un projet en foresterie. Ensuite il a pu trouver un soutien financier. Enfin je suis reconnaissant du temps qu'il m'a accordé, de sa patience et pour les conseils qu'il m'a donnés pour la direction de mon projet et pour l'aide à la rédaction. Je voudrais aussi remercier mon codirecteur pour ses conseils concernant la méthodologie et la rédation de l'article.
Le projet n'aurait pas pu voir le jour sans l'implication des équipes d'Alexis Achim (Paradis Normand), de John Caspersen (Adam Kuprevicius) et de Frank Berninger (Hugues Power) dans la récolte des données sur le terrain et la prise de mesures en laboratoire. À mes collègues d'études (Sharad et Lu) qui m'ont beaucoup aidé pour que j'apprivoise les connaissances sur la forêt et en statistiques.
RÉSUMÉ
Les gestionnaires forestiers doivent prendre en considération plusieurs éléments tels que l'effet des traitements sylvicoles sur la qualité du bois pour établir leurs choix. Pour quantifier la qualité du bois d'œuvre, les propriétés mécaniques en flexion sont souvent employées. Ces mesures peuvent provenir de pièces de bois d'œuvre, ou sur des éprouvettes de petite taille sans défaut. Il est toutefois difficile de comparer les mesures des échantillons de tailles différentes, en partie car les essais en flexions emploient des méthodes différentes, et parce que le bois est un matérieu hétérogène avec des défauts. Ce projet propose de comparer les modules d'élasticité (MoE) et de rupture (MoR) provenant de 279 pièces de bois d'œuvre (3,8 x 8,9 x 250 cm) et de 544 éprouvettes (l x 1 x 15 cm). Les échantillons ont été prélevés sur 32 épinettes blanches (Picea glauca) ayant été récoltées dans une plantation à la forêt expérimentale de Petawawa, Ontario. Les propriétés mécaniques ont été mesurées par des essais en flexion statique à 3 points (éprouvettes) et 4 points (bois d'œuvre). Étant donné que les éprouvettes n'étaient pas associées au bois d'œuvre, une technique de rééchantillonnage a été développée afin de jumeler une éprouvette à une pièce de bois d'œuvre. Cette technique, appliquée 10 000 fois, a permis de bâtir une distribution de l'estimation des paramètres pour les variables à l'échelle de la cime, de l'arbre et du peuplement. Les résultats montrent que le MoE du bois d'œuvre était 290/0 plus grand que le MoE de l'éprouvette et inversement, que le MoR du bois d'œuvre était presque la moitié du MoR de l'éprouvette (53%). Les rapports du MoR et MoE sont proportionnels au diamètre à hauteur de poitrine et la longueur relative de la cime et inversement proportionnelle à la surface basale des 5 branches les plus grosses.
Mots clés: module d'élasticité, module de rupture, bois d'œuvre, éprouvette, technique de rééchantillonnage, épinette blanche (Picea glauca)
ABSTRACT
Stiffness and strength are generally obtained on either small c1earwood or on full-length lumber for quantifying wood quality. Scaling the values between sample sizes is hard due to the differences in testing method, wood properties and defect occurrence. This study explored the relationship of stiffness (MoE) and strength (MoR) measures between two sample sizes as weil as the effects of tree-level variables on the scaling process. Tree and branch data were collected from 32 white spruce (Picea glauca) trees from a spacing trial in eastern Canada established in 1936. Each selected tree was bucked into logs and bolts, which were then processed into 3.8x8.9x250 cm and 1x1x15cm pieces. The moduli were obtained from 4- and 3-point bending tests for lumber and mini-clear, respectively. The lumber to mini-c1ear relation was modeled with a resampling technique, with two pairing methods run 10 000 times each. The MoE and MoR ratios were then related to stand, tree and crown characteristics using a linear regression for each resampling run, and the distribution of the estimated parameters used for inference. Lumber MoE was 29% larger than mini-c1ear MoE, unlike the lumber MoR which was 53% of the mini-c1ear MoR. Furthermore, in both simulating senarios, DBH and crown ratio were positively proportion al to both scaling ratios; contrarily, basal area of 5 biggest branches was negatively proportion al to scaling ratios. The variables explaining the MoE and MoR ratios in final models were similar between two scenarios.
Keywords: modulus of elasticity, modulus of rupture, lumber, mini-c1ear, resampling technique, white spruce (Picea glauca)
TABLE DES MATIÈRES
AVANT-PROPOS ... VII RÉSUMÉ ... IX
ABSTRACT ... XI
LISTE DES TABLEAUX ... XV
LISTE DES FIGURES ... XVII
INTRODUCTION ... 1
CHAPITRE 1 REVUE DE LITTÉRATURE ... 3
1.1 LES PROPRIÉTÉS MÉCANIQUES EN FLEXION DU BOIS ... 3
1.2 MESURE DES PROPRIÉTÉS MÉCANIQUES EN FLEXION ... 6
CHAPITRE 2 SCALING MOE AND MOR MEASUREMENTS FOR WHITE SPRUCE FROM MINI-CLEAR SAMPLES TO FULL-LENGTH LUMBER AND RELATING THE RESULTS TO TREE-LEVEL VARIABLES ... 9
ABSTRACT ... 9 2.1 INTRODUCTION ... 10 2.2 MATERIAL ... 11 2.3 METHOD ... 14 2.4 RESULTS ... 18 2.5 DISCUSSION ... 21 2.6 CONCLUSION ... 25 ACKNOWLEDGEMENTS ... 25
CHAPTIRE 3 CONCLUSIONS ET IMPLICATIONS DE L'ÉTUDE ... 27
LISTE DES TABLEAUX
Table 1. Mean characteristics of tree, crown and branch of each treatment level. ... 12 Table 2. Mechanical properties and other wood properties of mini-clear and lumber ... 14
LISTE DES FIGURES
Figure 1. The stability of parameter f30E (Eq. 11) ... 18 Figure 2. Lumber MoE (a) and MoR (b) versus mini-c1ear MoE and MoR (buble size is
proportion al to the variance of mini-c1ear moduli through the dataset) ... 19 Figure 3 .Parameter estimate distributions of f3IE (dbh, a), f32E (crown ratio, b), f33E (basal
area of 5 biggest branches, c), f34E (log position, d) of the random and weighted pairing MoE ratio models with average parameter value and 95% confidence intervals shown (dotted lines) ... 20 Figure 4. Parame ter estimate distributions of f3IG (dbh, a), f32G (crown ratio, b), f33G (basal
area of 5 biggest branches, c), f34G (branch density, d), f35G (log position_middle, e), f36G (log position_top, f) of the random and weighted pairing MoR ratio models with average parameter value and 95% confidence intervals shown (dotted lines) ... 22
INTRODUCTION
L'évaluation de la qualité du bois est importante pour prendre des décisions
sylvicoles éclairées. Cependant, les critères pour l'évaluer dépendent des produits forestiers
désirés (Zhang et al. 1997). Les propriétés mécaniques, mesurées par le module de l'élasticité (MoE) et le module de rupture (MoR), sont importantes pour déterminer la qualité du bois d'œuvre et, par conséquent, la valeur des pièces (Zhang et al. 1997). Les caractéristiques anisotropes et la variabilité des propriétés physiques et chimiques contribuent à la grande variabilité des propriétés mécaniques (Shmulsky and Jones 2011).
Généralement, l'évaluation de la ressource forestière en termes de qualité du bois d'œuvre est réalisée au moyen d'un échantillonnage destructif sur des pièces de bois (Lei et al. 2005, Beaulieu et al. 2006, Zhang et al. 2006, Liu et al. 2007b). Étant donné que ces
pièces sont de grandes dimensions (généralement 3.8x8.9x250 cm ou 2"x4"x 8'), il est
difficile de faire le lien entre les propriétés mécaniques et les propriétés du bois à une échelle microscopique, telles que la composition chimique des parois cellulaires, la
structure anatomique du bois, etc. De plus, l'évaluation des propriétés mécaniques de petits arbres ne peut être effectuée avec des échantillons de bois de grande taille.
À une échelle plus fine, des éprouvettes de bois de petite taille (c.-à-d. 2 cm x 2 cm x 30 cm) peuvent être employés pour évaluer la variation des propriétés mécaniques le long d'un arbre (Auty and Achim 2008, Schneider et al. 2008a, Jiang et al. 2012, Kuprevicius et
al. 2013). Avec ce type d'échantillon qui est exempt de défauts, il est possible de mieux corréler les propriétés mécaniques aux caractéristiques physiques et anatomiques (Reiterer
et al. 1999, McLean et al. 2010). Les éprouvettes permettent également d'évaluer les propriétés mécaniques dans les jeunes peuplements (Lindstrom et al. 2002).
2
Il n'existe malheureusement aucune étude comparative entre les propriétés
mécaniques obtenues sur du bois d'œuvre et des éprouvettes. La comparaison de ces tailles d'échantillon n'est pas directe, étant donné que le bois d'œuvre a de nombreux défauts tels
que les nœuds, et les éprouvettes ont moins de défauts et aucun nœud. De plus, les normes de mesurage des propriétés mécaniques diffèrent entre le bois d'œuvre et les éprouvettes (Madsen and Buchanan 1986, Madsen 1990, Brancheriau et al. 2002). Le MoE et MoR
varient avec la densité du bois (Kretschmann 2010) et les propriétés des fibres (LindstromI997). Ces facteurs sont fortement corrélés au stade de développement de l'arbre (Alcorn et al. 2008), à son taux de croissance (Houllier et al. 1995), et à la qualité de
station (Beaulieu et al. 2006). Ces propriétés varient aussi à l'intérieur d'un arbre en
direction radiale et longitudinale (Kretschmann 2010, Shmulsky and Jones 2011).
Il existe donc une grande variation des propriétés du bois au sein d'un morceau de bois, et la variabilité augmente avec la taille de l'échantillon. Ces variations expliquent donc
en partie les différences en propriétés mécaniques observées entre des pièces de bois de
taille différente (Madsen and Buchanan 1986, Madsen 1990, Pedersen et al. 2003). La présence de nœuds et de défauts naturels réduira le MoE et le MoR pour le bois d'œuvre comparativement aux éprouvettes (Zhou et Smith 1991, Moore et al. 2009a).
L'objectif de cette étude est d'explorer la relation entre les propriétés mécaniques du bois d'œuvre et celles des éprouvettes. Cette comparaison permettra alors de mieux évaluer l'effet des défauts sur les propriétés mécaniques, et de relier ces défauts aux caractéristiques
des arbres comme la taille de la cime vivante, la quantité de branches, la taille de l'arbre et
CHAPITRE 1 REVUE DE LITTÉRATURE
1.1 LES PROPRIÉTÉS MÉCANIQUES EN FLEXION DU BOIS
Le bois est une matière anisotrope et hétérogène. Sa formation est influencée par le
développement primaire et secondaire de l'arbre (Shmulsky and Jones 2011). Les
propriétés mécaniques varient selon les orientations radiales, tangentielles et longitudinales (Kretschmann 2010). Les propriétés mécaniques en flexion statique sont généralement quantifiées par les modules d'élasticité (MoE) et de rupture (MoR) (Zhang et al. 1997). Le module d'élasticité correspond à la capacité de résister à une déformation plastique produite par une charge (Shmulsky and Jones 2011). Un bois est plus rigide lorsque le bois se
déforme moins pour une même charge. Le module de rupture est une mesure de la capacité
maximale de support d'une pièce (Shmulsky and Jones 2011). La valeur du bois d'œuvre
est souvent relié à ces propriétés (Lei et al. 2005, Beaulieu et al. 2006, Liu et al. 2007b, Jiang et al. 2010, Vikram et al. 2011).
Il est généralement bien admis que la structure et les caractéristiques anatomiques de l'arbre ont des effets importants sur les propriétés mécaniques. Il se trouve que l'angle des microfibrilles (MFA) dans la paroi cellulaire secondaire (couche S2) des fibres et des trachéides est inversement proportionnel au MoE chez plusieurs espèces (Lichtenegger et al.
1999, Barnett and Bonham 2004, Lundgren 2004, Donaldson 2008, Lasserre et al. 2009,
McLean et al. 2010, Watt et al. 2011). Le MFA entraîne un retrait longitudinal plus important, ce qui diminue la rigidité à la flexion de la pièce de bois. De nombreuses études
ont confirmé la dépendance de MFA à l'âge cambial (Lichtenegger et al. 1999, Donaldson
2008, Lachenbruch et al. 2010, Watt et al. 2011). Le MFA plus élevé du bois juvénile offre une grande flexibilité aux gaules assurant une survie aux stress environnementaux. La
4
réduction du MFA au stade juvénile aurait un impact économique important par l'augmentation de la qualité des produits provenant du bois juvénile (Amarasekera and
Denne 2002, Ivkovié et al. 2009).
La longueur des fibres, le diamètre et l'épaisseur des parois des trachéides ont des effets différents sur les propriétés mécaniques du bois. La longueur des fibres est un attribut important pour les produits structuraux, car la résistance au flambage des poutres est proportionnelle à la longueur des fibres (Stark and Rowlands 2003). On sait également que
la longueur des fibres est corrélée négativement avec le MFA (Deresse et al. 2003, Sheng -zuo et al. 2004). La masse volumique, qui constitue la base du matériau, est déterminée en
partie par le diamètre des trachéides et leur épaisseur. Il est aussi bien connu que les propriétés mécaniques du bois varient entre le bois initial et le bois final.
La densité du bois est un facteur important qui influence les propriétés en flexion (Downes et al. 2009). Les relations entre la masse volumique et les propriétés mécaniques varient beaucoup selon les espèces et le site (Lasserre et al. 2008, Lasserre et al. 2009). Généralement, les deux modules sont positivement corrélés à la densité du bois. Une densité du bois plus grande, induite par une proportion de bois final plus élevée, une plus faible largeur de cerne, des parois plus épaisses et un rapport de paroi/lumen plus élevé assurent une plus grande rigidité à l'arbre. Diverses études ont montré que la rigidité du bois pouvait être bien estimée à partir de sa densité (Auty and Achim 2008, Jiang et al 2010, Vikram et al. 2011, Jiang et al 2012) .. Par contre, des études ont également signalé que du
bois pLus dense pouvait avoir une plus grande concentration de résine et autres composés chimiques (Mtikinen et al. 2002), ce qui peut réduire les propriétés mécaniques. De plus, la relation entre l'augmentation de la densité du bois et l'augmentation de la résistance mécanique peut être disproportionnée (Larjavaara and Muller-Landau 2010).
Le bois juvénile est formé dans la cime vivante lorsque l'âge cambial est faible (Burdon et al. 2004). Les propriétés du bois juvénile diffèrent considérablement de celles du bois mature parmi lesquelles certains facteurs diminuent la résistance et la rigidité. Par exemple, le bois juvénile est caractérisé par un MFA plus grand, des trachéides plus courtes,
un diamètre du lumen plus grand, une épaisseur plus mince des parois cellulaires et/ou une concentration en extractibles plus élevée (Burdon et al. 2004). L'âge cambial auquel la transition entre le bois juvénile et le bois mature a lieu varie selon les espèces et les conditions de croissance (Sauter et al. 1999, Mutz et al. 2004, Clark et al. 2006).
Les propriétés mécaniques dans les sections ayant des nœuds sont plus faibles que
dans les sections de bois sans nœud lorsque les autres facteurs sont bien contrôlés (Zhou
and Smith 1991, Zhang et al. 2002). La présence de nœuds interrompt la continuité et
l'uniformité des fibres de bois, ce qui a comme effet de perturber la distribution des stress
de déformation dans la pièce de bois (Archer and Wilson 1973, Barrett et al. 1981) et
d'augmenter la probabilité de bris. La grandeur, le type, la fréquence et l'emplacement des
nœuds sont des facteurs qui influencent grandement les propriétés en flexion (Zhou and
Smith 1991). La rigidité de flexion est généralement faible dans des pièces de bois dans
lesquelles les nœuds sont plus grands et plus fréquents (Moore et al. 2009a). La résistance
diminue proportionnellement à la taille des nœuds et à leur fréquence (Chui 1991). Les
nœuds adhérents (issus de branches vivantes) ont moins d'effets sur les propriétés
mécaniques que les nœuds non adhérents issus de branches mortes (Chui 1991, Lemieux et
al 200 1, Moberg 200 l , Benjamin et al 2009). De plus, la localisation des nœuds influencera
aussi les propriétés mécaniques en flexion, puisqu'un nœud au milieu de la pièce de bois
réduira de façon plus importante les propriétés, comparativement à un nœud en bordure de
la pièce (Chui 1991, Morel and Valentin 1996, Let et al 2005).
Les caractéristiques anatomiques qui influencent les propriétés mécaniques varient
avec le statut de l'arbre. Par exemple, les arbres opprimés et intermédiaires ont une masse
volumique plus élevée que les arbres codominants et dominants (Lasserre et al. 2009). Les
variations avec le statut social de l'arbre de la masse volumique et des propriétés
mécaniques peuvent être expliquées par la différence en DHP et en hauteur entre les arbres,
et aussi par la densité du peuplement (Liu et al. 2007b). La surface d'aubier, la proportion
de bois initial et le MFA sont aussi plus grands pour les arbres poussant plus rapidement
6
La croissance, le statut et la compétition sont influencés par la forme et la taille de la
cime, qui elles sont déterminées par l'emplacement et la taille des branches (Borders et al.
2004, Fahlvik et al. 2005). La longueur et le rayon de la cime sont de bons indicateurs de la
vigueur d'un arbre, son taux de croissance, sa capacité photo synthétique et la compétition
qu'il subit. La relation entre les attributs de la cime et les paramètres de la qualité est bien connue (Dunham and Cameron 2000). Par exemple, la masse volumique, le MoR et le MoE
sont inversement liés à la longueur de la cime (Janse-Ten Klooster et al. 2007).
Les caractéristiques des nœuds sont directement liées à la fréquence, au type (vivant ou mort) et à la grosseur des branches, qui varient avec le niveau de compétition que l'arbre
subit (Kellomaki et al. 1999, Kantola et al. 2008, Benjamin et al. 2009). Le taux de
mortalité des branches détermine la longueur de, la couronne, par conséquent le type de nœud (Makinen and Colin 1999).
De nombreuses études ont montré que la densité de peuplement influence la
croissance de l'arbre (Woodruff et al. 2002, Zhang et al. 2002, Moore et al. 2009a). La
croissance diamétrale, la longueur de la cime et la grosseur des branches sont inversement
proportionnelles à la densité du peuplement. Toutefois, l'effet du vent et de la neige
augmentent la mortalité des branches lorsque la compétition diminue avec la densité de
peuplement (Hein et al. 2007).
1.2 MESURE DES PROPRIÉTÉS MÉCANIQUES EN FLEXION
L'essai statique en flexion est une méthode précise et efficace pour mesurer les
propriétés mécaniques d'une pièce de bois (Kretschmann 2010). Plusieurs normes existent
pour évaluer le MoR et MoE, et ces normes emploient des essais en flexion à 3 ou 4 points.
L'essai de flexion à 4 points est souvent employé pour des pièces qui peuvent comporter
des défauts. Cet essai est caractérisé par 2 points d'appui et 2 points de charge. L'essai à 3 points, où la charge est appliquée en 1 seul point, est inapproprié pour les pièces avec des
nœuds, car leur effet sur le MoE et MoR est non linéaire. Le test à 4 points est donc
généralement employé pour évaluer les propriétés mécaniques du bois d'œuvre.
L'essai de flexion à 3 points concentre le stress au centre des pièces. Il est également
souvent utilisé pour de petits échantillons sans défauts, dans le but de mieux mettre en
relation le MoE et MoR avec la croissance des arbres. La petite taille de l'échantillon
permet de réduire la variabilité intrinsèque du bois et éviter les défauts tels que les nœuds.
Il existe toutefois des différences entre les mesures obtenues par les différents essais
en flexion. Les propriétés mécaniques en flexion sont sensibles à la configuration de charge.
Madsen (1990) a montré que les mesures de MoR obtenues par un essai en flexion à 3
points et un à 4 points ne concordent pas. De plus, il a noté des variations pour le même
morceau de bois entre les mesures de MoE obtenues par deux types d'essais en flexion. Il a
remarqué que l'effet d'indentation et l'effet de cisaillement (shear) amènent à une sou
CHAPITRE 2 SCALING MOE AND MOR MEASUREMENTS FOR WHITE SPRUCE FROM MINI-CLEAR SAMPLES TO FULL-LENGTH LUMBER AND RELATING THE RESULTS TO TREE-LEVEL VARIABLES
ABSTRACT
Stiffness and strength are generally obtained on either small c1earwood or on full-length lumber for quantifying wood quality. Scaling the values between sample sizes is hard due to the differences in testing method, wood properties and defect occurrence. This
study explored the relationship of stiffness (MoE) and strength (MoR) measures between two sample sizes as weIl as the effects of tree-Ievel variables on the scaling process. Tree
and branch data were collected from 32 white spruce (Picea glauca) trees from a spacing
trial in eastern Canada established in 1936. Each selected tree was bucked into logs and
bolts, which were then processed into 3.8x8.9x250 cm and 1xlx15cm pieces. The moduli were obtained from 4- and 3-point bending tests for lumber and mini-c1ear, respectively. The lumber to mini-c1ear relation was modeled with a resampling technique, with two
pairing methods run 10 000 times each. The MoE and MoR ratios were then related to
stand, tree and crown characteristics using a linear regression for each resampling run, and
the distribution of the estimated parameters used for inference. Lumber MoE was 29%
larger than mini-c1ear MoE, unlike the lumber MoR which was 53% of the mini-c1ear MoR. Furthermore, in both simulating senarios, DBH and crown ratio were positively proportion al to both scaling ratios; contrarily, basal area of 5 biggest branches was
negatively proportion al to scaling ratios. The variables explaining the MoE and MoR ratios
10
2.1 INTRODUCTION
The static bending (flexural) stiffness and strength, expressed through the modulus of elasticity (MoE) and the modulus of rupture (MoR), are among the most important product properties that determine the end uses and grade yield of lumber (Brüchert et al. 2000,
Zhang et al. 2002). Static lumber bending tests provide the most direct estimation of these properties (Kretschmann 2010), and they have thus been used to investigate the impact of forest management and tree characteristics on lumber mechanical properties in man y species (Lei et al. 2005, Beaulieu et al. 2006, Zhang et al. 2006, Liu et al. 2007b). However, the large dimensions of full-size lumber imply that such measurements are hardi y applicable to small trees, which limits the capacity to monitor bending properties at an early
stage. The scale of observation also limits the possibility to study the effects of growth rate (i.e. ring width). Moreover, the observed properties will be affected by the presence of natural defects such as knots. In addition, destructive tests on a large number of samples of full-size lumber entail high acquisition fees.
Clear wood samples describe the mechanical properties at a smaller scale with fewer defects and more homogenous wood (Auty and Achim 2008, Schneider et al. 2008b, Jiang et al. 2012, Kuprevicius et al. 2013). So-called 'mini-clear' samples have therefore often been used to relate growth characteristics and bending properties. Mini-clear samples can also be used to assess the effects of axial and radial location within the stem and cambial age on the wood mechanical properties (Auty and Achim 2008, Kuprevicius et al. 2013). The comparison between measurements taken on full size lumber and mini-clear samples
cou Id therefore be used to 1) to improve our understanding of the effects of growth on the properties of end-use products and 2) to help quantify the importance of internaI defects on lumber mechanical properties.
MoE and MoR vary however with sample size. Differences result both from
inherent to the structure of wood, and to the occurrence of defects in the material (Shmulsky and Jones 2011). The smaller sized mini-c1ear samples are mostly defect-free, leading to a higher interrelationship between mechanical properties and physical properties.
In contrast, defects such as knots, both dead and sound, present on lumber pieces create zones of weakness that affect the overall mechanical performance (Zhou and Smith 1991, Lemieux et al. 2001, Benjamin et al. 2009, Kretschmann 2010). Contrarily to lumber (ASTM 2007), there are no standard procedures applicable to mechanical tests on mini-c1ear samples, leading to further difficulties in scaling from one measurement to another.
The overall objective of this study was thus to explore the relationship between
mechanical properties measured on full size lumber and mini-c1ear samples. Specifically, two randomized processes (total random probability and weighted probability) were used to simulate lumberlmini-c1ear pairs obtained from the same trees. These pairs were then used to assess the links between mechanical properties relationships and the presence of defects,
estimated through tree-and stand-Ievel variables.
2.2 MATERIAL
The study was performed in a white spruce (Picea glauca) plantation located in the Petawawa Federal Research Forest in Eastern Canada (460
00' N, 770
25' W). A total of 32 trees were sampled from a white spruce spacing trial. The Lost Plantation was established by the Canadian Forest Service in 1936 with 1.8 m spacing between the seedlings. Thinning operations were carried out in 1962, 1972 and 1982 to maintain the plots at four levels of residual basal area: 18,25, 32 and 42 m2ha·J
, with 2 replicates per basal area level, with 8 permanent sample plots in total.
In 2008, 32 trees, four trees per plot were destructively sampled. Prior to felling, diameter at breast height (DBH, at 1.3 m height from ground) was measured for aU the live trees (Paradis 2011, Kuprevicius et al 2013, Power et al 2014). For each plot, the trees were
12
randomly selected from the DBH quartiles as to select trees within each social class: Le. one dominant, two co-dominants and one intermediate.
Once felled, total tree height (TH) and height to crown base (HtCB) were measured,
from which crown length (CL) and crown ratio (CR, crown length to total height ratio) were calculated. The location, orientation and diameter of each living branch was then measured and used to calculate branch density (BrD), diameter (BrDia) and basal area of five biggest branches (BrBA). Each stem was then bucked into 3 logs, with the base of each log being at three different heights, namely 1.3 m, 4.1 m and 6.9 m. A 40 cm boit was taken between branch whorls close to the base of each log to reduce the chance of internai knots
occurrence and was then cut into a 2.5cm-thick plank in the north-south direction.
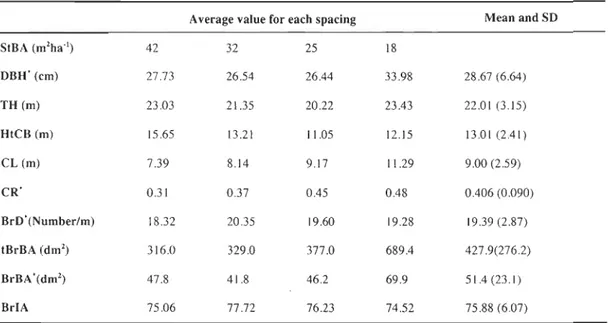
Table 1. Mean characteristics of tree, crown and branch of each treatment level A verage value for each spacing Mean and SD
StBA (m2ha'l) 42 32 25 18 DBH' (cm) 27.73 26.54 26.44 33.98 28.67 (6.64) TH (m) 23.03 21.35 20.22 23.43 22.01 (3.15) HtCB (m) 15.65 13.21 Il.05 12.15 13.01 (2.41) CL(m) 7.39 8.14 9.17 Il.29 9.00 (2.59) CR' 0.31 0.37 0.45 0.48 0.406 (0.090) BrD'(Number/m) 18.32 20.35 19.60 19.28 19.39 (2.87) tBrBA (dm2 ) 316.0 329.0 377.0 689.4 427.9(276.2) BrBA'(dm2 ) 47.8 41.8 46.2 69.9 51.4 (23.1) BrIA 75.06 77.72 76.23 74.52 75.88 (6.07)
The measurements with asterisk () are significant (at least for one model) and included in final models
Mini-clear samples (1 X 1 X 15 cm) were cut from the northern facing radius of each plank. The mini-clear samples were sawn with careful attention to ensure a straight grain and avoid major defects such as knots, decay and reaction wood. However, pin knots were unavoidable in the samples close to the pith. The distance from the pith, mean cambial age and wood density at 12 % moisture content of each mini-clear sample were noted.
The logs were sawn manually using a portable sawmill (Wood-Mizer Products lnc., Indianapolis, IN). Lumber pieces were then dried to a target moisture content of 12% in a
convention al kiln using a species-specific schedule. The schedule included a conditioning
treatment to release internaI stresses resulting from the drying operation. Finally, lumber pieces were planed to obtain the required dimensions of 2"x4"x8' (3.8 cm x 8.9 cm x 250 cm) lumber. Prior to processing, the juvenile core was painted (from the pith to ring 20) at both ends of each log, which allowed to estimate a proportion of juvenile wood for each lumber piece. The density at a nominal 12% moi sture content of each piece was obtained by measuring both volume and mass.
The bending properties were obtained by destructive testing. Prior to testing, both the mini-clear samples and the lumber were stored in a conditioning chamber so that aIl samples tended towards the target moisture content of 12%. The lumber mechanical properties were obtained by using 4-point static bending test following the ASTM D-198 standard (ASTM 2007). The modulus of elasticity (MoE) and modulus of rupture (MoR) of the mini-clear samples were measured with a 3-point statie bending test with the reference of the ASTM D-143-94 standard (ASTM 2007), regarding that this standard is close to currently mini-clear dimension,
Table 2. Mechanical properties and other wood properties of mini-clear and lumber
Number MoE (GPa) MoR (MPa) SG JWP Mean age
Mini-c1ear 544 8.56(1.60) 77.2(11.1) 0.367(0.043) 19.9(13.0)
14
2.3METHOD
Method overview
The study focused on the individual lumber-to-mini-c1ear, or piece-to-piece
mechanical relationship, instead of average lumber to average mini-c1ear on a tree or plot
level because of the heterogeneity of wood. Such study design has the advantage of providing insight into defect effect on lumber mechanical performance by creating a control object. However, the main difficulty was that the lumber pieces were generally saw-milled without noting the radial location of each piece. It could only be indirectly assessed through the estimated proportion of juvenile wood of each piece. Furthermore, because mini-c1ear
samples were collected in a continuous sequence from pith to bark, the y could not be physically paired with a given piece of lumber. Thus the lumber pieces from a same log
have a certain probability of being related to the mini-c1ear samples from the nearby boit. To caIculate ail possible combinations and permutations of lumber (N=279) to mini-c1ear
(N=544) pieces is computationally impossible due to the large amount of lumber and
mini-clear samples.
A resampling technique was thus used to establish the lumber to mini-c1ear relationship. A given lumber piece was randornly paired with a mini-c1ear piece. The pairing probability was deterrnined by 2 different methods: entirely random or weighted. A dataset consisted of ail the lumber pieces paired to a mini-c1ear piece. This process was
then carried out for
la
000 times to creat 10 000 datasets.For each dataset, the response or dependent variable was defined as the mechanical property ratio of lumber to mini-c1ear (i.e. lumber's MoE to mini-c1ear's MoE ratio and
lumber's MoR to mini-c1ear's MoR ratio, hereafter be refered as moduli ratios or
mechanical pro pert y ratios). The ratios were then regressed as a linear function of tree,
dataset. Thus for each parameter, a distribution was built with the estimates of each dataset. The confidence interval for the estimated parameter was then constructed using its distribution. AB pairing methods and data analysis were carried out using the R statistical software (R Development Core Team, 2012).
Random pairing method
In the random pairing method, each lumber piece was randomly paired to a mini-c1ear from the nearest boit in the same tree. The selection probability, or 'weight', of each mini-c1ear in the nearest boit was thus held constant.
Probij
=
t
1 i=
1 ... kJ J(1) where Probjj is probability for ith mini-c1ear being paired to lumber piece j, kj is the number of mini-c1ear samples from the nearest boit of lumber piece j.
Weighted probability pairing method
In the second method, the probability of a mini-c1ear being paired to a given lumber piece was weighted according to measured characteristics on both the lumber and mini-c1ear samples. The wood density (WD) and juvenile wood proportion (JWP) of a piece of lumber were used to weight the pairing probability. The assumption was made that the pairing probability of two pieces with similar characteristics is greater, therefore the probability of pairing was inversely proportional to their differences in wood density and average age:
Prob· °
=
Prob!tGE*
ProbY(D~ ~ ~ (2)
Where:
AGE _ {jWPjl when ith miniclear is juvenile probijO
- 1 jWP h ° h . ° 1 °
16
1_(6WOili (or i2il)
q,lj(or 2j)
Lkl~(Or k2j) _ [l_(6WOi1 j (or i2il)1 11-1 (or 12-1) q,lj(or 2j)
(4)
where Probij is probability for ith mini-clear being paired to lumber piece j, kj is the
number of mini-clear samples from the nearest boIt, probAGEjj is the probability determined
by average cambial age of the ith mini-clear sample as weIl as JWPj' the juvenile wood percentage for lumber piece j, ProbWDjj is the probability determined by the difference in wood density. Furthermore, the ProbWO
jj for juvenile mini-clear and mature mini-clear was
caIculated separately, to make sure that the pairing method was independent for both groups. Therefore, il denotes the mini-clear for which AGE::; 20, and i2 denotes the mini-clear for which AGE> 20, klj is the number of mature mini-clear samples (denoted as ilj) and k2j is the number of juvenile mini-clear samples (denoted as i2j), L1WDi1j (ori2j) is the absolute value of the difference in wood density between mini-clear ilor2 and lumber piece j,
C/Jj is a normalizer which is used to adjust the pairing probability so that <Plj (or 2j) was defined as Maximum{ L1WDi1j (or i2j)' where ilj (or i2j) E (1: k1j(or k2j))}. In other
words, the normalizer is defined as the biggest difference in wood density within each sub-sample.
Sets afdata
The MoE and MoR ratios for each lumber/mini-clear pair ln each of the
10 000 datasets were then computed.
RatioMOE jL
=
MoEJ..Bjl (5)MoEMCil
RatioMOR jL
=
MoRJ..B jl(6)
where MoELBj) denotes the MoE of lumber piece j in the dataset l, l denotes the Ith dataset or lth repeating run, l E (1: 10 000), and MoEMcj) denotes the MoE of the mini-c1ear sample which was paired with lumber piece j in the datas et l (same for MoR).
Model development
Ali available tree- and stand-Ievel measurements (Table 1) were considered as
covariates for the models. The collinearity was first checked among covariates and crown length (CL) was deleted in the analysis as it showed high collinearity based on the variance inflation factor (Zuur et al. 2009). A multiple linear regression model was built for each dataset (Eqs. 7 and 8).
RatioMoE jl
=
f3
LEX+
EjlE(7)
(8)
or
(9)
Where Yj) is either the predicted MoE or MoR ratio for dataset l,
Pl
a vector of estimated parameters from dataset l, and X is the covariates matrix, jl denotes the order of lumber/mini-c1ear pairs in the dataset 1. The parame ter estimates from each dataset were then used to construct the parameter distributions. The 95% confidence intervals of each parameter distribution were used to infer if a parameter was significantly different from 0,with all covariates having estimates different than
°
being kept in the final models. Finally,a comparison between the two pairing methods was carried out to verify the sensitivity of the results to the pairing method.
18
2.4RESULTS
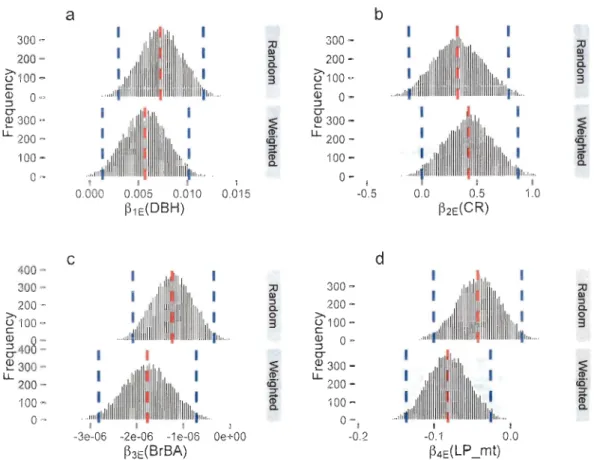
The ratio and coefficient distributions stabilized after 2 500 pairing steps (Figure 3),
and no further differences were obtained by creating more datasets, which confirmed that
10 000 repeating times was large enough to ensure representiveness. Illustrated in Figure 1 is the average value of
!3
OIE of Eq.11, with similar results being observed for the other parameters (not illustrated). Various comparisons, inc1uding paired-t tests on the average lumber/mini-c1ear ratios at the pair level and tree level, were done and no significantdifference of average ratios of mechanical properties can be confirmed with the respect to
the pairing methods.
lJ.J o CCl. 1.25 1.20 -1.15 1.10 -1 1 1
o
2500 5000 Number of datasetsFigure 1. The stability of parameter
!3
OE (Eq. 11)1 1
7500 10000
After eliminating the non-significant covariates, diameter at breast height (DBH) and
total branch basal area (BrBA) remained in the MoE model with random pairing, while
DBH, crown ratio (CR), BrBA and log position (LP ml' mid and top logs being in the same
group) were significant covariates in the weighted pairing MoE model. Both MoR models
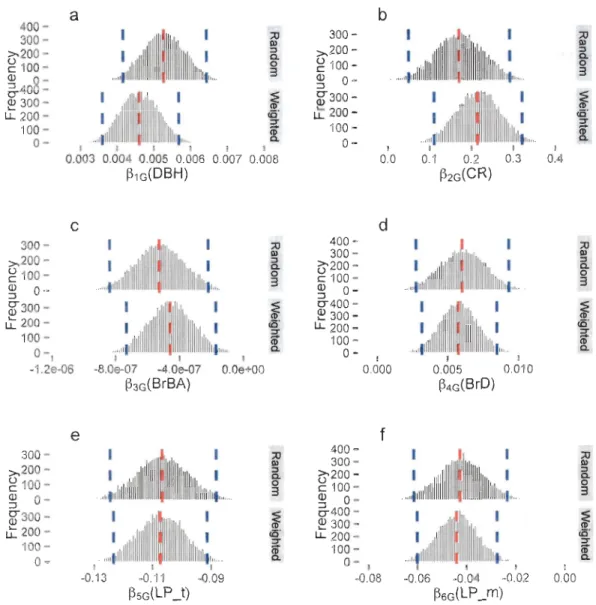
(i.e. for random and weighted pairing methods) had DBH, CR, branch density (BrD), BrBA
0.066) and LP (p=0.160) for both MoE models and CR (p=0.098) for the random pairing
MoE model close the set level of significance (a=0.05), while the other covariates were
highly insignificant. Final models are as follows:
RatioMOEj
=
POE+
PiE' DBH+
P2E • CR+
P3E • BrBA+
PS E ' LPmt+
EjE (11)(12&13) a b 125 -éQ15000 - MoE_Var éQ100 - MoR_Var a.. 0 a.. :::2: :::2: 0
·
500 ; ; 75 -Lt5 10000-.
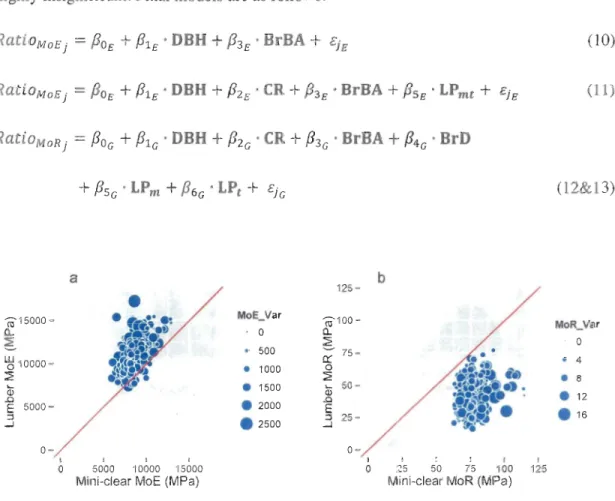
4 • 1000 0 :::2: :::2: • 8 Qi • 1500 Qi 50 -.n . 2000 .n . 12 E 5000 - E . 16 ::l . 2500 ::l 25 --1 -1 0- 0 -1 1 1 1 1 1 1 1 1 1 0 5000 10000 15000 0 25 50 75 100 125Mini-clear MoE (MPa) Mini-clear MoR (MPa)
Figure 2. Lumber MoE (a) and MoR (b) versus mini-clear MoE and MoR (buble size is
proportion al to the variance of mini-clear moduli through the datas et)
As illustrated in Figure 2a, lumber MoE is larger than mini-clear MoE in most cases,
which was also confirmed by the average MoE ratio (MoEJb/ MoE_me = 1.29). The
coefficient estimates for OBH (both pairing methods) and CR (weighted pairing method)
were positive. In contrast, the MoE ratio was negatively related to BrBA and log height (LPmt)·
20 300 - 200-1)'100 -e ~ 0 -0" ~ 300-~ 200 - >-100 -0 -400 -300 - 200-u 100-e Q)
8
-~40 -~ 300-~ 200 -100 -0-a
1 0.005 0.010 ~1E(D8H)c
1 1 -2e-06 -1e-06 ~3E(8r8A) ;U QI ::l e. 0 3 ~ tB· ~ e. 1 0.015 ;U QI ::l e. 0 3 ~ tB· =r CD e. 1 Oe+OO b 300 -200 -1)'100 -e Q) 0 -:::J 0" ~ 300 -~ 200-100 -0- 1 -0.5 d 300 -200 -1)' 100 -e Q) 0 -:::J 0" ~ 300-~ 200 - 100-0-1 -0.2 1 0.0 0.5 ~2E(CR) 1 -0.1 ~4E(LP _mt) 1 0.0 ;u QI ::l e. o 3 ;u Dl ::l e. o 3Figure 3. Parame ter estimate distributions of (3IE (dbh, a), (32E (crown ratio, b), (33E (basal area of 5 biggest branches, c), (34E (log position, d) of the random and weighted pairing MoE ratio models with average parameter value and 95% confidence intervals shown
(dotted lines)
On the other hand, lumber MoR is inferior to that of mini-clear samples (Figure 2b)
with the average MoR value ratio much lower than 1 (M---cJËClb/ MoR_me = 0.53). The signs of the coefficient estimates are similar to the MoE models, with positive values for DBH, CR and BrD, and negative values only for BrBA and log height.
Differences were observed in covariate selection between pairing methods. LP and CR parameter estimates were non-significant for the random pairing MoE model (p=0.098
(p=0.004 and 0.032, respectively). No differences in the covariate selection were observed
for the MoR models. Furthermore, parameter estimates were not significantly different
between the pairing methods.
2.5 DISCUSSION
The influence of crown metrics and stand density management has been studied on
both lumber products (Zhang et al. 2002, Lei et al. 2005, Beaulieu et al. 2006, Liu et al.
2007a) and mini-clear samples (Auty and Achim 2008, Raymond et al. 2008, Schneider et
al. 2008b, Kuprevicius et al. 2013, Torquato et al. 2013). The relationship between sample
size, crown attributes and stand spacing has however received !ittle attention. The proposed
methods of pairing mini-clear samples to lumber pieces based on resampling techniques
enabled us to better understand the intra- and inter-tree lumber/rnini-clear variation in
mechanical properties. With the resampling technique, parameter value distributions are
built to carry out the inferences. AlI possible permutations were not assessed, as it would
have been too computationally intensive. Nevertheless, parameter distributions were found
to stabilize after 2 500 iterations. The random pairing method is considered as the reference
distribution, since no assumptions were made on the pairing probability. On the other hand,
the weighted probability pairing method was based on the hypothesis that pieces of similar
22
400 -300 -6'200 -c 100-<Il 8640 -~ 300 -LL 200 -100 -0-a
1 1 1 1 1 1 ;:0 \1) ::l Co o 3 ~ cë' :::T ~ 0.003 0.004 0.005 0.006 0.007 0.008 300,.,200-g
100 -~ 0-g 300-Li: 200-100-c
0-. -1.2e-06 300 -,.,200-g
100 -~ 0 -g 300-Li: 200-100 -0-e
~1G(DBH) • • -8.0e-07 -4.0e-07 ~3G(BrBA) • • • O.Oe+OO -0.13 -0.11 -0.09 /3sG(LP _t) ;:0 \1) ::l Co o 3 ~ cë' :::Ten
Co ;:0 \1) ::l Co o 3 ~ cZi" :::T ~ 300 -,.,200-g
100-~ 0 -0"300-J:
200 100 - 0-400 - 300-6'200 -c 100-~ 0-0"400 -~ 300-LL 200-100 -0 - 400-300 -6'200 -c 100-~ 0 -0"400 -~ 300-LL 200 -100 -D -b 1 0.0 d 1 0.000 f I -0.08 ,.II 1 1 1 0.1 0.2 0.3 ~2G(CR) 1 • 0.005 0.010 ~4G(BrD) 1 1 -0.06 -0.04 -0.02 /36G(LP _m) 1 0.4 1 0.00 ;:0 \1) ::l Co o 3 ~ cë' :::T ~ ;:0 \1) ::l Co o 3 ~ cë' ~ Co ;:0 \1) ::l Co ~~
cZi" :::Ten
CoFigure 4. Parameter estimate distributions of
/3JG
(dbh, a),/32G
(crown ratio, b),/33G
(basal area of 5 biggest branches, c),/34G
(branch density, d),/35G
(log position_middle, e),/36G
(log position_top, f) of the random and weighted pairing MoR ratio models with average parameter value and 95% confidence intervals shown (dotted lines)The differences between the pairing methods were observed for the MoE models. CR and log position were found to be non-significant according to the random pairing method, and had p-values lower th an 0.05 for the weighted paring method. This is due to the fact
that the MoE ratio shows larger variations with random pairing method th an for the
weighted pairing method. The differences could also be caused by less stable relationships
between the MoE ratio and the covariates, when compared to the MoR which is more
affected by the presence of internaI defects such as knots and thus more related to crown
and bran ch attributes (Lei et al. 2005, Zhang et al. 2006, Liu et al. 2007 a, Lundstrom et al.
2007).
The measurement of mechanical properties of heterogeneous and anisotropic
materials with internaI defects, su ch as wood, is known to be piece size dependent (Madsen
and Buchanan 1986, Fonselius 1997, Brancheriau et al. 2002). This is consistent with our
results, with the lumber MoE being greater for lumber (model intercepts > 1). Furthermore,
the testing methods to estimate the mechanical properties differ between the mini-clear
(3-point) and lumber (4-point) samples. Indeed, the wood MoE measurement can be 40%
higher in 4-point bending test than in 3-point test (Brancheriau et al. 2002). The shear
strength is also positively correlated to the cross sectional area of piece (Brancheriau and
Bailleres 2002, Kretschmann 2010), leading to higher MoE of lumber when compared to
that of a mini-clear sample.
On the contrary, lumber MoR was found to be lower than the mini-clear MoR (model
intercepts < 1). Since static MoR measurements are destructive, 3-point and 4-point MoR
measurements on the same sample are not possible. Despite this, it is known that materials
strength is related to the weakest point (Madsen and Buchanan 1986, Buchanan 1990). The
size-effect has been widely found through various materials, both homogeneous (e.g. metal,
glass) and heterogeneous (e.g. wood, concrete). As piece size increases, the probability of
including weaker elements (e.g. weak wood fiber or defect) affecting stength increases.
Wood strength and stiffness have been linked with external tree attributes such as tree
24
2009b, Kuprevicius et al. 2013). The use of the lumber to mini-clear mechanical pro pert y ratios yields more detailed information on the effect of such covariates on the wood
properties, as variations in the intrinsic wood properties are accounted for through the
mini-clear samples measurement, whereas lumber pieces are subject to the addition al effect of
the presence of knots and other defects. DBH (Eq. 10 to 13), CR (Eq. 11, 12 and 13) and
branch density (Eq. 12 and 13) had positive parameter estimates.
At a given age, the effect of larger DBH and longer crowns is generally to decrease MoE and MoR values (Amarasekera and Denne 2002, Liu et al. 2007a, Kuprevicius et al. 2013). However, the positive parameter indicated that the ratios of mini-clear to lumber
MoE and MoR increased with DBH, CR and branch density. This is likely attributable to the fact that in our dataset lumber pieces from larger trees typically contained a higher
proportion of mature wood when compared to smaller sized trees.
Furthermore, trees with larger crowns will have more green/sound knots than trees with smaller crowns (Lemieux et al. 2001, Achim et al. 2006, Hein et al. 2007, Benjamin et al. 2009, Duchateau et al. 2013). Thus, the amount of dead/loose knots increases with smaller crowns, which can potentially affect the mechanical properties of a piece of lumber.
The basal area of the five biggest branches (BrBA) is used a surrogate for knot-size, such
that trees with larger branches will have larger knots (Lemieux et al. 2001, Hein et al. 2007,
Benjamin et al. 2009), and thus lower lumber strength and stiffness when compared to
mini-c1ear samples (i.e. negative BrBA parameter estimates).
Surprisingly, bran ch density (BrD) had a positive parameter estimate for both ratio
models, indicating that an increase in overall branch number implies an increase in
lumber/mini-clear MoR ratio. This may be explained by the fact that an increase in branch
density, for a given number of branches would mean that mean branch size would be smaller, and thus the lumber pieces wou Id have smaller knots, 1eading to higher MoR ratios. Finally, both MoE and MoR ratios were generally higher at stem base, probably because
the mature wood volume is more important at this height, a fact that should be reflected in
2.6 Conclusion
This study is a first attempt at scaling the MoE and MoR measurement from
mini-clear samples to lumber pieces. The methodology developed in this study could be useful to
make projections of lumber yields and quality from the early stages of a forest plantation. The results obtained from wood quality studies using mini-clears could be scaled to lumber sized pieces with the scaling relationship. It is also possible to extract from the lumber measurements the intrinsic wood properties, thus enabling us to have a better grasp on how
defects influence the bending mechanics. The results can be helpful for forest managers
interested in limiting the effects of silvicultural treatments on lumber performance.
Further studies could attempt to extract mini-clear samples directly from the lumber
pieces and compare the ratio results to those obtained in this study. This comparison would
remove the need for statistical pairing and wou Id therefore pro vide a more direct
assessment of the relationship between lumber and mini-clear properties.
Acknowledgements
We would like to give our appreciations to previous project teams, Hugues Power,
Adam Kuprevicius and Normand Paradis for sharing valuable datasets. The authors would
also thank NSERC through ForValueNet Strategie Network for providing funding for this
CHAPITRE 3 CONCLUSIONS ET IMPLICATIONS DE L'ÉTUDE
La quantification de la qualité du bois est une information importante à considérer lors de la prise de décisions en aménagement forestier. Deux caractéristiques employées pour évaluer la qualité du bois d'œuvre sont les propriétés de flexion statique, quantifiés
par les modules d'élasticité et de rupture. Ces caractéristiques sont directement liées aux propriétés du produit fini (Kretschmann 2010). La méthodologie proposée dans cette étude permet d'avoir une meilleure idée de l'effet des défauts sur les propriétés mécaniques en éliminant du bois d'œuvre les propriétés intrinsectes du bois. Ceci est réalisé à l'aide du rapport du module du bois d'œuvre et du module de l'éprouvette.
Les principaux résultats de l'étude sont que le MoR et MoE changent avec la taille de l'échantillon, le rapport varie avec le diamètre à hauteur de poitrine, le pourcentage de cime,
le diamètre des 5 branches les plus grosses et la surface basale des branches. L'effet de la dimension de la pièce a déjà été observé (Madsen 1990, Morel and Valentin 1996, Pedersen et al. 2003).
Toutefois, les essaIS en flexion sur le bois d'œuvre (ASTM D-198) et sur les
éprouvettes (ASTM D-143) ont été réalisés selon 2 normes différentes. Brancheriau et al (2002) ont rapporté une sous-estimation de 40% du MoE lors des essais à 3 points (NF 1942) en comparaison aux essais à 4 points (NF 1987). Ces différences peuvent être expliquées par les changements de la force de cisaillement avec la taille de l'échantillon (Chui 1991), car la quantité de cellules et la surface de contact entre celles-ci augmentent avec la taille. Contrairement aux résultats obtenus précédemment, les différences de MoE entre le bois d'œuvre et les éprouvettes sont faibles (POLE
=
1.18 et 1.12, Figure 2). La présence de défauts dans le bois d'œuvre, et l'absence de défauts dans les éprouvettes, peuvent expliquer les résultats obtenus.28
Contrairement au MoE, le MoR du bois d'œuvre est inférieur au MoR des éprouvettes. Bien que l'effet de la configuration de la charge de l'essai en flexion à 3 points aurait dû sous-estimer le MoR du bois d'œuvre (Madsen 1990), la grande différence entre
le MoR du bois d'œuvre peut être attribuée à la présence de défauts dans le bois d'oeuvre. La force en flexion du bois est composée des effets de compression et de tension (Madsen et Buchanan, 1985). Plusieurs études ont rapporté l'effet de la taille d'un échantillon sur le MoR sous différents types de charge (Mad sen 1990, Morel and Valentin 1996, Pedersen et al. 2003). Selon la théorie du maillon le plus faible, le MoR d'un
matériau homogène diminue avec une augmentation de la taille de la pièce pour deux raisons (Madsen and Buchanan 1986) : la probabilité d'avoir une faiblesse augmente avec la dimension, et le MoR est déterminé par le lien le plus faible. Cette théorie s'applique aussi au bois, qui est hétérogène et anisotrope. Dans le bois, le risque d'avoir des défauts augmente avec la taille de la pièce de bois. Ces différences ont d'ailleurs déjà a été
rapportées, où le MoR de bois sans nœud était inférieur au MoR de bois avec nœuds (Madsen, 1989).
Les résultats obtenus dans cette étude ont montré que le MoR et MoE du bois d'œuvre augmentent en comparaison du MoR et MoE des éprouvettes avec le diamètre à
hauteur de poitrine. Le MoR et MoE du bois d'œuvre est aussi plus élevé en comparaison du MoR et MoE des éprouvettes dans la bille du bas. Les arbres échantillonnés de cette étude provenaient d'une plantation, et la difference en âge était très faible. De plus, au contraire du cas des éprouvettes, le nombre de pièces de bois d'œuvre n'est pas
proportionel au diamètre à hauteur de poitrine. Par conséquent, les arbres avec un diamètre à hauteur de poitrine plus grands ont plus de bois mature, tout comme les billes à la base de
l'arbre ont plus de bois mature que celles plus hautes.
Les résultats indiquent aussi que certaines métriques liées à la cime influencent le
rapport des modules d'élasticité et de rupture. Par exemple, les rapports du MoR et du MoE sont inversement proportionnels à la surface basale des 5 plus grosses branches (BrBA). La
indiquent que les nœuds seront plus gros, et par conséquent la probabilité d'avoir un défaut important dans une pièce de bois d'œuvre augmente (Maguire et al. 1991, Moberg 2001).
Contrairement au BrBA, le MoR du bois d'œuvre augmente avec la densité des
branches comparativement au MoR des éprouvettes. Ce résultat pourrait s'expliquer en
partie par une baisse plus imporante du MoR des éprouvettes comparativement au MoR du
bois d'œuvre pour une même densité des branches. Il a été montré qu'une cime plus grosse
a une plus grande production d'auxines, ce qui induit des changements anatomiques des
cellules et donc influence les propriétés mécaniques du bois (Nelson and Hillis 1978,
Wilson and Gartner 2002, Kuprevicius et al. 2013). Le MoR des éprouvettes étant plus
sensibles aux propriétés intrinsectes du bois, la diminution du MoR des éprouvettes pourrait
être plus élevée que la diminution du MoR du bois d'oeuvre. De plus, la densité des
branches influence la mortalité des branches et par conséquent la proportion de branches
vivantes ce qui influence le type de noeud (Duchateau et al. 2013).
Cette étude a permis d'établir avec une plus grande précision l'effet des défauts,
quantifiés par des variables à l'échelle de l'arbre, sur les propriétés mécaniques du bois.
Certaines variables employées ne sont pas facilement accessibles par l'inventaire forestier
actuel. Toutefois, avec le développement de nouvelles technologies dans le milieu forestier,
tel que le LiDAR, il sera plus facile d'obtenir le diamètre des branches, ou leur densité (van
Leeuwen et al. 2011). Les relations proposées deviendront alors pertinentes pour le
gestionnaire forestier.
Les résultats dégagés peuvent toutefois être utiles dès à présent, car les liens entre les
caractéristiques de la cime et le changement des propriétés mécaniques ont été approfondis.
Il est alors possible d'inférer l'effet de traitements sylvicoles sur les propriétés mécaniques,
en sachant les changements de la cime d'un arbre suite à une intervention. Par exemple, il
est bien connu que le diamètre du tronc, la longueur de la cime et la grosseur des branches
sont inversement proportionnelles à la densité du peuplement. Les changements sont aussi
30
Pour avoir une meilleure précion de l'effet des défauts sur les propriétés mécaniques, il serait judicieux d'obtenir des éprouvettes directement du bois d'œuvre, afin de ne pas devoir employer des méthodes de rééchantillonnage. Les résultats de cette étude fournissent toutefois une première réponse à une question complexe. Des études similaires sur d'autres
espèces, et une plus grande variabilité de sites, âge et d'environnement compétitif
RÉFÉRENCES BIBLIOGRAPHIQUES
Achim, A., B. Gardiner, J. Leban, and R. Daquitaine. 2006. Predicting the branching
properties of Sitka spruce grown in Great Britain. New Zealand Journal of Forestry
Science 36:246.
Alcorn, P. J., J. Bauhus, R. G. B. Smith, D. Thomas, R. James, and A. Nicotra. 2008.
Growth response following green crown pruning in plantation-grown Eucalyptus
pilularis and Eucalyptus cloeziana. Canadian Journal of Forest Research 38: 770-781.
Amarasekera, H. S. and M. P. Denne. 2002. Effects of crown size on wood characteristics
of Corsican pine in relation to definitions of juvenile wood, crown formed wood
and core wood. Forestry 75:51-61.
ASTM, 2007 Standard test methods for small c1ear specimens of timber. In Annual Book of
ASTM Standards. ASTM International, Baltimore
Archer, R. R. and B. F. Wilson. 1973. Mechanics of the Compression Wood Response II.
On the Location, Action, and Distribution of Compression Wood Formation. Plant
physiology 51 :777 -782.
Auty, D. and A. Achim. 2008. The relationship between standing tree acoustic assessment
and timber quality in Scots pine and the practical implications for assessing timber
quality from naturally regenerated stands. Forestry 81:475-487.
Barnett, J. R. and V. A. Bonham. 2004. Cellulose microfibril angle in the ceil wall of wood
fibres. Biological Reviews of the Cambridge Philosophical Society 79:461-472.
Barrett, J. D., I. P. Haigh, and J. M. Lovegrove. 1981. Fracture Mechanics and the Design
of Wood Structures. Philosophical Transactions of the Royal Society of London.
Series A, Mathematical and Physical Sciences 299:217-226.
Beaulieu, J., S. Y. Zhang, Q. Yu, and A. Raiville. 2006. Comparison between genetic and
enviromental influences on lumber bending properties in young white spruce. Wood
and Fiber Science 38:553-564.
Benjamin, J. G., J. J. A. Kershaw, A. R. Weiskittel, Y. H. Chui, and S. Y. Zhang. 2009. External knot size and frequency in black spruce trees from an initial spacing trial in
Thunder Bay, Ontario. The Forestry Chronic1e 85:618-624.
Borders, B., R. Will, D. Markewitz, A. Clark, R. Hendrick, R. Teskey, and Y. Zhang. 2004.
Effect of complete competition control and annual fertilization on stem growth and
canopy relations for a chronosequence of loblolly pine plantations in the lower
32
Brancheriau, L. and H. Bailleres. 2002. Natural vibration analysis of clear wooden beams: a
theoretical review. Wood Science and Technology 36:347-365.
Brancheriau, L., H. Bailleres, and D. Guitard. 2002. Comparison between modulus of
elasticity values calculated using 3 and 4 point bending tests on wooden samples.
Wood Science and Technology 36:367-383.
Brüchert, F., G. Becker, and T. Speck. 2000. The mechanics of Norway spruce [Picea abies
(L.) Karst]: mechanical properties of standing trees from different thinning regimes. Forest Ecology and Management 135:45-62.
Buchanan, A. 1990. Bending Strength of Lumber. Journal of Structural Engineering
116:1213-1229.
Burdon, R. D., R. P. Kibblewhite, J. C. F. Walker, R. A. Megraw, R. Evans, and D. J.
Cown. 2004. Juvenile versus mature wood: a new concept, orthogonal to corewood
versus outerwood, with special reference to Pinus radiata and P. taeda. Forest Science 50:399-415.
Chui, Y. H. 1991. Simultaneous evaluation of bending and shear moduli of wood and the
influence ofknots on these parameters. Wood Science and Technology 25:125-134.
Clark, A., R. Daniels, and L. Jordan. 2006. Juvenile/Mature Wood Transition in Loblolly Pine as Defined by Annual Ring Specific Gravit y , Proportion of Latewood, and
Microfibril Angle. Wood and Fiber Science 38:292-299.
Deresse, T., R. K. Shepard, and S. M. Shaler. 2003. Microfibril angle variation in red pine
(Pines resinosa Ait.) and its relation to the strength and stiffness of early juvenile
wood. Forest Products Society, Madison, WI, ETATS-UNIS.
Donaldson, L. 2008. Microfibril angle: Measurement, variation and relationships--A review.
IAWAjournaI29:345.
Downes, G. M., D. Drew, M. Battaglia, and D. Schulze. 2009. Measuring and modelling
stem growth and wood formation: An overview. Dendrochronologia 27: 147 -157.
Duchateau, E., F. Longuetaud, F. Mothe, C. Ung, D. Auty, and A. Achim. 2013. Modelling
knot morphology as a function of external tree and branch attributes. Canadian
Journal of Forest Research 43:266-277.
Dunham, R. A. and A. D. Cameron. 2000. Crown, stem and wood properties of
wind-damaged and undamaged Sitka spruce. Forest Ecology and Management 135:73-81.
Fahlvik, N., P.-M. Eko, and N. Pettersson. 2005. Influence of precommercial thinning
grade on branch diameter and crown ratio in Pinus sylves tris in southern Sweden.
Scandinavian Journal of Forest Research 20:243-25l.
Fonselius, M. 1997. Effect of size on the bending strength of laminated veneer lumber.
Wood Science and Technology 31:399-413.
Hein, S., H. Mtikinen, C. Yue, and U. Kohnle. 2007. Modelling branch characteristics of
Norway spruce from wide spacings in Germany. Forest Ecology and Management
242:155-164.
Houllier, F., J. M. Leban, and F. Colin. 1995. Linking growth modelling to timber quality