Science Arts & Métiers (SAM)
is an open access repository that collects the work of Arts et Métiers Institute of
Technology researchers and makes it freely available over the web where possible.
This is an author-deposited version published in:
https://sam.ensam.eu
Handle ID: .
http://hdl.handle.net/10985/18404
To cite this version :
N. VAROL, Nicolas DELPOUVE, Steven ARAUJO, Sandra DOMENEK, Alain GUINAULT, Roman
GOLOVCHAK, A. INGRAM, Laurent DELBREILH, Eric DARGENT - Amorphous rigidification and
cooperativity drop in semicrystalline plasticized polylactide - Polymer - Vol. 194, p.1-9 - 2020
Any correspondence concerning this service should be sent to the repository
Administrator :
[email protected]
Amorphous rigidification and cooperativity drop in semi crystalline
plasticized polylactide
N. Varol
a, N. Delpouve
a,*, S. Araujo
a, S. Domenek
b, A. Guinault
c, R. Golovchak
d, A. Ingram
e,
L. Delbreilh
a, E. Dargent
aaNormandie Univ, UNIROUEN Normandie, INSA Rouen, CNRS, Groupe de Physique des Mat�eriaux, 76000, Rouen, France bUMR Ing�enierie Proc�ed�es Aliments, AgroParisTech, INRA, Universit�e Paris-Saclay, 1 Avenue des Olympiades, F-91300, Massy, France cLaboratoire PIMM, Ensam, CNRS, Cnam, 151 Boulevard de l’H^opital, 75013, Paris, France
dDepartment of Physics, Engineering and Astronomy, Austin Peay State University, Clarksville, TN, 37044, United States eFaculty of Physics, Opole University of Technology, Opole, PL-45370, Poland
Keywords:
Differential scanning calorimetry Poly (lactic acid)
Glass transition
A B S T R A C T
Plasticization of amorphous polylactide shifts the glass transition and extends its temperature range of crystal-lization to lower temperatures. In this work, we focus on how low temperature crystalcrystal-lization impacts the mobility of the amorphous phase. Plasticizer accumulates in the amorphous phase because it is excluded from the growing crystal. The formation of rigid amorphous fraction is favored by the low crystallization temperature. It reaches values up to 50% in plasticized polylactide. The increase in the content of rigid amorphous fraction coincides with both the increase of free volume quantified by positron annihilation lifetime spectroscopy, and the decrease in the cooperativity length obtained from the temperature fluctuation approach. The drop of cooper-ativity is interpreted in terms of mobility gradient due to the amorphous rigidification.
1. Introduction
The thermal resistance of polylactide (PLA) can be improved by processing semi crystalline polylactide (sc PLA) [1–3], but it often requires adding plasticizer in the formulation to mitigate its brittleness [2–8]. Recent works evaluated capabilities of biodegradable and bio-based molecules as plasticizers [9–15]. These molecules are often compared to citrate esters [16–21], which possess good miscibility with PLA [16–19]. Acetyl tributyl citrate (ATBC) has shown good thermal stability during repeated heating/cooling cycles around the glass tran-sition [21]. Despite the high applicative importance of polymer/diluent systems, reports on the physical consequences of plasticizers on the local microstructure on semicrystalline (sc) polymers are rare.
Plasticization of PLA can be explained by several theories based on physical observations [22]. In previous works on fully amorphous PLAs [21,23–26], we investigated the influence of ATBC on the glass transi-tion dynamics by thermal analysis techniques. Polymer glass formers usually exhibit a deviation from the Arrhenius type temperature dependence of relaxation time, when approaching glass transition on cooling, this deviation being described by fragility index [27]. Its
molecular representation can be provided within cooperative rear-ranging regions (CRR) concept as proposed by Adam and Gibbs [28]. The CRR concept suggests that the relaxation time and the activation energy brutally increase during cooling towards the glass transition because a higher number of structural units must be mobilized to ach-ieve the relaxation process. It was observed [24,25] by modulated temperature differential scanning calorimetry (MT DSC) and dielectric relaxation spectroscopy (DRS) that the ATBC molecules decrease the kinetic fragility index, and that this result coincides with the decrease of the size of CRR [25]. Recently [26], we have shown that the variations of the CRR size in plasticized PLA are consistent with the variations of the free volume obtained experimentally from positron annihilation lifetime spectroscopy (PALS).
Establishing the mechanism of the influence of plasticizer on the amorphous fraction dynamics of sc PLA is challenging due to the interplay existing between the processing conditions, the obtained microstructure, and the resulting properties of the amorphous phase. But these microstructure features have a significant impact on transport [29] and mechanical [30] properties. Therefore, new results regarding these characteristics will be of interest for enlarging the use properties of * Corresponding author.
When PLA undergoes thermal crystallization, the amorphous region is progressively reduced, leading to constrained chains mobility. Due to the incomplete decoupling between the crystalline and amorphous phases, PLA like many polymers is described, by a three phase model, which considers crystalline phase, mobile amorphous fraction (MAF) and rigid amorphous fraction (RAF) [31–35]. The RAF behaves as an interphase with nanometric dimensions [36]. Contrary to MAF, the RAF does not relax at glass transition and devitrifies in a temperature domain between the glass transition and the fusion [37,38]. RAF can be easily formed in the imperfect crystallization conditions [37], and it is detri-mental to PLA barrier properties [39].
In neat PLA, the constraining effect of crystals and RAF on the MAF mobility has been investigated in several studies [40–43]. The increase of the fragility [40,41] and the decrease of cooperativity [42,43] have been reported. Besides, two distinct thermal signatures at the glass transition have been observed for the samples with intermediate crys-tallinity [42–45]. It has been assumed that the low temperature process is the signature of relaxation in the amorphous matrix, which does not undergo geometrical restrictions. On the other hand, the high temper-ature process has been attributed to the signtemper-ature of relaxation in the MAF confined into the spherulites with constrained dynamics. Righetti et al. [46] clearly identified the signatures of both constrained and un-constrained MAFs by MT DSC and dielectric relaxation spectroscopy (DRS) when crystallizing at 85 �C. In contrast, after crystallizing at 145 �C the MAF remains practically unconstrained [46].
In this work we provide new results regarding the respective roles of crystallization and plasticizing molecules on the amorphous phase behavior in PLA. The temperature regime slightly above the glass transition region has been chosen as crystallization conditions to impact the MAF mobility and to promote RAF formation. MT DSC has been used to calculate the content of MAF and RAF in plasticized sc PLA for various crystallization times. The MAF dynamics have been investigated using Cooperative Rearranging Region (CRR) concept. The free volume variations with both plasticization and crystallization have been inves-tigated with temperature dependent PALS.
2. Experimental
2.1. Materials
PLA grade was 4042D with a D content of 4% as provided by NatureWorks®. ATBC (CAS Number 77–90 7) was purchased from Sigma Aldrich® (France) and used as plasticizer. Hildebrand solubility parameters δ are close between both constituents: δ PLA ¼[21.9 (MJ m 3)0.5] and δ ATBC ¼[18.4 (MJ m 3)0.5] [21]. x % ATBC was added to PLA, x being equal to 0 (neat PLA), 2.5, 5, 10 and 15% of PLA initial weight (samples named PLA_x). The procedure for blends processing was similar to those reported in previous studies [24,25]. PLA and ATBC were both dried at 80 �C under vacuum for 12 h, and then blended in the internal mixer (Haake Rheocord 9000®) at 160 �C and 60 rpm for 15 min. The obtained blends were additionally dried for 4 h at 80 �C under vacuum and then thermo molded between two hot plates. Pressure was increased progressively to remove air bubbles: 10 bars for 30 s, 50 bars for 30 s and 150 bars for 1 min. After quenching to room temperature, homogenous amorphous films of about 100 μm thickness were obtained.
The average molecular weight of neat PLA after processing was deter-mined as 90500 g mol 1 (polydispersity index ¼ 2.75) using polystyrene standards for calibration. To induce cold crystallization, the as prepared amorphous samples were heated from the glassy state in the DSC Q100 (TA® instruments) apparatus at 20 �C min 1 rate from 0 �C to T
c ¼Tg þ20 �C, then annealed for different time t
c ranging between
1 and 1000 min.
2.2. Polarized optical microscopy
Optical micrographs of sc PLA were taken using a Nikon Optiphot 2 Polarized Optical Microscope (POM) equipped with the Nikon® Nis Elements D software. The samples were heated in a hot stage Mettler® FP 82 HT reproducing the same thermal cycle than DSC Q100 (TA® instruments) to observe the appearance and growth of spherulites during isothermal crystallization. The pictures were taken for various annealing times at Tg þ20, 110, and 130 �C, i.e., at temperatures be-tween the glass transition and melting point. Pictures are presented in Supporting Information (Fig. S1).
2.3. Positron annihilation lifetime spectroscopy
Temperature dependent PALS was performed to provide the infor-mation regarding the content of free volume available in the material [26]. The instrument was calibrated by measuring Co60 isotope, pure Ni and Au metals, as well as PTFE (Teflon) standards. The spectra were recorded with the fast coincidence system (ORTEC) of 230 ps resolution from 5 to 80 �C (0.007 K min 1 ramp) at relative humidity 35%. Each spectrum contained 8⋅105 coincidences in total. The source of positrons, isotope 22Na (activity ~2 MBq), was sandwiched between two identical samples. The spectra revealed three components from the fitting pro-cedure (performed using standard LT 9.0 program [47]). The fraction of free volume (fv) was quantified from the third component (lifetime τ3,
intensity I3) which was associated with the formation of
ortho positronium (o Ps) [48]:
fvð%Þ ¼ A⋅I3ð%Þ
〈
4 3πR
3
〉
; (1)Where coefficient A ¼ 0.0018 in polymers [48] and R is the radius of pores calculated according to Tao Eldrup model [49,50]:
� 1 τo Ps � TE ¼λTEðRÞ ffi λA � 1 R R þ ΔRþ 1 2πsin � 2πR R þ ΔR � þ0:007 � (2) Where λA¼14λsþ34λt ffi2ns 1is the average weighted annihilation rate of positrons in vacuum; ΔR ¼ 0.1656 nm for spherical like, and ΔR ¼ 0.18 nm for cylindrical like pores [51,52].
2.4. Modulated temperature differential scanning calorimetry
MT DSC analyses were carried out by DSC Q100 (TA® instruments) under 50 mL flow nitrogen atmosphere. The samples of about 10 mg were sealed in hermetic aluminum pans (T Zero, TA® instruments). Prior to any set of experiments, an empty furnace run in the investigated temperature domain was performed. The calibration protocol included the cell resistance and capacitance following the calibration procedure of TA® instruments. The calibration in temperature was done by refer-ring to the melting of standards of benzophenone and indium. Indium was also used for the energy calibration. A sapphire disc was used to ensure a proper calibration in heat capacity. The analyses were per-formed at 2 �C min 1 in heat only conditions (oscillation amplitude of 0.318 �C and period of 60s). These modulation parameters are suitable if one wants to characterize simultaneously the amorphous phase behavior at the glass transition, cold crystallization and the melting. To obtain the signals needed for the cooperativity length calculation, the complete deconvolution procedure was done as proposed by Reading [53]. The phase lag ϕ between the calorimeter response function and the time derivative of the modulated temperature program was corrected as proposed by Weyer et al. [54]. The part of the phase lag ϕht due to the
heat transfer in the sample was corrected using homemade software. The apparent complex heat capacity C* was separated into in phase C0and out of phase C00components determined as C’ ¼ C* cos ϕ
s and C’’ ¼ C*
sin ϕs, where ϕs is the part of the phase lag caused by the relaxation of
2.5. Calculation of the cooperativity length
The characteristic length of cooperativity, i.e., the size of the CRR was calculated according to the temperature fluctuation approach [55]. In the equation proposed by Donth [56], the average length of a CRR at the dynamic glass transition temperature Tα, denoted as ξΤα, is: ξ3
Tα¼
Δð1=CpÞ
ρðδTÞ2kBTα2 (3)
Where δT is the mean temperature fluctuation related to the dynamic glass transition of one CRR [55], kB is the Boltzmann constant, ρ is the
density (ρ ¼1.25 g/cm3 for each sample [21]) and Cp is the heat capacity at constant pressure. δT is equal to the standard deviation in the glass transition domain of C00 Gaussian fit, while T
α corresponds to its
maximum. Alternatively, δT can be obtained from the dC’/dT signal as described in Ref. [57]. The Δ(1/Cp) value, which is equal to (1/Cp)glass -
(1/Cp)liquid at Tα, was obtained from C0signal normalized to MAF
con-tent, which participates only in the relaxation at glass transition [37,38]. The uncertainty on the heat capacity, estimated from reproducibility, is �0.2 J g 1 K 1. According to Pyda et al. [58], the heat capacity of solid PLA is theoretically linked to its group vibrational spectrum and the skeletal vibrations. So the calculation of Cp (vibrational) can be used to check the consistency of experimental data obtained from calorimetric techniques [58]. In the present study, the theoretical heat capacity of PLA plasticized by various amounts of ATBC was not known. Instead, a calculated Cp was proposed, which corresponds to the weighted sum between the recommended experimental heat capacity of PLA given by Pyda et al. [58], and the heat capacity of ATBC that was obtained experimentally from MT DSC (shown in Supporting Information
Fig. S2). Then the C0signal vs. temperature, obtained experimentally, was shifted in order to maximize the coincidence with the calculated Cp. The shift was performed in the temperature domain slightly below the glass transition. The heat capacity value was adjusted but the slope of the glass line remained unchanged.
3. Results and Discussion
3.1. Impact of the annealing on the amorphous fractions characteristics
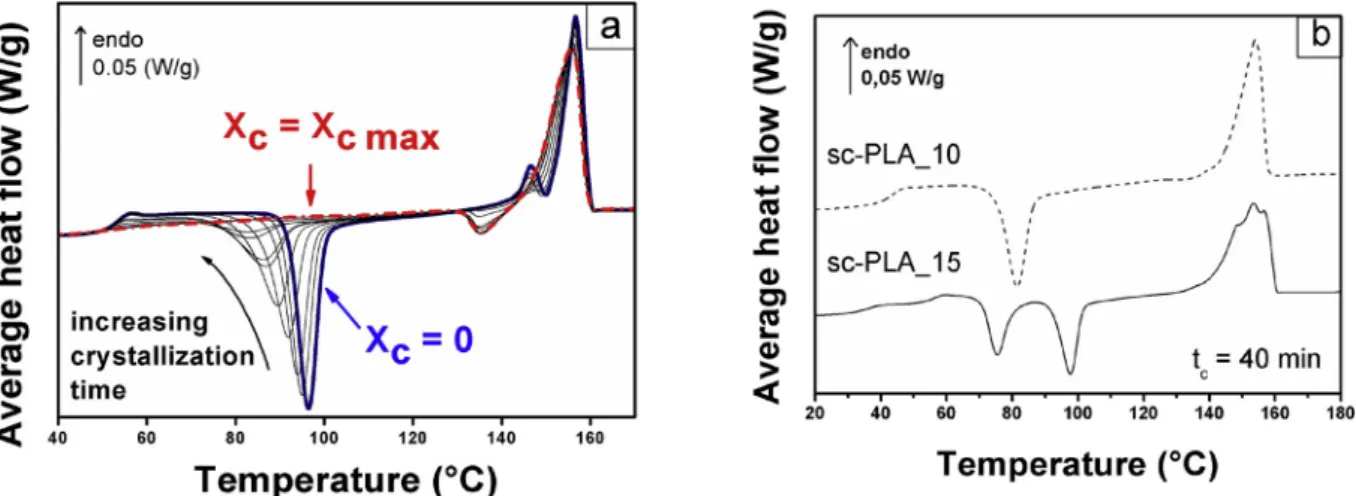
The intrinsic effect of plasticization on the MT DSC response of amorphous PLA was investigated in previous works [21,23–26] and is briefly summarized in Supporting Information (Fig. S3). Fig. 1a shows MT DSC average heat flow curves for amorphous and sc PLA_2.5
samples after the annealing at Tg þ20 �C for t
c ¼1–1000 min. The heat capacity step gradually decreases with tc and seems to disappear for the
longest annealing time. The cold crystallization peak progressively shifts to the lower temperatures and its area decreases. All these variations are explained by the development of a crystalline phase at the expense of the amorphous phase during the annealing. The melting peak also pro-gressively transforms when the annealing time increases. A double peak (see Supporting Information Fig. S3 for details) is recorded for tc <60
min, as highlighted by the solid blue curve. For tc > 60 min the
exothermic signal of the reorganization of α’ to α crystals is detected
before melting [59–62]. This shows, as expected, that the crystallization at Tg þ20 �C induces α’ crystals. For tc >120 min, the exothermic signal is clearly visible and the double peak of melting has totally dis-appeared, meaning that the crystallization is performed in totality during the annealing.
The evolution of the DSC profile with crystallization is sensibly identical for sc PLA_5 and sc PLA_10 but when x increases up to 15%, the used crystallization protocol differently impacts the calorimetric behavior of PLA. In the DSC signal presented in Fig. 1b for sc PLA_15 after annealing for tc ¼40 min at Tc ¼ Tg þ20 �C, one can readily observe the signatures of phase separation, although the degree of crystallinity is less than 10%. Two heat flow steps and two peaks of cold crystallization are recorded and the melting peak becomes more complex, which is the result of multiple contributions. For comparison, the curve corresponding to sc PLA_10 annealed in the same conditions has been added. It does not show the signatures of phase separation.
Most likely, the distribution of plasticizer in the amorphous phase of sc PLA_15 is heterogeneous. It aggregates in some parts of the material whereas other areas seem poorly plasticized, owing to the heat flow step observed in a temperature domain close to the glass transition of neat PLA. Sc PLA_15 has a singular behavior, so the analysis of the impact of annealing on the glass transition has been limited to the PLAs with x equal to 10% or less.
The degree of crystallinity Xc in the sample is calculated from:
XC ¼
ΔHf ΣΔHc
ΔH0
f
(4) Where ΔHc is the enthalpy of cold crystallization and ΔHf is the
enthalpy of melting. Very different theoretical values for the enthalpy of melting ΔHfo of 100% crystalline PLA can be found in the literature [63].
Within the present experimental conditions, where crystalline reorga-nization and melting are related, the value of 93 J/g proposed by Fischer et al. [64] previously shows consistency with X Ray analyses [39]. The
Fig. 1. a Average heat flow vs. temperature for PLA_2.5 samples with different degree of crystallinity Xc. The solid blue curve corresponds to Xc ¼0, while the dash dotted red curve corresponds to Xc ¼Xc max. Fig. 1b: Average heat flow vs. temperature for sc PLA_15 (solid curve) and sc PLA_10 (dashed curve) annealed for tc ¼ 40 min. The curves have been shifted for the sake of clarity. (For interpretation of the references to colour in this figure legend, the reader is referred to the Web version of this article.)
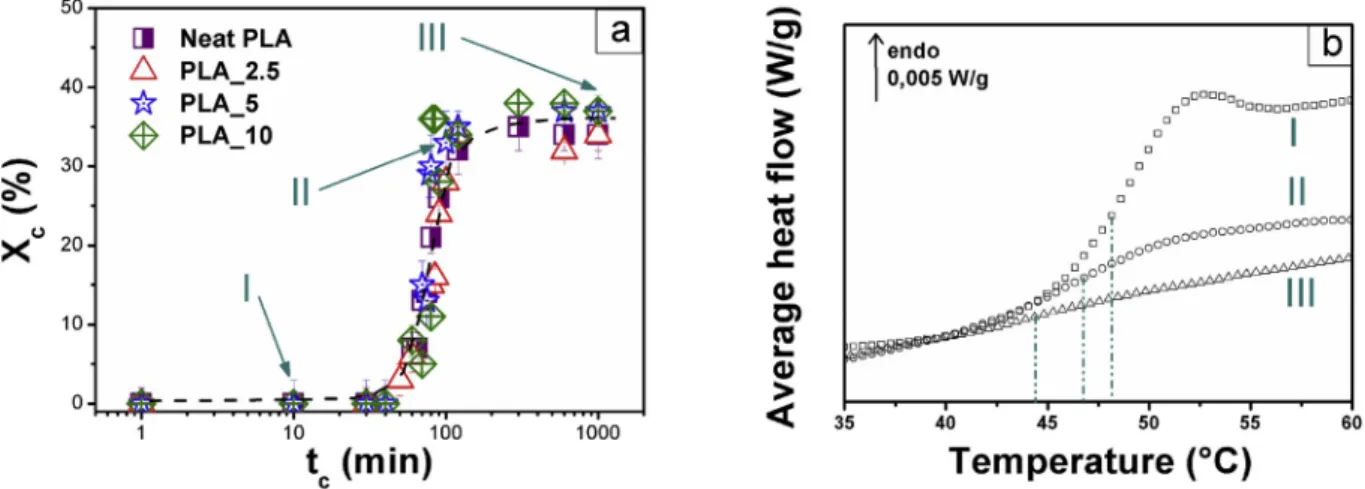
dependence of Xc on tc is a sigmoid (Fig. 2a), showing maximum value Xc max close to 35 � 3% for all samples. Crystallization of α0phase takes
place for tc >60 min. The glass transition signature changes in a similar
way with tc for every plasticized sample (Fig. 2b): the glass transition
midpoint shifts towards lower temperature, the average heat flow step progressively decreases and the temperature fluctuation increases. For sc PLA_5 and sc PLA_10, a high tc value makes the glass transition
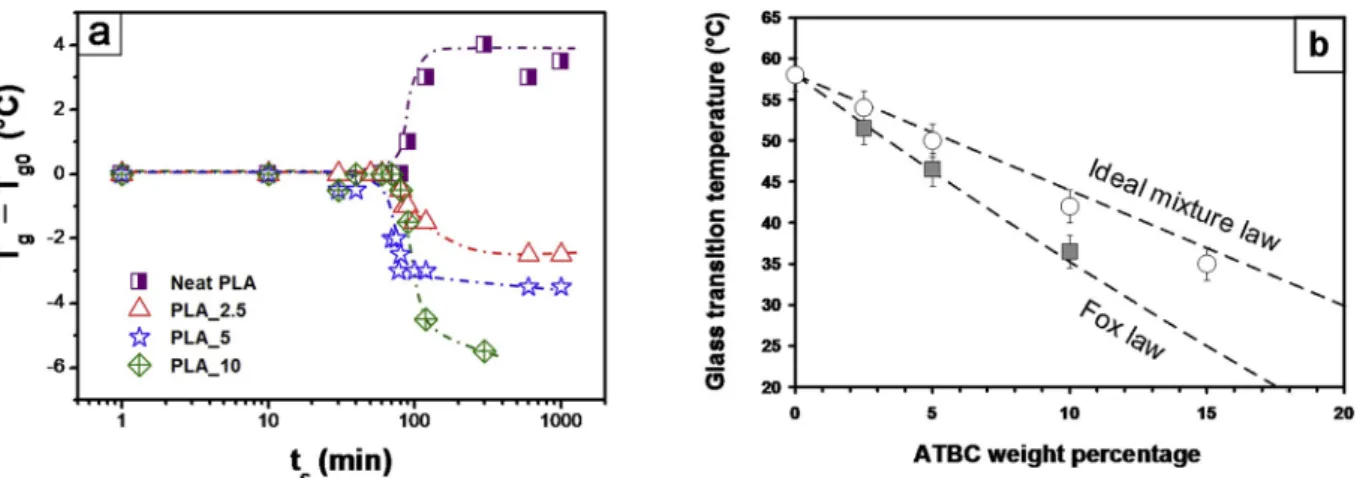
almost indiscernible. The decrease in heat flow step of glass transition with crystallization as well as broadening of glass transition interval are common phenomena, while a decrease in the glass transition tempera-ture is unusual and should be attributed to the presence of plasticizer, as shown in Fig. 3a. Neat sc PLA exhibits an increase of Tg when increasing
tc, whereas plasticized sc PLAs show the opposite tendency.
Appar-ently, plasticizer segregation occurs because ATBC molecules are expulsed out of the developing crystalline phase [4], which increases the concentration of plasticizer in the amorphous phase and therefore de-creases Tg.
Fig. 3b shows the evolution of the glass transition temperature with the ATBC weight percentage in sc PLA annealed for tc ¼1000 min in comparison with amorphous PLA. One can observe that data obtained for sc PLA diverge from the ideal mixture law, which correctly de-scribes the behavior of amorphous plasticized PLA. Instead, the decrease in the glass transition temperature caused by plasticization is observed and the data follow Fox law. Using these two model curves, the ATBC content in the amorphous phase of sc PLA was estimated by projecting
Tg values for sc PLA on the ideal mixture line. For example, Tg ¼35 �C in amorphous PLA_15 and sc PLA_10. The plasticizer concentration in sc PLA_10 is thus most probably equal to the one in amorphous PLA_15. The behavior of the amorphous phase of the maximum crystallized PLAs is investigated in Fig. 4a, where the average heat flow is presented as a function of temperature for neat and plasticized sc PLAs crystal-lized for tc ¼1000 min. One can distinguish two endothermic events, highlighted by dark yellow arrows and dashed lines, which precede the exothermic peak associated with the reorganization of α’ in
α crystals. All thermal events shift towards lower temperatures with the
increase of x.
The low temperature endothermic event corresponds to the glass transition. Although all samples exhibit the same degree of crystallinity:
Xc ¼Xc max ¼35%, the step of the glass transition decreases with the increase of x. It is possible to calculate the degree of mobile amorphous fraction as XMAF ¼ΔCp/ΔCp�, where ΔCp�is the heat capacity step for 100% amorphous sample (see Table S1 of Supporting Information for the values of XMAF). The RAF content XRAF, which is presented in Fig. 4b
as a function of Xc, is estimated from XRAF ¼100% - (XMAF þXc) relation.
XRAF increases from 0 to 20% independently on x when Xc goes from Xc
¼0 to Xc ¼Xc max. However, when Xc is set to Xc max, the further prolong annealing induces a faster increase of XRAF in plasticized PLA, e.g. up to
50% in sc PLA_10 for the duration of tc ¼1000 min, whereas XRAF does not exceed 20% in neat PLA. Picciochi et al. [65] initially reported for a constant dimension of amorphous phase in PLLA measured by SAXS that an increase in RAF dimension at the expense of the MAF dimension leads to an increase in the glass transition width, which is consistent with our observations.
The degree of RAF development depends on chain mobility, i.e. the lower the mobility, the higher the probability that RAF develops in parallel with the crystal growth [37]. If assumed that plasticizer in-creases chain mobility, the increase of XRAF with x seems
counterintui-tive. However, when x increases, Tg decreases towards the ambient
temperature. Therefore, Tc ¼Tg þ20 �C decreases to the temperatures unusually low for PLA crystallization (65 �C for PLA_10, for example), down to the glass transition domain of neat PLA. With the decrease of crystallization temperature, the growth of RAF at the expense of MAF is apparently favored.
Since XRAF reaches high values in sc PLAs, and more particularly in
plasticized sc PLAs, it is interesting to investigate whether a calori-metric signature of the RAF devitrification could be observed in these systems. In past studies, several authors [66–68] have followed the temperature dependence of the RAF using three phase model by plotting two baselines for the solid and the liquid heat capacity. Alternatively, RAF devitrification has been determined by a comparison between the measured Cp above the glass transition, and the expected Cp calculated using the known liquid and solid lines [69]. More rarely a direct calo-rimetric signature of RAF has been identified, as reported by Martin et al. [70] in Poly(3 hexylthiophene), and Beckingham et al. [71] in Poly(3 (20 ethyl)hexylthiophene).
As previously mentioned, one can observe a second endothermic thermal event in Fig. 4a, about 30 �C above the glass transition. This could be the signature of the melting of very small defective crystals formed during the annealing, exhibiting smaller stability when formed at lower Tc, but one may as well attribute this event to the RAF
devit-rification. In PLA different approaches have been proposed to follow the evolution of the RAF by MT DSC, from isothermal and non isothermal crystallization conditions [72], but none has referred to this event. However, in several studies regarding oriented PLA [73,74], it has been suggested that the organization of RAF could lead to mesophase, which is observable from calorimetric techniques. Although the macromole-cules are not oriented in the sc PLAs studied there, the endothermic thermal event might be the signature of a fraction exhibiting interme-diate degree of ordering between RAF and mesophase.
As shown in Fig. 5a, where the heat capacity of sc PLA_5 at Xc ¼Xc
Fig. 2. a Degree of crystallinity Xc versus crystallization time tc in neat and plasticized PLAs. The arrows, which correspond to tc ¼10 (I), 80 (II) and 1000 min (III), respectively characterize the amorphous state (Xc ¼0), the increase of Xc up to Xc max, and the plateau (Xc ¼Xc max ¼35%). Fig. 2b: DSC average heat flow curves focused on the glass transition area of sc PLA_5 crystallized during 10 min, 80 min and 1000 min at Tc ¼Tg þ20 ¼ 70 �C.
max is presented for various tc, the endotherm grows with tc. According to
Ma et al. [75], the regions of RAF devitrify by layers at different tem-peratures depending on their distance to the crystal, i.e., the farther the
layer, the lower the temperature of devitrification. When RAF expands, the temperature range for subsequent devitrification broadens, in consistence with our results. In the study of Beckingham et al. [71], RAF
Fig. 3. a Variation of the glass transition temperature as a function of crystallization time for neat and plasticized PLAs. The dash dotted lines are guides for the eyes.
Fig. 3b: Glass transition temperature of neat and plasticized PLAs for Xc ¼0 (empty circles) and Xc ¼Xc max (filled squares). The dashed lines correspond to the ideal mixture (Tg ¼w PLA*Tg neat PLA þw ATBC*Tg ATBC) and Fox (1/Tg ¼w PLA/Tg neat PLA þw ATBC/Tg ATBC) laws with w being the weight fraction of the constituent.
Fig. 4. a Average heat flow of neat and plasticized sc PLAs crystallized for tc ¼1000 min. The curves have been shifted for the sake of clarity. The dark yellow arrows and dashed lines have been added to highlight the endothermic events recorded in this temperature range. Fig. 4b: RAF content XRAF as a function of the degree of crystallinity Xc. (For interpretation of the references to colour in this figure legend, the reader is referred to the Web version of this article.)
Fig. 5. a Heat capacity of sc PLA_5 for tc ¼120, 600, and 1000 min. Fig. 5b: Reversing and non reversing heat flow in sc PLA_5 for tc ¼1000 min. In both figures, the curves have been shifted for the sake of clarity.
is revealed consistently about 20 �C above the glass transition temper-ature by an endothermic peak in the non reversing heat flow, and a step increase in the reversing heat flow. Reversing and non reversing heat flows of sc PLA_5 crystallized for tc ¼1000 min are presented in Fig. 5b. An endothermic peak is identified 30 �C above the glass transition temperature in the non reversing heat flow signal. However, instead of a clear step, a continuous increase of the reversing heat flow is super-imposed on the endothermic peak in the non reversing heat flow. Further investigations are required to elucidate whether or not the thermal event recorded slightly above Tg is characteristic of RAF
devitrification.
3.2. Free volume and glass transition cooperative dynamics
An appealing explanation for the decrease of Tg in plasticized
sc PLAs is based on a vicious increase of free volume induced by plasticizer segregation. Fig. 6 shows PALS results as a function of tem-perature that have been obtained during glass transition and cold crystallization of initially amorphous PLAs [26]. In the glassy state, fv is
nearly constant and increases from 1.6 for neat PLA to 1.8% for PLA_10. An increase of fv characteristic of the glass transition is recorded, which
is likely to be caused by an increase in the interchain space as the seg-ments easily move away from each other in the liquid [26]. When cold crystallization starts, another increase of fv is recorded, being
significantly steeper than during the glass transition. This may look counterintuitive as one would expect crystallization to induce densifi-cation of the material, but this may be compensated by the increase in chain mobility with temperature and by the plasticizer segregation. As shown previously, the cold crystallization at low temperature is bene-ficial for the RAF development, which is, consequently, more efficient when increasing the plasticizer content. According to Lin et al. [76], the vitrification of RAF creates an additional excess hole free volume as it occurs at high temperature. Thus, as shown by Del Rio et al. [34], RAF is dedensified in PLA. This is related to the formation of a high number of new holes of smaller free volume during crystallization [34,72]. One may attribute the increase of fv, being the most spectacular in
sc PLA_10, to the ability of the amorphous phase to accommodate plasticizer. Because of the phase separation occurring in sc PLA_15, the PALS results regarding this material are presented separately in Sup-porting Information (Fig. S4). Nevertheless, fv variations do not
singu-larize in comparison to other plasticized sc PLAs. As expected, fv is the
highest in the glassy state in sc PLA_15, close to 1.9%, and its increase during both glass transition and cold crystallization is the most spectacular.
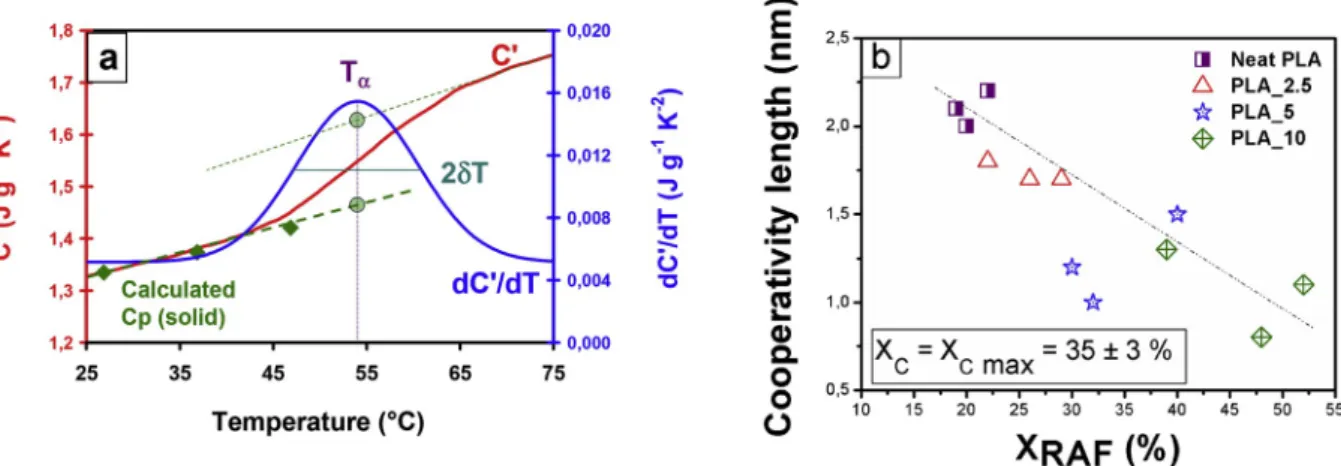
To estimate the combined influence of crystallization and plastici-zation on MAF dynamics, the CRR concept has been applied to sc PLAs. The temperature fluctuation approach has been recently used to describe the behavior of blends [77,78], providing information regarding the structural heterogeneity. The calculation procedure is presented in Fig. 7a. Tα and δT are obtained from the Gaussian fit of
dC’/dT, and the calculated Cp results from a weighted sum between recommended Cp values for PLA by Pyda et al. [58], and recorded Cp values of ATBC, as explained in the Experimental part. It should be noted that after shifting C’ vs. temperature curve is well aligned with the calculated Cp.
According to Fig. 7b, the cooperativity length ξΤα in neat PLA is close
to 2.0 nm for Xc ¼ Xc max. This represents a significant decrease in comparison to the value of 3.8 nm obtained for amorphous neat PLA (see
Fig. S3 of the Supporting Information). Many authors observed changes in the glass transition dynamics of semi crystalline polymers, from which a decrease in the average size of the CRR can be deduced [42,
79–81]. However when it comes to explain these variations, there is no consensus yet among the authors to distinguish between the effect of confinement by crystals, and the effect of interfacial interactions be-tween both crystalline and amorphous phases. Schick and Donth [79] proposed that the level of disturbance in the amorphous phase dynamics should be correlated to the distance between amorphous segments and rigid walls. Delpouve et al. [42] found a similar correlation between the dimension of the mobile amorphous fraction in PLLA and the size on the CRR. They also reported that MAF dimensions are significantly higher than the characteristic length of the CRR [42], suggesting that the geometrical confinement is not the only cause for the decrease of the CRR size. Nassar et al. [82] showed that crystallization of PLLA confined against polystyrene did not induce any variation in the cooperativity length when no RAF was formed, evidencing that the coupling between amorphous and crystal plays a major role in the cooperativity variations. For this reason, the cooperativity length values for plasticized sc PLAs with Xc ¼Xc max are presented in Fig. 7b as a function of XRAF. As expected, ξΤα decreases with x since plasticized sc PLAs undergo
both effects of crystallization and plasticization. However, it is also shown that ξΤα decreases quasi linearly with XRAF. To explain this result,
several hypotheses can be proposed. 1) RAF devitrifies above the glass transition, so it behaves as walls for the MAF. As a consequence, the relaxation process occurs in a confined environment. 2) RAF and MAF are not perfectly distinct in terms of molecular mobility, and a contin-uum of mobility exists through the whole amorphous phase [83]. This broadens the distribution of the relaxation temperature associated with the glass transition. As a result, the cooperativity decreases. 3) The decrease of ξΤα with XRAF can be correlated with the strong increase of fv
during crystallization. It has been shown that ξΤα is correlated to fv in
plasticized PLA [26]. This assumption implies that the plasticizer mi-grates to the MAF, resulting in the breaking of interchain bonds. 4) Fluctuations of plasticizer concentration [84] may exist into the amor-phous phase. Roland and Ngai [85] postulated that the cooperative motions are dependent on the nature of the relaxing species as well as the local environment, which varies with concentration fluctuations. Therefore, the calorimetric signature of the glass transition could be considered as an assembly of domains exhibiting their own relaxation processes [86], growing with the concentration fluctuation.
According to Fig. 3b, Tg of sc PLA_10, which is the most plasticized
sc PLA, is equal to Tg of PLA_15. We assume that the concentration of
ATBC is equal in the MAF of these two systems. In a previous work [26], we concluded from dielectric relaxation spectroscopy measurements that there are no concentration fluctuations for these low concentrations of ATBC. Furthermore, the cooperativity length of PLA_15, calculated by using our MT DSC protocol is about 2.0 nm (experimental data are given in Supporting Information Fig. S3), which is significantly above
Fig. 6. Free volume as a function of temperature in initially amorphous neat
and plasticized PLAs assessed from PALS. Solid lines indicate the slopes of the free volume vs. temperature variations in the glass, the glass transition, and the cold crystallization temperature domains. These domains are delimited by dashed lines for clarity.
the value recorded for sc PLA_10, i.e., close to 1.0 nm. Therefore one cannot fully attribute the decrease of the CRR to the plasticizer segregation.
The assumption of a confinement effect induced by the crystalline phase seems not satisfying either. Indeed, in the study of Nassar et al. [82], the effects of crystallization and coupling have been separated. It has been shown that the crystallization does not systematically impact the cooperativity, whereas the rigidification of the amorphous phase strongly decreases ξΤα. To explain this result, we refer to a previous work
[83] where it has been shown that MAF and RAF are not necessarily behaving as two distinct fractions, forming instead a continuum of mobility with highly heterogeneous dynamics.
The variations of free volume with temperature which are presented in Fig. 6 seem consistent with the assumption fv increases with XRAF, so
the progressive rigidification of the amorphous phase should translate in the material structure by heterogeneities in free volume. Thus, it is worth investigating whether the plasticizer accommodation is also heterogeneous, meaning that the amorphous rigidification forces con-centration fluctuations. It is expected that such fluctuations will enlarge the glass transition signature, thus decreasing the cooperativity length at constant XRAF. However the results (Fig. 7b) do not validate this
assumption, even if the amount of data might not be sufficient to defi-nitely exclude it. Therefore we interpret the cooperativity drop as the signature of structural heterogeneity, essentially associated with the increase of XRAF.
The development of a continuum of mobility under annealing is an assumption that satisfactory depicts the MAF relaxation. It is consistent with the progressive disappearance of the glass transition as the dy-namics become more and more localized until MAF and RAF could not be discerned anymore. On the other hand, the second calorimetric signature detected 30 �C above the glass transition (Fig. 5a) should be attributed to a domain which is more constrained in terms of mobility. Separated glass transitions can be explained by the existence of segre-gated domains as evidenced in poly (alkyl methacrylates), for which self assembled pendant group response is distinct from the main chain dynamics [87,88]. In the present study, it seems logical to attribute this signature to the domain adjacent to crystals. This domain might be in contact with the continuum of mobility. Alternatively its strongly con-strained dynamics could reflect that it is totally trapped between crys-talline lamellae.
4. Conclusion
The amorphous phase characteristics of plasticized sc PLA
investigated through the three phase model, the cooperativity concept, and the quantification of free volume exhibit significant changes in comparison to neat sc PLA. Our results show that the glass transition temperature of plasticized PLA decreases with crystallization, as the probable consequence of the enrichment of amorphous phase by plas-ticizer expulsed out of the crystalline phase. Besides, a complex interplay between parameters describing both amorphous phase structure and dynamics has been evidenced. Although our results suggest that the segregation of plasticizer locally increases the free volume, the varia-tions are not sufficient to explain the cooperativity drop recorded for the highest annealing times. Moreover, no evidence of concentration fluc-tuation has been found. Instead, we found that the cooperativity length relates to XRAF for Xc ¼Xc max. The nature of the RAF is also contro-versial. The calorimetric signature observed significantly above the glass transition, if associated with the RAF devitrification, could prove the RAF behaves as rigid walls for the MAF. However the decrease of the cooperativity length is better explained by considering a structure and dynamics continuum, meaning that the RAF might be a continuation of the MAF, simply extending the distribution of relaxation temperatures. These results, seemingly contradictory, could actually reveal that the RAF which is immobilized by the crystals differs from the RAF which results from the redistribution of relaxation temperatures in the amor-phous phase when Xc max is reached. This redistribution has for
conse-quence that the amorphous state shows high dependence on the annealing time, so a strong control of processing conditions may significantly influence the macroscopic properties.
Declaration of competing interest
The authors declare that they have no known competing financial interests or personal relationships that could have appeared to influence the work reported in this paper.
CRediT authorship contribution statement
N. Varol: Investigation. N. Delpouve: Writing - original draft,
Writing - review & editing, Conceptualization, Methodology, Validation.
S. Araujo: Formal analysis. S. Domenek: Supervision. A. Guinault:
Investigation. R. Golovchak: Investigation, Formal analysis, Supervi-sion. A. Ingram: Investigation. L. Delbreilh: Validation, Methodology, Supervision. E. Dargent: Project administration, Conceptualization, Supervision.
Fig. 7. a Protocol for CRR calculation using the temperature fluctuation approach. The experimental curves have been obtained by MT DSC analysis of sc PLA_2.5
crystallized for 1000 min. C0, appearing as a step, is the in phase component of the complex heat capacity, and dC’/dT, its derivative versus temperature. T
α is the
maximum of the dC’/dT peak, while δT is its standard deviation. Calculated Cp (solid) corresponds to the weighted sum between Cp values of PLA [58], and Cp of ATBC determined by DSC. C0curve is vertically shifted to align with calculated Cp. Fig. 7b: Cooperativity length variations as a function of the content of RAF in neat
Acknowledegements
RG acknowledges U.S. National Science Foundation (Grant No. DMR-1725188) for the acquisition of PAL spectrometer.
References
[1] L. Suryanegara, A.N. Nakagaito, H. Yano, The effect of crystallization of PLA on the thermal and mechanical properties of microfibrillated cellulose–reinforced PLA composites, Compos. Sci. Technol. 69 (2009) 1187–1192, https://doi.org/ 10.1016/j.compscitech.2009.02.022.
[2] H. Li, M.A. Huneault, Effect of nucleation and plasticization on the crystallization of poly(lactic acid), Polymer 48 (2007) 6855–6866, https://doi.org/10.1016/j. polymer.2007.09.020.
[3] X. Shi, G. Zhang, T.V. Phuong, A. Lazzeri, Synergistic effects of nucleating agents and plasticizers on the crystallization Behavior of poly(lactic acid), Molecules 20 (2015) 1579–1593, https://doi.org/10.3390/molecules20011579.
[4] E. Piorkowska, Z. Kulinski, A. Galeski, R. Masirek, Plasticization of semicrystalline poly(L-lactide) with poly(propylene glycol), Polymer 47 (2006) 7178–7188,
https://doi.org/10.1016/j.polymer.2006.03.115.
[5] O. Martin, L. Av�erous, Poly (lactic acid): plasticization and properties of biodegradable multiphase systems, Polymer 42 (2001) 6209–6219, https://doi. org/10.1016/S0032-3861(01)00086-6.
[6] M.P. Arrieta, M.D. Samper, J. L�opez, A. Jimenez, Combined effect of poly (hydroxybutyrate) and plasticizers on polylactic acid properties for film intended for food packaging, J. Polym. Environ. 22 (2014) 460–470, https://doi.org/ 10.1007/s10924-014-0654-y.
[7] S. Jacobsen, H.G. Fritz, Plasticizing polylactide—the effect of different plasticizers on the mechanical properties, Polym. Eng. Sci. 39 (1999) 1303–1310, https://doi. org/10.1002/pen.11517.
[8] M. Baiardo, G. Frisoni, M. Scandola, M. Rimelen, D. Lips, K. Ruffieux, E. Wintermantel, Thermal and mechanical properties of plasticized poly(L–lactic acid), J. Appl. Polym. Sci. 90 (2003) 1731–1738, https://doi.org/10.1002/ app.12549.
[9] A. Ruellan, A. Guinault, C. Sollogoub, V. Ducruet, S. Domenek, Solubility factors as screening tools of biodegradable toughening agents of polylactide, J. Appl. Polym. Sci. 132 (2015) 42476, https://doi.org/10.1002/app.42476.
[10] R.N. Darie–Nita, C. Vasile, A. Irimia, R. Lipsa, M. Rapa, Evaluation of some eco- friendly plasticizers for PLA films processing, J. Appl. Polym. Sci. 133 (2016) 43223, https://doi.org/10.1002/app.43223.
[11] D.A. D’Amico, M.L. Iglesias Montes, L.B. Manfredi, V.P. Cyras, Fully bio–based and biodegradable polylactic acid/poly(3-hydroxybutirate) blends: use of a common plasticizer as performance improvement strategy, Polym. Test. 49 (2016) 22–28,
https://doi.org/10.1016/j.polymertesting.2015.11.004.
[12] B.W. Chieng, N.A. Ibrahim, Y.Y. Then, Y.Y. Loo, Epoxidized vegetable oils plasticized poly(lactic acid) biocomposites: mechanical, thermal and morphology properties, Molecules 19 (2014) 16024–16038, https://doi.org/10.3390/ molecules191016024.
[13] B. Brüster, Y.-O. Adjoua, R. Dieden, P. Grysan, C.E. Federico, V. Berth�e, F. Addiego, Plasticization of polylactide with myrcene and limonene as bio-based plasticizers: conventional vs. reactive extrusion, Polymers 11 (2019) 1363, https://doi.org/ 10.3390/polym11081363.
[14] X. Yang, M. Hakkarainen, Migration resistant glucose esters as bioplasticizers for polylactide, J. Appl. Polym. Sci. 132 (2015) 41928, https://doi.org/10.1002/ app.41928.
[15] J.M. Ferri, D. Garcia-Garcia, N. Montanes, O. Fenollar, R. Balart, The effect of maleinized linseed oil as biobased plasticizer in poly(lactic acid)-based formulations, Polym. Int. 66 (2017) 882–891, https://doi.org/10.1002/pi.5329. [16] L.V. Labrecque, R.A. Kumar, V. Dave, R.A. Gross, S.C. McCarthy, Citrate esters as
plasticizers for poly(lactic acid), J. Appl. Polym. Sci. 66 (1997) 1507–1513,
https://doi.org/10.1002/(SICI)1097-4628(19971121)66:8<1507::AID- APP11>3.0.CO;2-0.
[17] Y. Lemmouchi, M. Murariu, A.M. Dos Santos, A.J. Amass, E. Schacht, P. Dubois, Plasticization of poly(lactide) with blends of tributyl citrate and low molecular weight poly(D,L–lactide) –b–poly(ethylene glycol) copolymers, Eur. Polym. J. 45 (2009) 2839–2848, https://doi.org/10.1016/j.eurpolymj.2009.07.006. [18] N. Ljungberg, B. Wesslen, The effects of plasticizers on the dynamic mechanical
and thermal properties of poly(lactic acid), J. Appl. Polym. Sci. 86 (2002) 1227–1234, https://doi.org/10.1002/app.11077.
[19] I. Harte, C. Birkinshaw, E. Jones, J. Kennedy, E. DeBarra, The effect of citrate ester plasticizers on the thermal and mechanical properties of poly(DL–lactide), J. Appl. Polym. Sci. 127 (2013) 1997–2003, https://doi.org/10.1002/app.37600. [20] S. Singh, M.L. Maspoch, K. Oksman, Crystallization of triethyl-citrate-plasticized
poly(lactic acid) induced by chitin nanocrystals, J. Appl. Polym. Sci. 136 (2019) 47936, https://doi.org/10.1002/app.47936.
[21] L. Dobircau, N. Delpouve, R. Herbinet, S. Domenek, L. Le Pluart, L. Delbreilh, V. Ducruet, E. Dargent, Molecular mobility and physical ageing of plasticized poly
(lactide), Polym. Eng. Sci. 55 (2015) 858–865, https://doi.org/10.1002/ pen.23952.
[22] A. Ruellan, V. Ducruet, S. Domenek, Plasticization of polylactide, RSC polymer chemistry series, in: A. Jim�enez, M. Peltzer, R. Ruseckaite (Eds.), Poly(lactic Acid) Science and Technology : Processing, Properties, Additives and Applications, vol. 12RSC Publishing, 2014, pp. 124–170, https://doi.org/10.1039/9781782624806. Chap. 5.
[23] X. Monnier, N. Delpouve, N. Basson, A. Guinault, S. Domenek, A. Saiter, P. E. Mallon, E. Dargent, Molecular dynamics in electrospun amorphous plasticized polylactide fibers, Polymer 73 (2015) 68–78, https://doi.org/10.1016/j. polymer.2015.07.047.
[24] N. Delpouve, S. Araujo, S. Domenek, A. Guinault, L. Delbreilh, E. Dargent, Relaxation dynamics in plasticized polylactide, in: AIP Conference Proceedings 1981, 2018, 020055, https://doi.org/10.1063/1.5045917.
[25] S. Araujo, N. Delpouve, A. Dhotel, S. Domenek, A. Guinault, L. Delbreilh, E. Dargent, Reducing the gap between the activation energy measured in the liquid and the glassy states by adding a plasticizer to polylactide, ACS Omega 3 (2018) 17092–17099, https://doi.org/10.1021/acsomega.8b02474.
[26] S. Araujo, N. Delpouve, S. Domenek, A. Guinault, R. Golovchak, R. Szatanik, A. Ingram, C. Fauchard, L. Delbreilh, E. Dargent, Cooperativity scaling and free volume in plasticized polylactide, Macromolecules 52 (2019) 6107–6115, https:// doi.org/10.1021/acs.macromol.9b00464.
[27] C.A. Angell, Spectroscopy simulation and scattering, and the medium range order problem in glass, J. Non-Cryst. Solids 73 (1985) 1–17, https://doi.org/10.1016/ 0022-3093(85)90334-5.
[28] G. Adam, J.H. Gibbs, On the temperature dependence of cooperative relaxation properties in glass–forming liquids, J. Chem. Phys. 43 (2004) 139–146, https://doi. org/10.1063/1.1696442.
[29] A. Sangroniz, A. Chaos, M. Iriarte, J. del Río, J.-R. Sarasua, A. Etxeberria, Influence of the rigid amorphous fraction and crystallinity on polylactide transport properties, Macromolecules 51 (2018) 3923–3931, https://doi.org/10.1021/acs. macromol.8b00833.
[30] X.-R. Gao, Y. Li, H.-D. Huang, J.-Z. Xu, L. Xu, X. Ji, G.-J. Zhong, Z.-M. Li, Extensional stress-induced orientation and crystallization can regulate the balance of toughness and stiffness of polylactide films: interplay of oriented amorphous chains and crystallites, Macromolecules 52 (2019) 5278–5288, https://doi.org/ 10.1021/acs.macromol.9b00932.
[31] B. Wunderlich, Reversible crystallization and the rigid–amorphous phase in semicrystalline macromolecules, Prog. Polym. Sci. 28 (2003) 383–450, https://doi. org/10.1016/S0079-6700(02)00085-0.
[32] S. Iannace, L. Nicolais, Isothermal crystallization and chain mobility of poly (L–lactide), J. Appl. Polym. Sci. 64 (1997) 911–919, https://doi.org/10.1002/ (SICI)1097-4628(19970502)64:5<911::AID-APP11>3.0.CO;2-W.
[33] Y. Wang, S.S. Funari, J.F. Mano, Influence of semicrystalline morphology on the glass transition of poly(L–lactic acid), Macromol. Chem. Phys. 207 (2006) 1262–1271, https://doi.org/10.1002/macp.200600114.
[34] J. del Rio, A. Etxeberria, N. Lopez–Rodriguez, E. Lizundia, J.-R. Sarasua, A PALS contribution to the supramolecular structure of poly(l–lactide), Macromolecules 43 (2010) 4698–4707, https://doi.org/10.1021/ma902247y.
[35] M.L. Di Lorenzo, M. Cocca, M. Malinconico, Crystal polymorphism of poly(L–lactic acid) and its influence on thermal properties, Thermochim. Acta 522 (2011) 110–117, https://doi.org/10.1016/j.tca.2010.12.027.
[36] B. Wunderlich, Effect of decoupling of molecular segments, microscopic stress- transfer and confinement of the nanophases in semicrystalline polymers, Macromol. Rapid Commun. 26 (2005) 1521–1531, https://doi.org/10.1002/ marc.200500488.
[37] M.C. Righetti, E. Tombari, Crystalline, mobile amorphous and rigid amorphous fractions in poly(L-lactic acid) by TMDSC, Thermochim. Acta 522 (2011) 118–127,
https://doi.org/10.1016/j.tca.2010.12.024.
[38] A. Magon, M. Pyda, Study of crystalline and amorphous phases of biodegradable poly(lactic acid) by advanced thermal analysis, Polymer 50 (2009) 3967–3973,
https://doi.org/10.1016/j.polymer.2009.06.052.
[39] S. Fernandes Nassar, A. Guinault, N. Delpouve, V. Divry, V. Ducruet, C. Sollogoub, S. Domenek, Multi-scale analysis of the impact of polylactide morphology on gas barrier properties, Polymer 108 (2017) 163–172, https://doi.org/10.1016/j. polymer.2016.11.047.
[40] A.R. Bras, P. Malik, M. Dionisio, J.F. Mano, Influence of crystallinity in molecular motions of poly(L-lactic acid) investigated by dielectric relaxation spectroscopy, Macromolecules 41 (2008) 6419–6430, https://doi.org/10.1021/ma800842a. [41] E. Zuza, J.M. Ugartemendia, A. Lopez, E. Meaurio, A. Lejardi, J.-R. Sarasua, Glass
transition behavior and dynamic fragility in polylactides containing mobile and rigid amorphous fractions, Polymer 49 (2008) 4427–4432, https://doi.org/ 10.1016/j.polymer.2008.08.012.
[42] N. Delpouve, A. Saiter, J. Mano, E. Dargent, Cooperative rearranging region size in semi–crystalline poly(L–lactic acid), Polymer 49 (2008) 3130–3135, https://doi. org/10.1016/j.polymer.2008.04.045.
[43] N. Delpouve, M. Arnoult, A. Saiter, E. Dargent, J. M. Saiter, Evidence of two mobile amorphous phases in semi-crystalline polylactide observed from calorimetric investigations, Polym. Eng. Sci. 54 (2014) 1144–1150, https://doi. org/10.1002/pen.23657.
[44] K. Liao, D. Quan, Z. Lu, Effects of physical aging on glass transition behavior of poly(dl lactide), Eur. Polym. J. 38 (2002) 157–162, https://doi.org/10.1016/ S0014-3057(01)00166-5.
[45] Y. Wang, J.L. G�omez Ribelles, M. Salmer�on S�anchez, J.F. Mano, Morphological contributions to glass transition in poly(l lactic acid), Macromolecules 38 (2005) 4712–4718, https://doi.org/10.1021/ma047934i.
[46] M.C. Righetti, D. Prevosto, E. Tombari, Time and temperature evolution of the rigid amorphous fraction and differently constrained amorphous fractions in PLLA, Macromol. Chem. Phys. 217 (2016) 2013–2026, https://doi.org/10.1002/ macp.201600210.
[47] J. Kansy, Microcomputer program for analysis of positron annihilation lifetime spectra, Nucl. Instrum. Methods A 374 (1996) 235–244, https://doi.org/10.1016/ 0168-9002(96)00075-7.
[48] Y.Y. Wang, H. Nakanishi, Y.C. Jean, T.C. Sandreczki, Positron annihilation in amine–cured epoxy polymers–pressure dependence, J. Polym. Sci. Polm. Phys. 28 (1990) 1431–1441, https://doi.org/10.1002/polb.1990.090280902.
[49] S.J. Tao, Positroniium annihilation in molecular substances, J. Chem. Phys. 56 (1972) 5499, https://doi.org/10.1063/1.1677067.
[50] M. Eldrup, D. Lightbody, J.N. Sherwood, The temperature dependence of positron lifetimes in solid pivalic acid, Chem. Phys. 63 (1981) 51–58, https://doi.org/ 10.1016/0301-0104(81)80307-2.
[51] R. Zaleski, J. Wawryszczuk, T. Goworek, Pick–off models in the studies of mesoporous silica MCM–41. Comparison of various methods of the PAL spectra analysis, Radiat. Phys. Chem. 76 (2007) 243–247, https://doi.org/10.1016/j. radphyschem.2006.03.044.
[52] T. Goworek, B. Jasinska, J. Wawryszczuk, R. Zaleski, T. Suzuki, On possible deviations of experimental PALS data from positronium pick-off model estimates, Chem. Phys. 280 (2002) 295–307, https://doi.org/10.1016/S0301-0104(02) 00491-3.
[53] A.A. Lacey, D.M. Price, M. Reading, Theory and practice of modulated temperature differential scanning calorimetry (Chapter 1), in: M. Reading, D.J. Hourston (Eds.), Modulated Temperature Differential Scanning Calorimetry, vol. 6Springer, Dordrecht, Netherlands, 2006, pp. 1–81, https://doi.org/10.1007/1-4020-3750-3. [54] S. Weyer, A. Hensel, C. Schick, Phase angle correction for TMDSC in the
glass transition region, Thermochim. Acta 304 305 (1997) 267–275, https://doi. org/10.1016/S0040-6031(97)00180-9.
[55] E. Hempel, G. Hempel, A. Hensel, C. Schick, E. Donth, Characteristic length of dynamic glass transition near Tg for a wide assortment of glass forming substances, J. Phys. Chem. B 104 (2000) 2460–2466, https://doi.org/10.1021/ jp991153f.
[56] Y.Z. Chua, R. Zorn, O. Holderer, J.W.P. Schmelzer, C. Schick, E. Donth, Temperature fluctuations and the thermodynamic determination of the cooperativity length in glass forming liquids, J. Chem. Phys. 146 (2017) 104501,
https://doi.org/10.1063/1.4977737.
[57] K. Grzybowska, A. Grzybowski, Z. Wojnarowska, J. Knapik, M. Paluch, Ionic liquids and their bases: striking differences in the dynamic heterogeneity near the glass transition, Sci. Rep. 5 (2015) 16876, https://doi.org/10.1038/srep16876. [58] M. Pyda, R.C. Bopp, B. Wunderlich, Heat capacity of poly(lactic acid), J. Chem.
Thermodyn. 36 (2004) 731–742, https://doi.org/10.1016/j.jct.2004.05.003. [59] J. Zhang, K. Tashiro, H. Tsuji, A.J. Domb, Disorder–to–order phase transition and
multiple melting behavior of poly(l–lactide) investigated by simultaneous measurements of WAXD and DSC, Macromolecules 41 (2008) 1352–1357, https:// doi.org/10.1021/ma0706071.
[60] T. Kawai, N. Rahman, G. Matsuba, K. Nishida, T. Kanaya, M. Nakano, H. Okamoto, J. Kawada, A. Usuki, N. Honma, K. Nakajima, M. Matsuda, Crystallization and melting behavior of poly (l–lactic Acid), Macromolecules 40 (2007) 9463–9469,
https://doi.org/10.1021/ma070082c.
[61] K. Wasanasuk, K. Tashiro, Structural regularization in the crystallization process from the glass or melt of poly(l–lactic Acid) viewed from the
temperature–dependent and time–resolved measurements of FTIR and Wide–Angle/Small–Angle X–ray scatterings, Macromolecules 44 (2011) 9650–9660, https://doi.org/10.1021/ma2017666.
[62] M.L. Di Lorenzo, R. Androsch, Influence of α0-/α-crystal polymorphism on
properties of poly(l-lactic acid), Polym. Int. 68 (2019) 320–334, https://doi.org/ 10.1002/pi.5707.
[63] M.C. Righetti, M. Gazzano, M.L. Di Lorenzo, R. Androsch, Enthalpy of melting of α’– and α–crystals of poly(L–lactic acid), Eur. Polym. J. 70 (2015) 215–220,
https://doi.org/10.1016/j.eurpolymj.2015.07.024.
[64] E.W. Fischer, H.J. Sterzel, G. Wegner, Investigation of the structure of solution grown crystals of lactide copolymers by means of chemical reactions, Kolloid Z. Z. Polym. 251 (1973) 980–990, https://doi.org/10.1007/BF01498927.
[65] R. Picciochi, Y. Wang, N.M. Alves, J.F. Mano, Glass transition of semi–crystalline PLLA with different morphologies as studied by dynamic mechanical analysis, Colloid Polym. Sci. 285 (2007) 575–580, https://doi.org/10.1007/s00396-006- 1590-8.
[66] M.L. Di Lorenzo, M. Gazzano, M.C. Righetti, The role of the rigid amorphous fraction on cold crystallization of poly(3-hydroxybutyrate), Macromolecules 45 (2012) 5684–5691, https://doi.org/10.1021/ma3010907.
[67] M.C. Righetti, M. Laus, M.L. Di Lorenzo, Temperature dependence of the rigid amorphous fraction in poly(ethylene terephthalate), Eur. Polym. J. 58 (2014) 60–68, https://doi.org/10.1016/j.eurpolymj.2014.06.005.
[68] C. Schick, A. Wurm, A. Mohamed, Vitrification and devitrification of the rigid amorphous fraction of semicrystalline polymers revealed from
frequency–dependent heat capacity, Colloid Polym. Sci. 79 (2001) 800–806,
https://doi.org/10.1007/s003960100507.
[69] J. Pak, M. Pyda, B. Wunderlich, Rigid amorphous fractions and glass transitions in poly(oxy–2,6–dimethyl–1,4–phenylene), Macromolecules 362 (2003) 495–499,
https://doi.org/10.1021/ma021487u.
[70] J. Martín, N. Stingelin, D. Cangialosi, Direct calorimetric observation of the rigid amorphous fraction in a semiconducting polymer, J. Phys. Chem. Lett. 9 (2018) 990–995, https://doi.org/10.1021/acs.jpclett.7b03110.
[71] B.S. Beckingham, V. Ho, R.A. Segalman, Formation of a rigid amorphous fraction in Poly(3-(20-ethyl)hexylthiophene), ACS Macro Lett. 37 (2014) 684–688, https://
doi.org/10.1021/mz500262d.
[72] M.L. Di Lorenzo, M.C. Righetti, Crystallization–induced formation of rigid amorphous fraction, Polym. Cryst. 1 (2018), e10023, https://doi.org/10.1002/ pcr2.10023.
[73] Q. Ma, M. Pyda, B. Mao, P. Cebe, Relationship between the rigid amorphous phase and mesophase in electrospun fibers, Polymer 54 (2013) 2544–2554, https://doi. org/10.1016/j.polymer.2013.03.019.
[74] Rui-Jie Xu, Zi-Qin Tian, Jia-Yi Xie, Cai-Hong Lei, The structure transformation of pre–oriented polylactic acid film during uniaxial stretching at room temperature, Polym. Cryst. 2 (2019), e10072, https://doi.org/10.1002/pcr2.10072. [75] Q. Ma, G. Georgiev, P. Cebe, Constraints in semicrystalline polymers: using
quasi–isothermal analysis to investigate the mechanisms of formation and loss of the rigid amorphous fraction, Polymer 52 (2011) 4562–4570, https://doi.org/ 10.1016/j.polymer.2011.08.006.
[76] J. Lin, S. Shenogin, S. Nazarenko, Oxygen solubility and specific volume of rigid amorphous fraction in semicrystalline poly(ethylene terephthalate), Polymer 43 (2002) 4733–4743, https://doi.org/10.1016/S0032-3861(02)00278-1. [77] M. Sharma, G. Madras, S. Bose, Unusual fragility and cooperativity in
glass–forming and crystalline PVDF/PMMA blends in the presence of multiwall carbon nanotubes, Macromolecules 48 (8) (2015) 2740–2750, https://doi.org/ 10.1021/acs.macromol.5b00418.
[78] S. Araujo, F. Batteux, W. Li, L. Butterfield, N. Delpouve, A. Esposito, L. Tan, J.- M. Saiter, M. Negahban, A structural interpretation of the two components governing the kinetic fragility from the example of interpenetrated polymer networks, J. Polym. Sci. B Polym. Phys. 56 (2018) 1393–1403, https://doi.org/ 10.1002/polb.24722.
[79] C. Schick, E. Donth, Characteristic length of glass transition: experimental evidence, Phys. Scripta 43 (4) (1991) 423–439, https://doi.org/10.1088/0031- 8949/43/4/010.
[80] Y. Furushima, K. Ishikiriyama, T. Higashioji, The characteristic length of cooperative rearranging region for uniaxial drawn poly(ethylene terephthalate) films, Polymer 54 (2013) 4078–4084, https://doi.org/10.1016/j.
polymer.2013.06.030.
[81] A. Codou, M. Moncel, J.G. van Berkel, N. Guigo, N. Sbirrazzuoli, Glass transition dynamics and cooperativity length of poly(ethylene 2,5–furandicarboxylate) compared to poly(ethylene terephthalate), Phys. Chem. Chem. Phys. 18 (2016) 16647–16658, https://doi.org/10.1039/C6CP01227B.
[82] S. Fernandes Nassar, S. Domenek, A. Guinault, G. Stoclet, N. Delpouve, C. Sollogoub, Structural and dynamic heterogeneity in the amorphous phase of poly(L,L–lactide) confined at the nanoscale by the coextrusion process, Macromolecules 51 (2018) 128–136, https://doi.org/10.1021/acs. macromol.7b02188.
[83] A. Esposito, N. Delpouve, V. Causin, A. Dhotel, L. Delbreilh, E. Dargent, From a three–phase model to a continuous description of molecular mobility in semicrystalline poly(hydroxybutyrate-co-hydroxyvalerate), Macromolecules 49 (2016) 4850–4861, https://doi.org/10.1021/acs.macromol.6b00384. [84] G. Floudas, T. Pakula, E.W. Fischer, Density and concentration fluctuations in
plasticized poly(cyclohexyl methacrylate) as studied by X ray diffraction, Macromolecules 27 (1994) 917–922, https://doi.org/10.1021/ma00082a006. [85] C.M. Roland, K.L. Ngai, Dynamical heterogeneity in a miscible polymer blend,
Macromolecules 24 (1991) 2261–2265, https://doi.org/10.1021/ma00009a021. [86] P. Shi, R. Schach, E. Munch, H. Montes, F. Lequeux, Glass transition distribution in
miscible polymer blends: from calorimetry to rheology, Macromolecules 46 (2013) 3611–3620, https://doi.org/10.1021/ma400417f.
[87] M. Beiner, H. Huth, Nanophase separation and hindered glass transition in side–chain polymers, Nat. Mater. 2 (2003) 595–599, https://doi.org/10.1038/ nmat966.
[88] A. Arbe, A.-C. Genix, S. Arrese–Igor, J. Colmenero, D. Richter, Dynamics in poly(n- alkyl methacrylates): a neutron scattering, calorimetric, and dielectric study, Macromolecules 43 (2010) 3107–3119, https://doi.org/10.1021/ma902833h.